. 2021 Nov 11;12(1):6495.
doi: 10.1038/s41467-021-26834-3.

Mesenchymal stromal cell apoptosis is required for their therapeutic function

Affiliations

Mesenchymal stromal cell apoptosis is required for their therapeutic function

Swee Heng Milon Pang et al. Nat Commun. .

Abstract

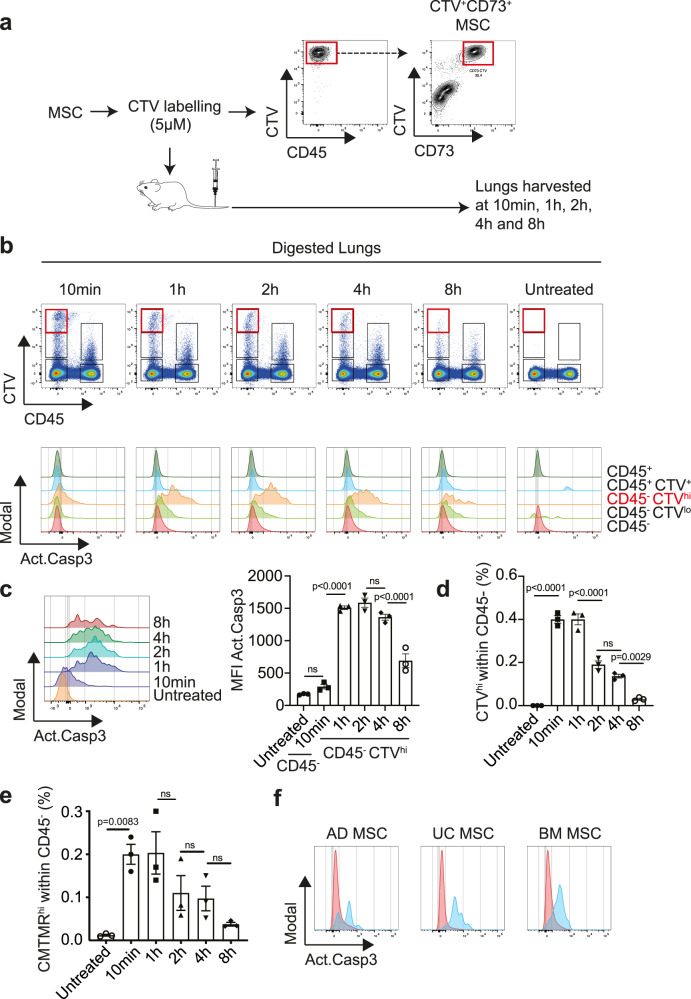
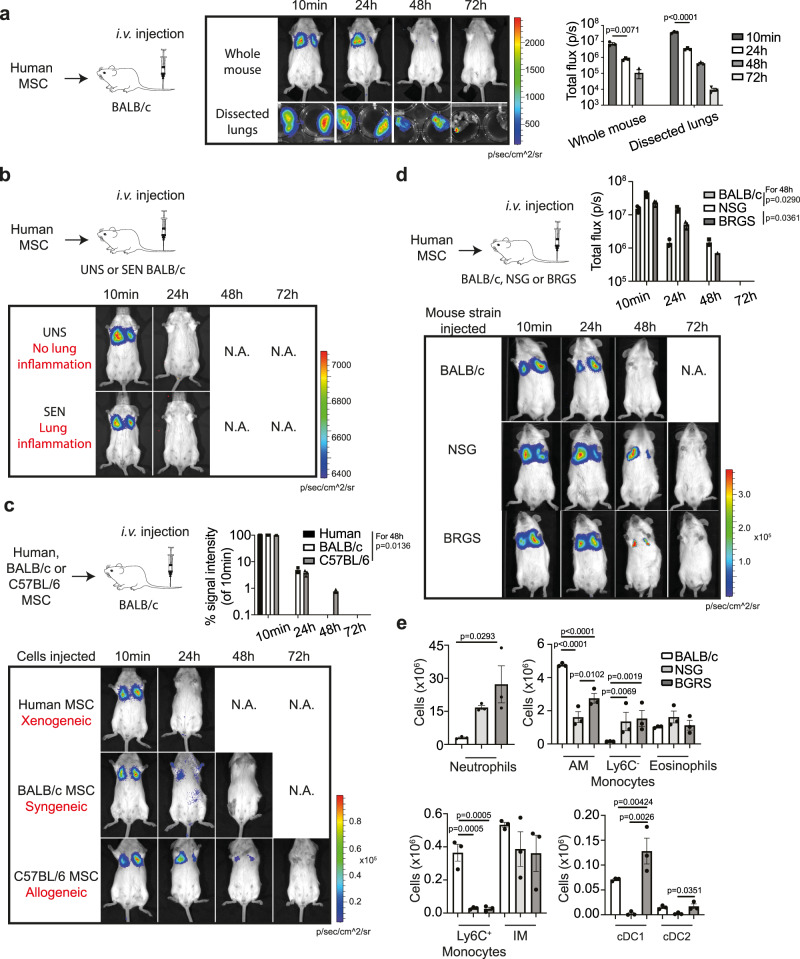
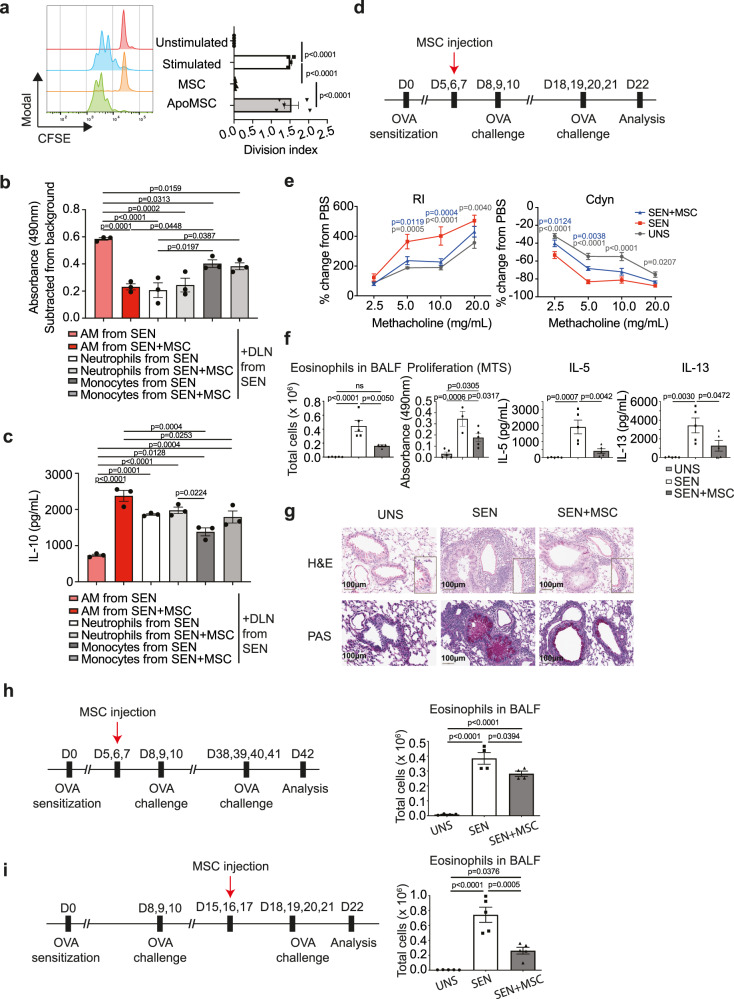
Multipotent mesenchymal stromal cells (MSCs) ameliorate a wide range of diseases in preclinical models, but the lack of clarity around their mechanisms of action has impeded their clinical utility. The therapeutic effects of MSCs are often attributed to bioactive molecules secreted by viable MSCs. However, we found that MSCs underwent apoptosis in the lung after intravenous administration, even in the absence of host cytotoxic or alloreactive cells. Deletion of the apoptotic effectors BAK and BAX prevented MSC death and attenuated their immunosuppressive effects in disease models used to define MSC potency. Mechanistically, apoptosis of MSCs and their efferocytosis induced changes in metabolic and inflammatory pathways in alveolar macrophages to effect immunosuppression and reduce disease severity. Our data reveal a mode of action whereby the host response to dying MSCs is key to their therapeutic effects; findings that have broad implications for the effective translation of cell-based therapies.


Conflict of interest statement

T.S.P.H. received funding from Mesoblast Ltd and Regeneus Ltd outside of this work. The funders were not involved in the study design, collection, analysis, interpretation of data, the writing of this article or the decision to submit it for publication. N.D.H. and J.R. are founders and shareholders of oNKo-Innate Pty. Ltd, a discovery stage biotechnology company focussed on immuno-oncology, not related to this work. The remaining authors declare no competing interests.

Figures

Fig. 1
Fig. 1. MSCs undergo apoptosis in the lungs shortly after i.v. administration.
a MSCs were labelled with CTV and the fluorescence intensity was measured prior to injection to guide gating of MSCs re-isolated from mouse lungs after injection. CTV+ MSCs were CD45CD73+. b Top panel shows representative flow cytometric plots of different populations identified by CTV and CD45 markers in lung samples at various timepoints after MSC injection. CD45CTVhi MSCs are indicated by the red box, as shown in a. Lower panel shows expression levels of activated caspase 3 in CD45CTV, CD45CTVlo, CD45CTVhi, CD45+CTV and CD45+CTV+ populations. c Expression levels and mean fluorescence intensity (MFI) of activated caspase-3 on CD45 (from untreated mice that did not receive MSCs) and CD45CTVhi (from mice that received CTV+ MSCs) at various timepoints, as shown in b. Data expressed as mean ± SEM, n = 3 mice per group over three independent experiments. d Frequency of CTVhi within the CD45 population as shown as in b. Data expressed as mean ± SEM, n = 3 mice per group over three independent experiments. e Frequency of CMTMRhi within the CD45 population in lungs from mice that received CMTMR-labelled MSCs in a separate experiment. Data expressed as mean ± SEM. n = 3 mice per group. f Expression levels of activated caspase 3 in CTV-labelled adipose (AD), umbilical cord (UC) or bone marrow (BM) MSCs re-isolated from mouse lungs 4 h after i.v. injection. Data representative of two independent experiments. p values by one-way ANOVA (Tukey’s post hoc test); ns not significant. Source data are provided as a Source Data file.
Fig. 2
Fig. 2. Apoptotic MSCs retain their immunosuppressive capacity in vivo.
a MSCs were treated with 0.5 μM of STS for 6 h before i.v. administration into OVA-sensitised mice prior to OVA challenge. Flow cytometric plots of AnnexinV vs. PI staining in MSCs after treatment with STS for 6 h, and at 12 h later following removal from STS. b Number of eosinophils in BALF (Data expressed as mean ± SEM; n = 5 mice per group), and IL-5 and IL-13 production by DLN cells in response to OVA restimulation. UNS = unsensitised mice; SEN = OVA-sensitised mice; MSC = OVA-sensitised mice that received MSCs; STS-MSC = OVA-sensitised mice that received STS-treated MSCs. Data expressed as mean ± SEM (UNS n = 5; SEN n = 3; MSC n = 4; STS-MSC n = 5). p values by one-way ANOVA (Tukey’s post hoc test); ns, not significant. c Frequency of AnnexinV+ MSCs 72 h following treatment with different concentrations of individual BH3-mimetic drugs inhibiting MCL-1, BCL-2 or BCL-XL, or a combination of all three. Data representative of two independent experiments. d MSCs were treated with 1.25 μM of BH3-mimetic drugs for 24 h to induce apoptosis before i.v. administration into OVA-sensitised mice. e Total number of eosinophils in lungs (Data expressed as mean ± SEM; UNS n = 5; SEN n = 5; MSC n = 4; BH3-MSC n = 4), and DLN OVA-specific IL-5 and IL-13 production. (Data expressed as mean ± SEM; UNS n = 6; SEN n = 4; MSC n = 4; BH3-MSC n = 5). p values by one-way ANOVA (Tukey’s post hoc test); ns, not significant. f RI (UNS n = 3; SEN n = 4; MSC n = 5; BH3-MSC n = 5) and Cdyn (UNS n = 5; SEN n = 5; MSC n = 4; BH3-MSC n = 5) in response to increasing doses of methacholine on Day 12. Data expressed as mean ± SEM; p values by two-way ANOVA (Tukey’s post hoc test), compared with SEN. g Lung sections were stained with H&E and PAS for pulmonary inflammation and mucus production respectively. Magnification 20x, scale bar = 100 μm. Histological images were representative of five mice per group. Source data are provided as a Source Data file.
Fig. 3
Fig. 3. BKX-MSCs display reduced immunosuppressive capacity in vivo.
a Generation of BKX-MSCs by selective expansion of apoptosis-resistant MSCs following multiple rounds of treatment with BH3-mimetic drugs (1.25 μM x 2 rounds, then 10 μM x 2 rounds). b Nontargeted MSCs and BKX-MSCs were treated with 1.25 μM or 10 μM BH3-mimetic drugs, for 2 or 24 h, then lysed and analysed for BAX and BAK protein levels by Western blotting. GAPDH served as the control for equal protein loading. Untreated MSCs and HeLa cells served as positive controls, and BAX/BAK double knockout (DKO) HeLa cells served as negative control. Data representative of two independent experiments. c Activated caspase-3 levels in CTV-labelled MSCs or BKX-MSCs re-isolated from mouse lungs 10 min and 1 h after i.v. injection. Data representative of two independent experiments. d OVA-sensitised mice received MSCs or BKX-MSCs prior to OVA challenge. OVA-specific DLN cell proliferation, measured by CFSE dilution (UNS n = 12; SEN n = 12; MSC n = 12; BKX-MSC n = 11) and MTS bioreduction (UNS n = 4; SEN n = 5; MSC n = 6; BKX-MSC n = 6). Data expressed mean ± SEM. p values by one-way ANOVA (Tukey’s post hoc test); ns not significant. e Number of eosinophils (n = 5 mice per group) and AMs (n = 6 mice per group) in the lungs, and DLN OVA-specific IL-5 and IL-13 production (UNS n = 6; SEN n = 6; MSC n = 8; BKX-MSC n = 7). Data expressed as mean ± SEM, p values by one-way ANOVA (Tukey’s post hoc test); ns, not significant. f Measurement of RI (UNS n = 5; SEN n = 9; MSC n = 12; BKX-MSC n = 10) and Cdyn (UNS n = 4; SEN n = 9; MSC n = 12; BKX-MSC n = 10) in response to increasing doses of methacholine on Day 12. UNS = unsensitized mice; SEN = OVA-sensitised mice; MSC = OVA-sensitised mice that received MSCs; BKX-MSC = OVA-sensitised mice that received BKX-MSCs. Data expressed mean ± SEM, p values by two-way ANOVA (Tukey’s post hoc test), compared with SEN. g Lung sections were stained with H&E and PAS to analyse for pulmonary inflammation and mucus production, respectively. Magnification 20x, scale bar = 100 μm. Histological images were representative of 5 mice per group. h Mean daily clinical scores of EAE mice that received PBS, MSCs or BKX-MSCs on Days 1, 3 and 5 (arrows indicate days of MSC injections). Data expressed as mean ± SEM, six mice per group. p value by Kruskal-Wallis (Dunn’s post hoc test). i CNS sections were stained with H&E and LFB to assess infiltrating inflammatory cells and demyelination respectively. Representative of 6 mice per group. Scale bar = 300 μm. j MOG-specific LN cell proliferation of EAE mice that received PBS, MSCs or BKX-MSCs and euthanised on Day 9 (n = 6 mice per group) and 29 (NAÏVE n = 3; EAE n = 4; MSC n = 6; BKX-MSC n = 6). Data expressed as mean ± SEM, p values compared to PBS group (one-way ANOVA, Tukey’s post hoc test). k Percentage of CD45+Ly6GLy6Chi monocytes and CD45+Ly6G+Ly6Cint neutrophils in the blood on Day 9. Data expressed as mean ± SEM, n = 6 mice per group. p values by one-way ANOVA (Tukey’s post hoc test). Source data are provided as a Source Data file.
Fig. 4
Fig. 4. MSCs are cleared despite the absence of cytotoxic cells or allorecognition.
a Bioluminescent images of the whole body and dissected lungs, and quantification of total flux following i.v. administration of human MSCs into BALB/c mice. Data expressed as mean ± SEM, n = 3 mice per group, representative of two independent experiments. p values by two-way ANOVA (Tukey’s post hoc test). b Bioluminescent images of unsensitised (UNS) versus OVA-sensitised (SEN) mice injected with human MSCs following intranasal challenge with OVA. Representative images of two independent experiments (n = 3 mice per group) c Administration of human MSCs (xenogeneic) versus BALB/c MSCs (syngeneic) versus C57BL/6 MSCs (allogeneic) into BALB/c mice. Bioluminescent images and quantification of total flux with data expressed as mean ± SEM, three mice per group, representative of two independent experiments. p values for 48 h by two-way ANOVA (Tukey’s post hoc test). d Administration of human MSCs into BALB/c versus NSG versus BRGS mice. Bioluminescent images and quantification of total flux with data expressed as mean ± SEM, n = 3 mice per group, representative of two independent experiments. p values for 48 h by two-way ANOVA (Tukey’s post hoc test). e Total cell number of various myeloid cell populations measured in lungs of BALB/c, NSG and BGRS mice. Data expressed as mean ± SEM, n = 3 mice per group, representative of two independent experiments. p values by one-way ANOVA (Tukey’s post hoc test). Source data are provided as a Source Data file.
Fig. 5
Fig. 5. MSCs are taken up by phagocytic cells in the lungs.
a Flow cytometric gating strategy for identifying myeloid cell populations in the lungs. b Frequencies of lung phagocytes that had taken up CTV-labelled MSCs at various timepoints after i.v. injection into BALB/c mice. Data expressed as mean ± SEM, n = 3 mice per group, three independent experiments. c Expression levels and MFI of MHC class II in neutrophils, monocytes and AMs that had taken up CTV+ MSCs 1 h after injection, compared to phagocytes that had not (CTV). Data expressed as mean ± SEM, n = 3 mice per group, three independent experiments. p values by unpaired Student’s t test (two-tailed). Right-most panel shows MHC class II expression in AMs isolated from the lungs of OVA-sensitised mice on Day 12. SEN = OVA-sensitised mice; SEN + MSC = OVA-sensitised mice that received MSCs. Data representative of three independent experiments. d Flow cytometric plots of various phagocyte populations in the lungs, following injection of pHrodoTMRED-labelled MSCs. Data representative of two independent experiments; n = 3 mice per group. e Snapshots from live-cell imaging, showing CTG-labelled AMs (grey arrow) approach, attach and engulf pHrodoTMRED-labelled BH3-mimetic drug-treated MSCs (blue arrow), resulting in a signal flare (Supplementary Movie 1). BH3-mimetic drug-treated BKX-MSCs were not engulfed by AMs (Supplementary Movie 2). Magnification, 10x; Scale bars, 50 µM. Data representative of three experiments. f Bioluminescent images and total flux at various timepoints following injection of MSCs into untreated (n = 6) and clodronate-treated (AM-depleted; n = 5) BALB/c mice. Data expressed as mean ± SEM, 5–6 mice per group. Source data are provided as a Source Data file.
Fig. 6
Fig. 6. MSC treatment causes major transcriptional changes in AMs to dampen lung inflammation and asthma.
a Unsensitised or OVA-sensitised mice received MSCs on day (D) 5, 6 and 7. AMs from BALF were FACS purified for RNA-sequencing either prior to (D8) or following (D12) OVA challenge. PCA analysis of genes from D8 and D12 treatment groups. Plots were generated using the top 100 variable genes within samples. Each dot represents data from 5 pooled samples. b Venn diagram showing number of overlapping DEGs among different treatment groups in D12, obtained by setting a filter of 1 CPM (counts per millions) and FDR of 0.05. c Classification of DEGs (obtained from b) by KEGG pathway enrichment. d Heatmap showing genes with an FDR of 0.05 that are broadly associated with M1/M2 macrophage polarisation. e Volcano plot comparing DEGs from D12 SEN versus D12 SEN + MSC groups. Gene expression changes with a fold-change greater or less than 1.5 were shown as red dots. Selected genes highlighted in green represent genes that were upregulated in UNS versus SEN and downregulated in SEN + MSC, whereas those in orange represent genes that were downregulated in UNS versus SEN and upregulated in SEN + MSC. Selected genes in black indicate interferon regulated genes identified via Interferome. f GSEA plots showing enrichment of genes from the Interferon-Alpha Response (ES: 0.66824204, NES: 2.684128, FDR q value: 0.0, nominal p value: 0.0), Interferon-Gamma Response (ES: 0.59893006, NES: 2.6195564, FDR q value: 0.0, nominal p value: 0.0), Oxidative Phosphorylation (ES: −0.74083024, NES: −3.1281621, FDR q value: 0.0, nominal p value: 0.0), Fatty Acid Metabolism (ES: −0.48348597, NES: −1.9388303, FDR q value: 1.6666666E-4, nominal p value: 0.0), and Glycolysis (ES: −0.4049271, NES: −1.6384116, FDR q value: 0.013858369, nominal p value: 0.0016447369) hallmark gene sets in D12 SEN + MSC compared to D12 SEN. Unbiased GSEA was performed using software from the Broad Institute against hallmark gene sets (n = 50) and C2 curated gene sets (n = 4063) from the Molecular Signatures Database (MSigDB). Significant enrichment was defined as a p ≤ 0.05 and FDR < 0.25. Interferon regulated genes were identified using the Interferome v2.01 database. Source data are provided as a Source Data file.
Fig. 7
Fig. 7. AMs from MSC-treated mice exhibit immunomodulatory effects.
a Flow cytometric histogram plot and bar chart demonstrating that humans MSCs, but not apoptotic MSCs (ApoMSCs, BH3-mimetic drug-treated), inhibited the proliferation of αCD3/CD28-stimulated CFSE-labelled purified T cells (Unstimulated n = 5; Stimulated n = 4; MSC n = 5; ApoMSC n = 5). Data expressed as mean ± SEM, representative of two independent experiments. p values by one-way ANOVA (Tukey’s post hoc test). b Monocytes and AMs were FACSorted from SEN or SEN + MSC-treated mice on D12, then cocultured with DLN cells from SEN mice (1:5 myeloid cell:responder ratio) in the presence of OVA. AMs, but not monocytes, from SEN + MSC mice inhibited the proliferative response to OVA. Data expressed as mean ± SEM, representative of two independent experiments; n = 3 biological independent samples per group. p values by one-way ANOVA (Tukey’s post hoc test). c AMs, but not monocytes, from SEN + MSC mice induced IL-10 production in response to OVA. Data representative of two independent experiments. Data expressed as mean ± SEM, representative of two independent experiments, n = 3 biological independent samples per group. p values by one-way ANOVA (Tukey’s post hoc test). d Timeline for MSC treatment in Day 22 OVA re-challenge model. e RI and Cdyn of mice from D in response to increasing doses of methacholine. Data expressed as mean ± SEM (UNS n = 7; SEN n = 6, SEN + MSC n = 8). p values by two-way ANOVA (Tukey’s post hoc test), compared with SEN. f Number of eosinophils in BALF (UNS n = 5; SEN n = 5, SEN + MSC n = 4), OVA-specific DLN proliferation, measured by MTS bioreduction (UNS n = 5; SEN n = 3, SEN + MSC n = 5) and IL-5 and IL-13 production after OVA restimulation of T cells (n = 5 per group). Data expressed as mean ± SEM, p values by one-way ANOVA (Tukey’s post hoc test). g Lung sections were stained with H&E and PAS to analyse for pulmonary inflammation and mucus production respectively. Magnification 20x, scale bar = 100 µM. Histological images were representative of five mice per group. h Timeline for MSC treatment in Day 42 OVA re-challenge model and number of eosinophils in BALF. Data expressed as mean ± SEM (n = 5 per group). p values by one-way ANOVA (Tukey’s post hoc test). i Timeline for MSC treatment after intranasal OVA challenge and total number of eosinophils in BALF. Data expressed as mean ± SEM (n = 5 per group). p values by one-way ANOVA (Tukey’s post hoc test). Source data are provided as a Source Data file.

Comment in

References

    1. Prockop DJ, Oh JY, Lee RH. Data against a common assumption: xenogeneic mouse models can be used to assay suppression of immunity by human MSCs. Mol. Ther. 2017;25:1748–1756. - PMC - PubMed
    1. Galipeau J, Sensebe L. Mesenchymal stromal cells: clinical challenges and therapeutic opportunities. Cell Stem Cell. 2018;22:824–833. - PMC - PubMed
    1. Martin I., Galipeau J., Kessler C., Le Blanc K., Dazzi F. Challenges for mesenchymal stromal cell therapies. Sci. Transl. Med.11, eaat2189 (2019). - PubMed
    1. Khoury M., et al. Current status of cell-based therapies for respiratory virus infections: applicability to COVID-19. Eur. Respir. J.55, 2000858 (2020). - PMC - PubMed
    1. Cherian DS, Bhuvan T, Meagher L, Heng TSP. Biological considerations in scaling up therapeutic cell manufacturing. Front Pharm. 2020;11:654. - PMC - PubMed

Publication types