. 2021 Nov 11;12(1):6496.
doi: 10.1038/s41467-021-26596-y.

A tissue-bioengineering strategy for modeling rare human kidney diseases in vivo

Affiliations

A tissue-bioengineering strategy for modeling rare human kidney diseases in vivo

J O R Hernandez et al. Nat Commun. .

Abstract

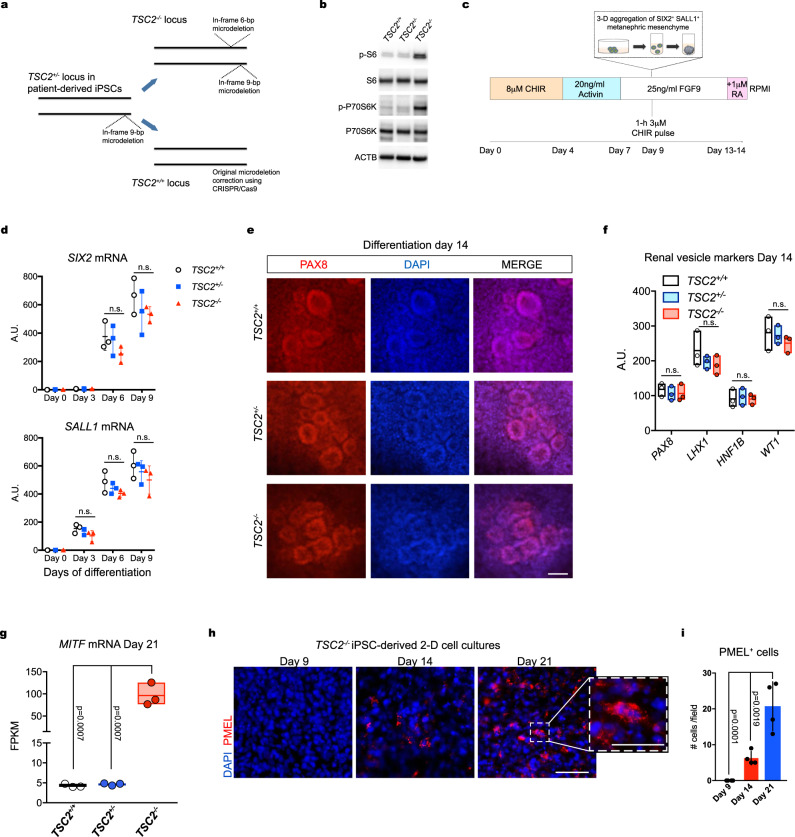
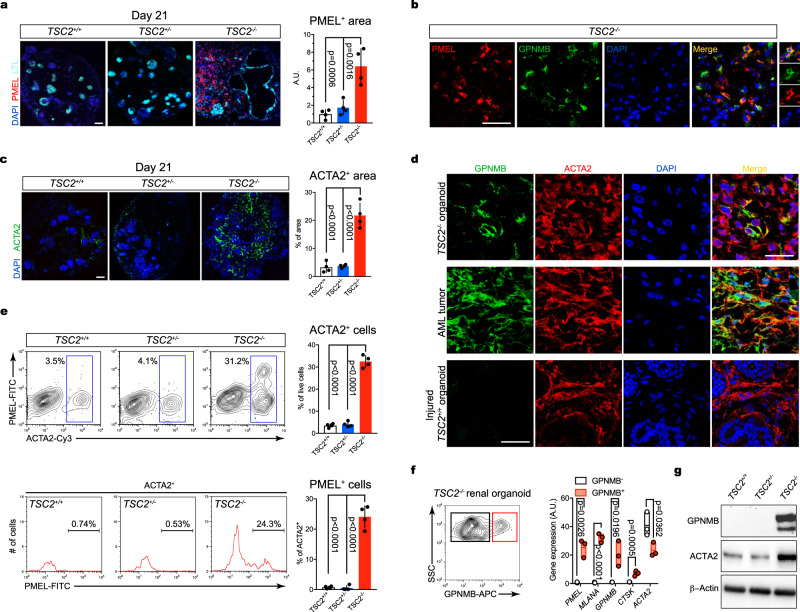
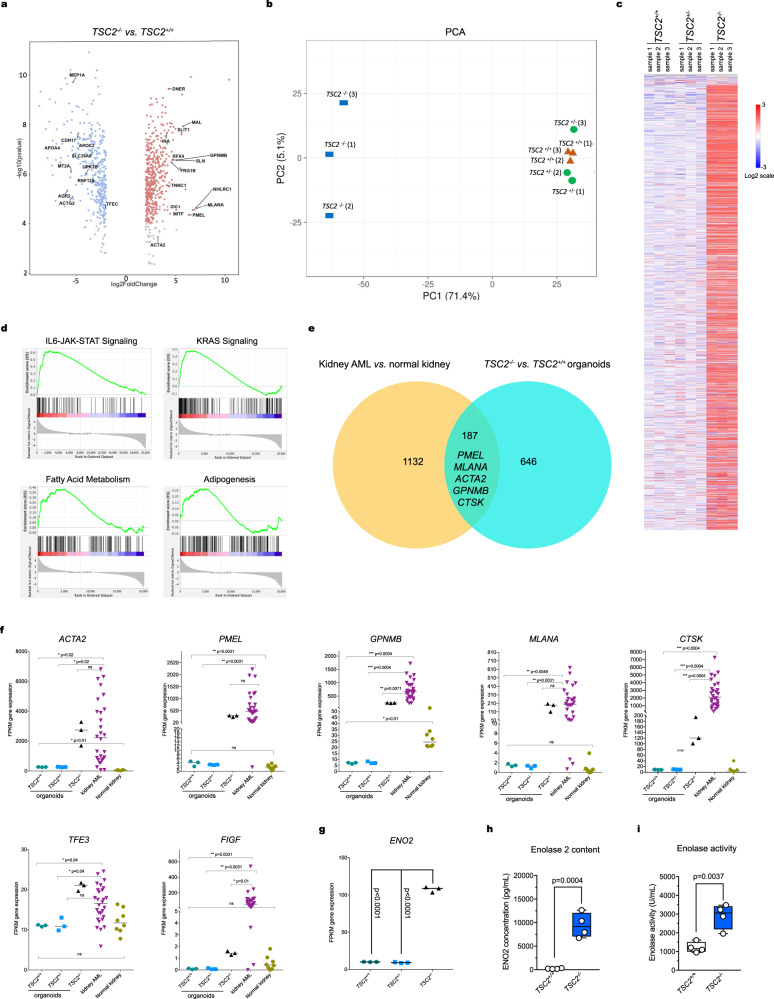
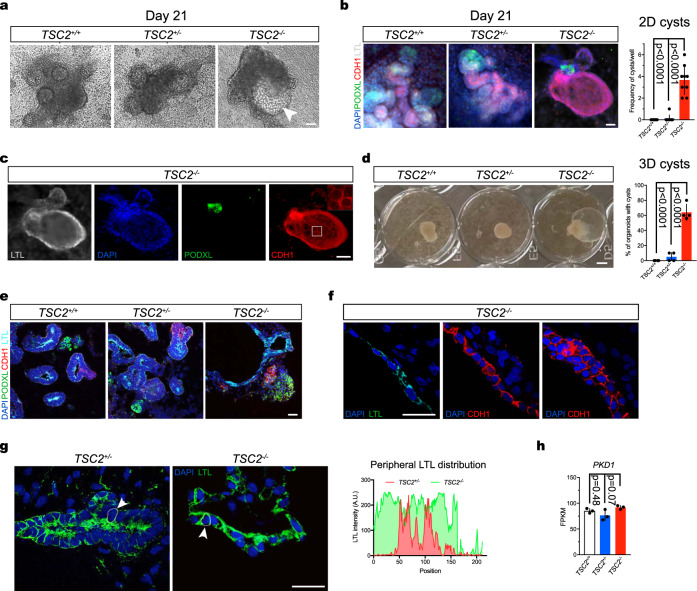
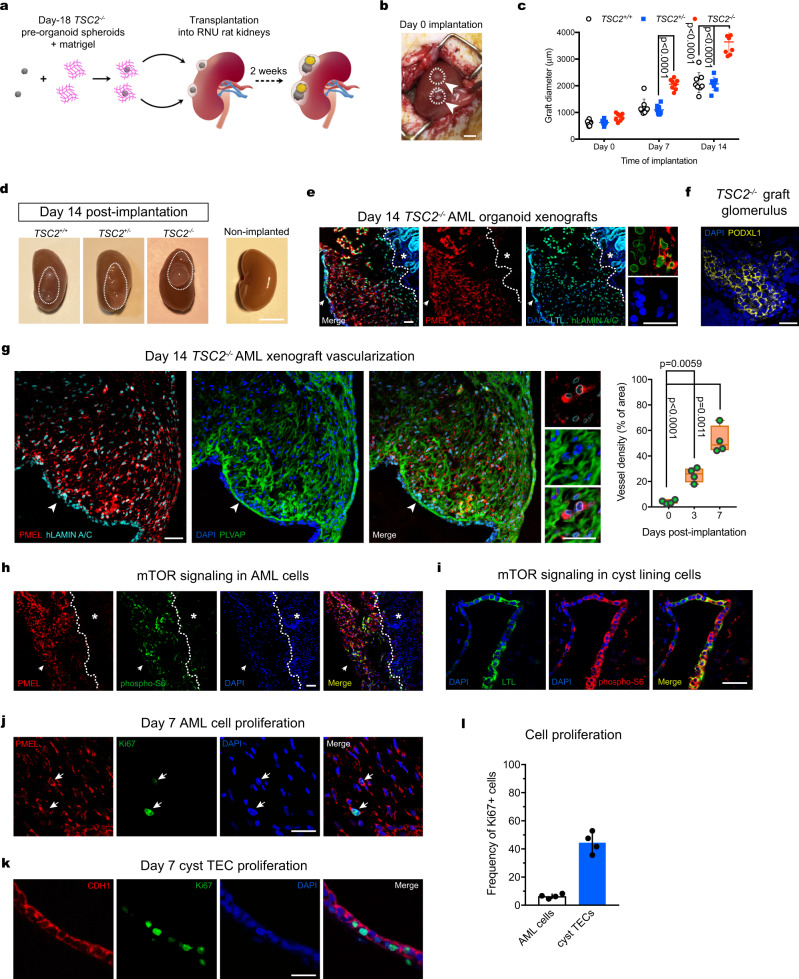
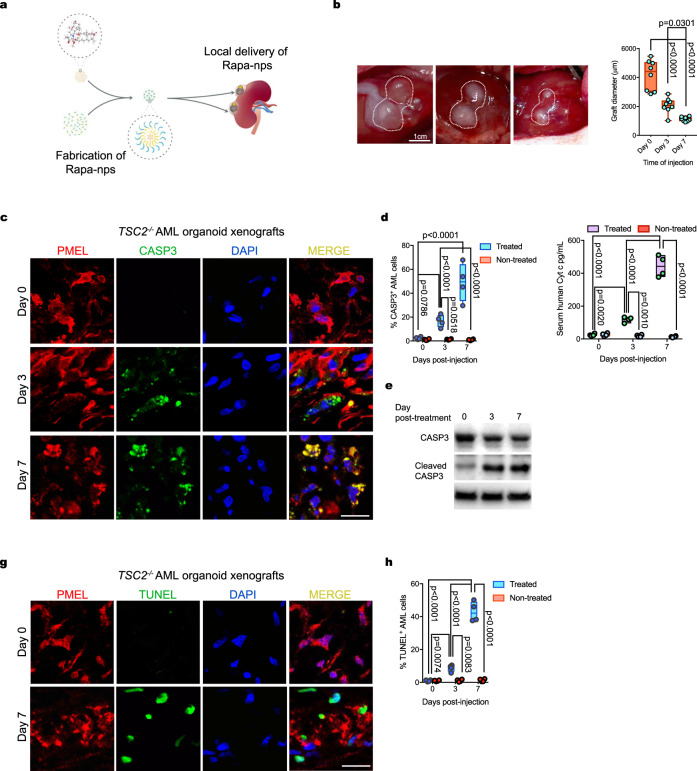
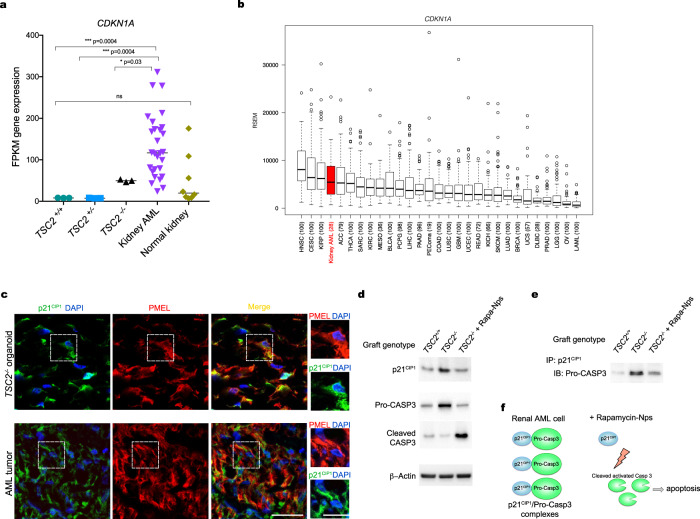
The lack of animal models for some human diseases precludes our understanding of disease mechanisms and our ability to test prospective therapies in vivo. Generation of kidney organoids from Tuberous Sclerosis Complex (TSC) patient-derived-hiPSCs allows us to recapitulate a rare kidney tumor called angiomyolipoma (AML). Organoids derived from TSC2-/- hiPSCs but not from isogenic TSC2+/- or TSC2+/+ hiPSCs share a common transcriptional signature and a myomelanocytic cell phenotype with kidney AMLs, and develop epithelial cysts, replicating two major TSC-associated kidney lesions driven by genetic mechanisms that cannot be consistently recapitulated with transgenic mice. Transplantation of multiple TSC2-/- renal organoids into the kidneys of immunodeficient rats allows us to model AML in vivo for the study of tumor mechanisms, and to test the efficacy of rapamycin-loaded nanoparticles as an approach to rapidly ablate AMLs. Collectively, our experimental approaches represent an innovative and scalable tissue-bioengineering strategy for modeling rare kidney disease in vivo.


Conflict of interest statement

The authors declare no competing interests.

Figures

Fig. 1
Fig. 1. Nephric differentiation of TSC2−/− hiPSCs results in generation of myoid melanocyte-like cells.
a Schematic representation of the gene-editing strategies used to either introduce a second inactivating mutation in the wild type allele of patient-derived TSC2+/− iPSCs, or to correct the original deletion mutation. b Immunoblots showing phosphorylation of S6 and p-70S6K in TSC2+/+, TSC2−/−, and TSC2+/− hiPSCs, indicating mTORC1 activation in the TSC2−/− cells. Similar results were obtained in two independent experiments. c Schematic representation for the hiPSC nephric differentiation protocol used to generate 2D renal tissues and 3D renal organoids. CHIR: CHIR99021; FGF9: fibroblast growth factor 9. d Quantitative real-time-polymerase chain reaction (RT-PCR) analysis of SIX2 and SALL1 mRNAs during the phase of metanephric mesenchyme induction. Curve points represent mean ± SD in arbitrary units (A.U. normalized to β-actin), n = 3 independent technical replicates. Nonsignificant mean differences determined by two-way ANOVA analysis using Tukey test for multiple comparisons are indicated as n.s. e Representative immunofluorescence images showing PAX8 expression in 2D TSC2+/+, TSC2−/−, and TSC2+/− cell cultures on Day 14 of differentiation. Scale bar, 50 μm. f Quantitative RT-PCR analysis of PAX8, LHX1, HNF1B and WT1 mRNAs in 2D TSC2+/+, TSC2−/− and TSC2+/− cell cultures on differentiation Day 14, showing similar expression independent of genotype. Floating bars graph represent mean ± SD, n = 3 independent experiments. Nonsignificant mean differences determined by two-way ANOVA analysis using Tukey test for multiple comparisons are indicated as n.s. g Expression of the AML transcription factor MITF as determined by RNAseq analysis of TSC2+/+, TSC2+/−, and TSC2−/− iPSC-derived renal organoids on differentiation Day 21. Floating bar graphs represent mean ± SD, n = 3 samples for each genotype, five organoids per sample. Gene expression is shown in fragments per kilo base per million mapped reads (FPKM) values. P values for individual comparisons done using Tukey test in one-way ANOVA analysis are indicated. h Representative immunofluorescence images of 2D TSC2−/− iPSC-derived cell cultures showing expression of PMEL on differentiation Days 9, 14, and 21. Scale bars, 25 μm and 12.5 μm for high magnification image. i Bar graphs showing the quantification of PMEL+ cells in immunofluorescence images taken at Days 9, 14, and 21 of differentiation in 2D conditions. Values in the bar graph represent mean ± SD, n = 4 experiments. P values for individual comparisons done using Tukey test in one-way ANOVA analysis are indicated.
Fig. 2
Fig. 2. TSC2−/− renal organoids recapitulate human AML tumor phenotype.
ac Confocal optical sections showing LTL with PMEL (a), PMEL and GPNMB (b), and ACTA2 (c) in Day 21 3D renal organoids derived from TSC2+/+, TSC2−/− and TSC2+/− hiPSCs. Bar graphs in (a) and (c) represent mean ± SD, n = 4 experiments. P values for individual comparisons done using Tukey test in one-way ANOVA analysis are indicated. d Representative confocal immunofluorescence sections showing expression of GPNMB and ACTA2 in Day-21 TSC2−/− renal organoids, kidney AML tumor and fibrotic Day-28 TSC+/+ renal organoids injured by incubation with interleukin 1β for 96 h. e Representative FACs plots and quantification showing the percentage of ACTA2+ cells and PMEL+ cells in Day-21 TSC2+/+, TSC2−/− and TSC2+/− renal organoids. Bar graphs represent mean ± SD, n = 4 experiments. P values for individual comparisons done using Tukey test in one-way ANOVA analysis are indicated. f Representative cell sorting plot showing the GPNMB+ (red square) and GPNMB- (black square) cell fractions in TSC2−/− renal organoids and gene expression levels for PMEL, MLANA, GPNMB, CTSK, and ACTA2, determined by Quantitative RT-PCR analysis. Floating bars graph represent mean ± SD, n = 3 independent experiments, containing three organoids each. P values for individual comparisons done using two-tailed Student’s t test are indicated. g Representative immunoblot showing expression of GPNMB and ACTA2 in renal organoids from the three genotypes. Two independent experiments were performed with similar results. Scale bars, 50 μm.
Fig. 3
Fig. 3. Gene expression analysis of TSC2-/-, TSC2+/−, and TSC2+/+ renal organoids.
a Volcano plots showing the distribution of all differentially expressed genes (DEGs) in TSC2−/− renal organoids compared to TSC2+/+ (left) and TSC2+/− (right) renal organoids (FDR < 0.05). Each dot represents a unique gene; red denotes log2 (fold change) >2, upregulated genes in TSC2−/−; blue denotes log2 (fold change) <-2, downregulated in TSC2−/−. Selected statistically significant upregulated and downregulated genes (NCBI/Entrez names) are indicated, as determined by a two-sided Chi-Square test. b Principal Component Analysis (PCA) of RNA-Seq data from renal organoids of the three genotypes, n = 3 samples for each genotype, five organoids per sample. c Heatmap showing hierarchical clustering of three different genotypes of kidney organoids using the top 3000 most variable genes. Color scale representative of gene expression level: red denotes log2 ≤ 3, blue denotes log2 ≥ -3. d Representative enrichment plots corresponding to gene set enrichment analysis (GSEA) for pairwise comparison of TSC2 −/− vs. TSC2+/−. e Venn diagrams indicating 187 common differentially expressed genes, including signature AML markers, in TSC2−/− vs. TSC2+/+ renal organoids and kidney AML vs. normal kidney. f Comparative mRNA expression levels for AML hallmark genes in TSC2−/−, TSC2+/+, and TSC2+/− renal organoids (n = 3 each) compared to human kidney AML (n = 28) and human kidney (n = 8). P values for individual comparisons done using a two-sided Mann–Whitney U test are indicated. Gene expression is shown in FPKM values. g Comparative ENO2 mRNA expression levels in TSC2+/+ and TSC2+/−, TSC2−/− renal organoids (n = 3 each). P values for the indicated individual comparisons done using two-tailed Student’s t test are shown. Gene expression is shown in FPKM values. h, i Box-and-whisker plot showing minimum value, first quartile, median, third quartile and maximum value for ENO2 content (g) and for enolase activity (h) in whole extracts of TSC2+/+ and TSC2−/− renal organoids. P value for the 2-tailed Student’s t test comparing TSC2−/− versus TSC2+/+ is shown. n = 4 independent experiments, containing three organoids each.
Fig. 4
Fig. 4. TSC2 inactivation drives cystogenesis during nephric differentiation.
a Representative brightfield images of 2D TSC2−/− hiPSC-derived renal tissues on Day 21 of differentiation. The arrowhead indicates a visible cyst. Twenty independent experiments were performed with similar results. b Immunofluorescence image showing 2D nephrons derived from the three hiPSC genotypes, labeled with PODXL1 (glomerulus), LTL (proximal tubule), and CDH1 (distal tubule). Number of cysts per well was quantified. Bar graphs represent mean ± SD, n = 8 wells from 2 independent experiments. c The cyst framed in the TSC2−/− nephron micrograph in (a) is stained for nephron markers by immunofluorescence with inset showing the distal tubule epithelium. Ten independent experiments were performed with similar results. d Brightfield image of 3D organoids of the three genotypes showing cystic TSC2−/− organoids, with quantification of cyst formation. Bar graphs represent mean ± SD, n = 4 experiments. e Representative confocal sections showing organoid glomeruli, proximal and distal tubule regions as indicated by PODXL1, LTL, and CDH1 staining. A cyst associated with a proximal tubule is shown in the TSC2−/− organoid section. Twelve independent experiments were performed with similar results. f Anatomical organization of TSC2−/− organoid cyst lining visualized using confocal imaging, both proximal tubule epithelial cell (PTEC) and distal tubule epithelial cell (DTEC) single-cell layers and DTEC multicellular regions are shown with LTL and CDH1 immunofluorescence. Eight independent experiments were performed with similar results. g Representative confocal imaging showing the alterations in polarity observed in PTECs lining TSC2−/− organoid cysts, compared to TSC2+/− organoid proximal tubule, using LTL staining. A representative quantification of LTL signal distribution in the periphery of individual cells is shown. Five independent experiments were performed with similar results. h Expression levels for PKD1 in TSC2−/−, TSC2+/+, and TSC2+/− renal organoids. Bar graphs represent mean ± SD, n = 3 samples for each genotype, five organoids per sample. Gene expression is shown in FPKM values. P values for individual comparisons done using Tukey test in one-way ANOVA analysis are indicated. Scale bars, 50 μm (a, b, c, e), 25 μm (f, g), and 1 mm (d).
Fig. 5
Fig. 5. Orthotopic TSC2−/− renal organoid xenografts model TSC-associated AML and TSC cystic disease in vivo.
a Schematic depicting the strategy used for the transplantation of Day 18 pre-organoid spheroids in the subcapsular region of RNU rat kidneys. b Representative image showing two spheroids implanted on Day 0, each indicated by an arrowhead. c Quantification of graft size over the period of two weeks. Scatter dot plot shows mean ± SD, n = 8 grafts, 4 rat kidneys. P values determined by two-way ANOVA analysis using Tukey test for multiple comparisons are indicated. d Representative image of RNU rat kidneys with engrafted TSC2+/+, TSC2−/−, and TSC2+/− organoids on Day 14 post-transplantation. e Representative confocal sections of TSC2−/− AML grafts showing wide distribution of human PMEL+ cells and LTL+ PTECs forming the cyst lining, the latter indicated by a white arrow. LTL- stained rat proximal tubules are indicated by a white star. Eight independent experiments were performed with similar results. f Representative confocal image of a glomerulus containing labeled with PODXL1+ cells in a TSC2−/− AML graft. Eight independent experiments were performed with similar results. g Representative immunostaining and confocal images showing the thorough vascularization indicated by PLVAP+ vessels, observed in close apposition to PMEL+ cells. Quantification of vessel density shown in the floating bar graph for grafts harvested on Day 0, Day 3 and Day 7 post-transplantation. Values represent mean ± SD, n = 4 grafts. P values for individual comparisons done using Tukey test in one-way ANOVA analysis are indicated. h, i Representative confocal immunofluorescence images for phospho-S6 in PMEL+ cells (h) and cystlining PTECs (i) in TSC2−/− AML xenografts. In (h) the white arrow indicates the luminal compartment, while the white star indicates the rat kidney. Five independent experiments were performed with similar results. j, k Detection of Ki67 in PMEL+ cells (j) and PTECs (k) in TSC2−/− AML grafts on Day 7 post-transplantation. The white arrows indicate Ki67-expressing human PMEL+ cells. Five independent experiments were performed with similar results. l Quantification of PMEL+ Ki67+ and LTL+ Ki67+ cells. Values in the bar graph represents mean ± SD, n = 4 grafts. Scale bars, 1 cm (b), 2 cm (d), 50 μm (e, f, g, h, i), 25 μm (e, g high magnification panels), 25 μm (i, j, k).
Fig. 6
Fig. 6. Ablation of TSC2−/− AML organoid xenografts treated with Rapamycin-loaded nanoparticles.
a Schematic showing the strategy for the delivery of Rapa-nanoparticles locally, near the TSC2−/− AML organoid xenografts. b Representative photographs showing the size of TSC2−/− xenografts on Day 3 and Day 7 post Rapa-Np delivery. Quantified diameter values on the floating bar graph represent mean ± SD, n = 8 grafts. P values for individual comparisons done using Tukey test in one-way ANOVA analysis are indicated. c Representative immunofluorescence images for the detection of activated Casp3 in TSC2−/− AML organoid xenograft PMEL+ myoid cells on Day 3 and Day 7 postdrug delivery. Five independent experiments were performed with similar results. d Floating bar graph with quantification of PMEL+ Casp3+ cells on Days 3 and 7 postdrug delivery. Mean ± SD are reported, n = 4 grafts. P values determined by two-way ANOVA analysis using Tukey test for multiple comparisons are indicated. e Detection of cleaved Casp3 on Day 0 (free organoid), 3 and 7 in protein extracts from TSC2−/− AML xenografts (Day 3 and 7). f Quantification of human Cytochrome C in the serum of RNU carrying rats TSC2−/− AML organoid xenografts, treated with Rapa-Np and controls that did not receive the treatment. Floating bar graph shows mean ± SD, n = 4 rats per group. P values determined by two-way ANOVA analysis using Tukey test for multiple comparisons are indicated. g Representative confocal imaging depicting detection of DNA fragmentation by TUNEL on sections of TSC2−/− AML xenografts, three and seven days post Rapa-Np delivery. Five independent experiments were performed with similar results. h Floating bar graph for the quantification of PMEL+ TUNEL+ cells shows mean ± SD are reported, n = 4 grafts per group. P values determined by two-way ANOVA analysis using Tukey test for multiple comparisons are indicated. Scale bars, 1 cm (b), 25 mm (c, g).
Fig. 7
Fig. 7. Rapamycin-Nps disrupt the interaction between p21CIP1 and pro-CASP3 in TSC2−/− organoid AML cells in vivo.
a RNAseq data box plots showing expression levels of CDKN1A in TSC2−/−, TSC2+/− and TSC2+/+ renal organoids (n = 3 each, five organoids per ample), compared to human kidney AML (n = 28) and human kidney (n = 8) samples. P values for individual comparisons done using a two-sided Mann–Whitney U test are indicated. Gene expression is shown in FPKM values. b Box-and-whisker plot showing minimum value, first quartile, median, third quartile and maximum value for expression of CDKN1A in various tumors using The Cancer Genome Atlas data. Kidney AML is highlighted in red. Sample size for each type of tumor: HNSC n = 100, CESC n = 100, KIRP n = 100, kidney AML n = 28, ACC n = 79, THCA n = 100, SARC n = 100, KIRC n = 100, MESO n = 36, BLCA n = 100, PCPG n = 98, LIHC n = 100, PAAD n = 96, PEComa (19), COAD n = 100, LUSC n = 100, GBM n = 100, UCEC n = 100, READ n = 72, KICH n = 66, SKCM n = 100, LUAD n = 100, BRCA n = 100, UCS n = 57, DLBC n = 28, PRAD n = 100, LGG n = 100, OV n = 100, LAML n = 100. c Representative immunostaining and confocal images showing PMEL and p21CIP1 in TSC2−/− AML organoids and in kidney AML tumor samples. High magnifications show cytoplasmic p21CIP1 signal. Three independent experiments were performed with similar results. Scale bars, 25 μm, and 12.5 μm for high magnification panels. d Representative Western Blots showing levels of p21CIP1, pro-CASP3 and CASP3 in transplanted TSC2+/+ and TSC2−/− organoids. Three independent experiments were performed with similar results. e Representative immunoblots showing co-immunoprecipitated p21CIP1 and pro-CASP3 in transplanted TSC2+/+ and in TSC2−/− renal organoids untreated or treated with Rapa-Nps. Three independent experiments were performed with similar results.

References

    1. Bernstein J, Robbins TO. Renal involvement in tuberous sclerosis. Ann. N. Y Acad. Sci. 1991;615:36–49. - PubMed
    1. Bissler JJ, Christopher Kingswood J. Renal manifestation of tuberous sclerosis complex. Am. J. Med. Genet. Part C., Semin. Med. Genet. 2018;178:338–347. - PubMed
    1. Thway K, Fisher C. PEComa: morphology and genetics of a complex tumor family. Ann. diagnostic Pathol. 2015;19:359–368. - PubMed
    1. Folpe AL, Kwiatkowski DJ. Perivascular epithelioid cell neoplasms: pathology and pathogenesis. Hum. Pathol. 2010;41:1–15. - PubMed
    1. Kaiserling E, Kröber S, Xiao JC, Schaumburg-Lever G. Angiomyolipoma of the kidney. Immunoreactivity with HMB-45 Light- and electron-microscopic findings. Histopathol. 1994;25:41–48. - PubMed

Publication types

MeSH terms