. 2021 Nov 11;12(1):6504.
doi: 10.1038/s41467-021-26764-0.

Generation of functional ciliated cholangiocytes from human pluripotent stem cells

Affiliations

Generation of functional ciliated cholangiocytes from human pluripotent stem cells

Mina Ogawa et al. Nat Commun. .

Abstract

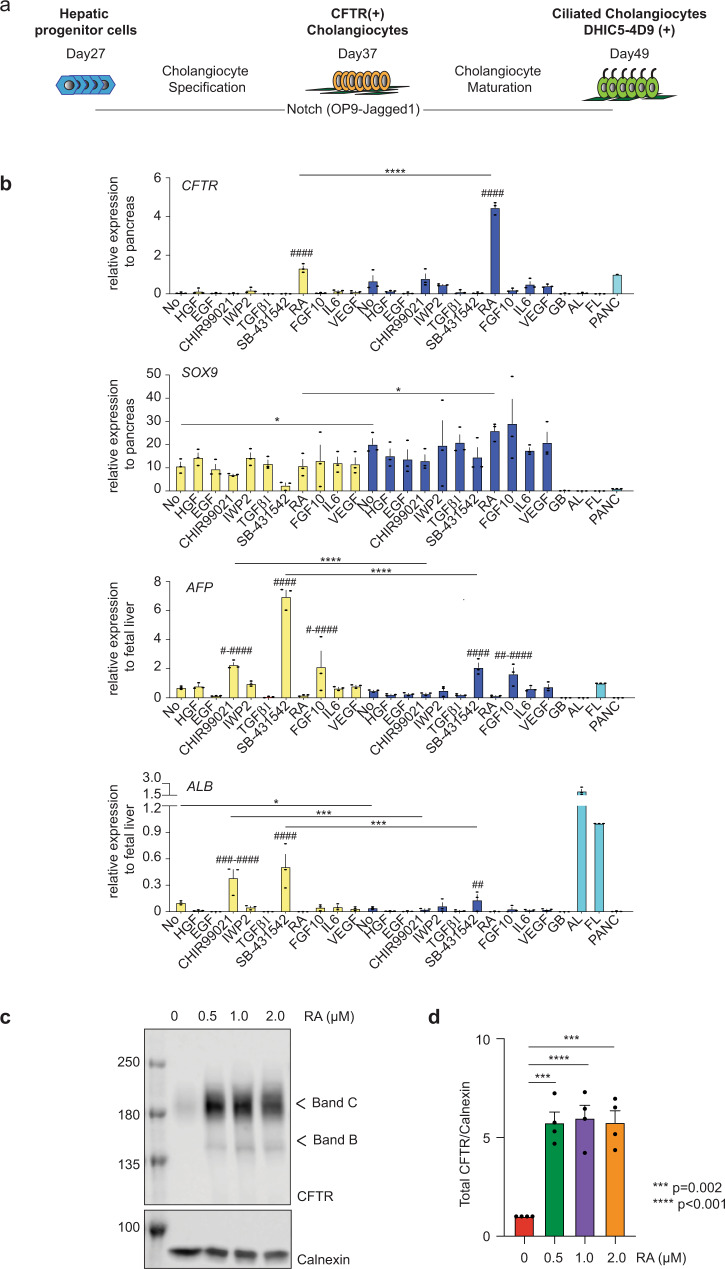
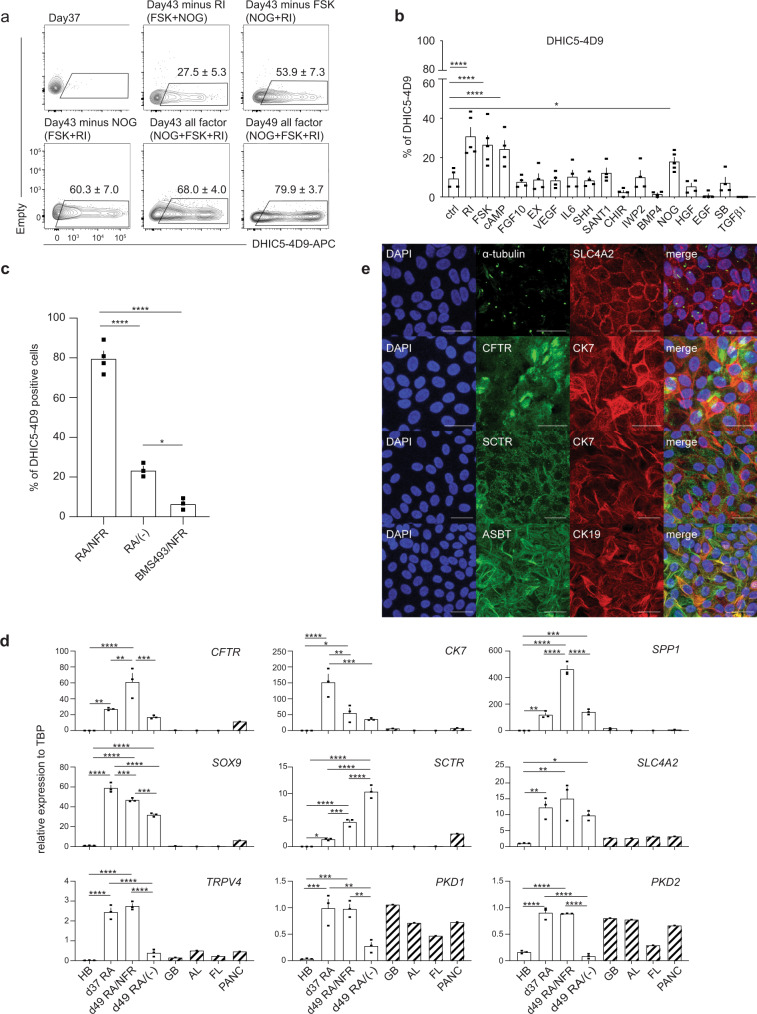
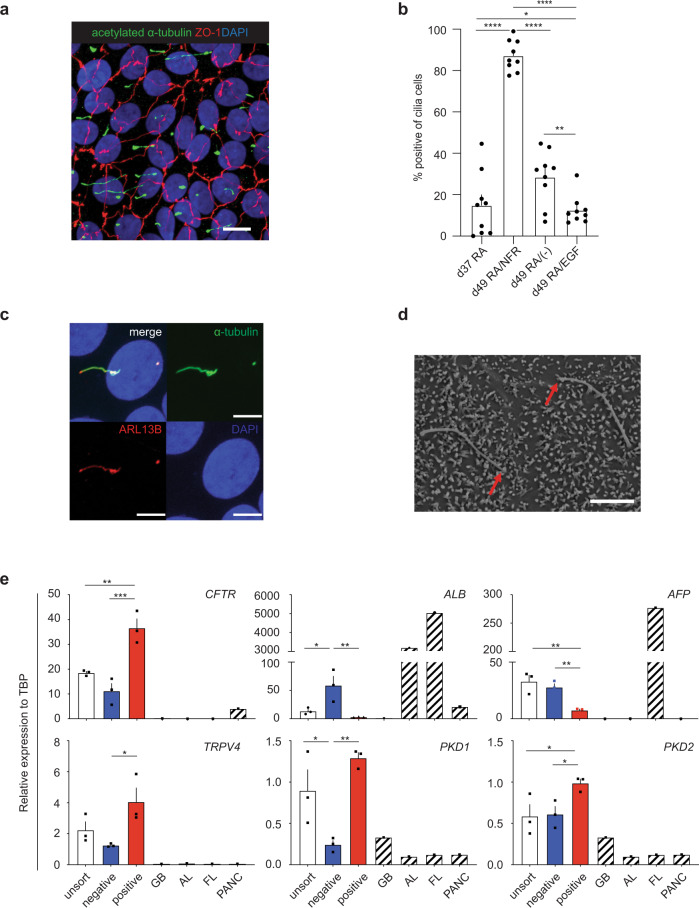
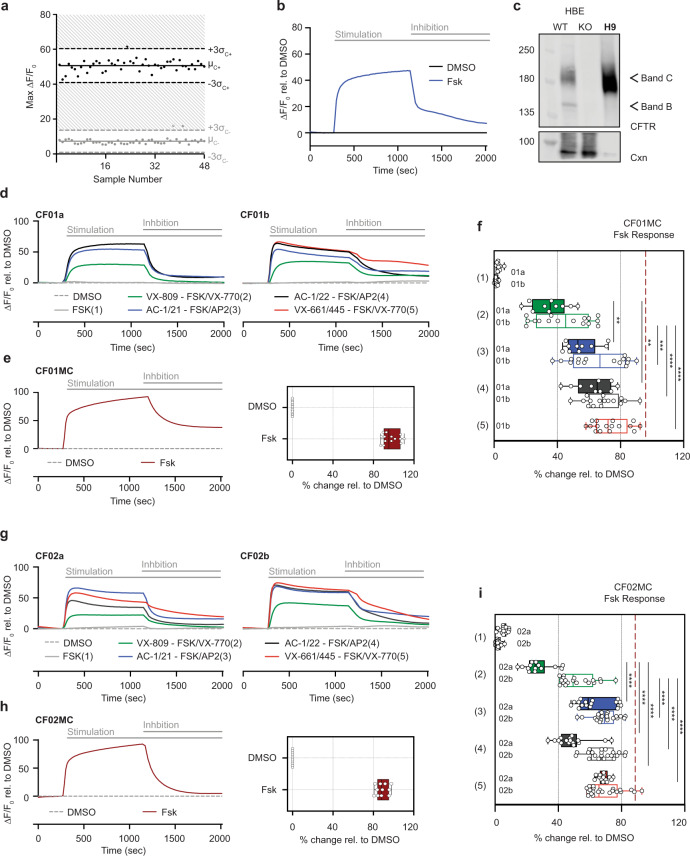
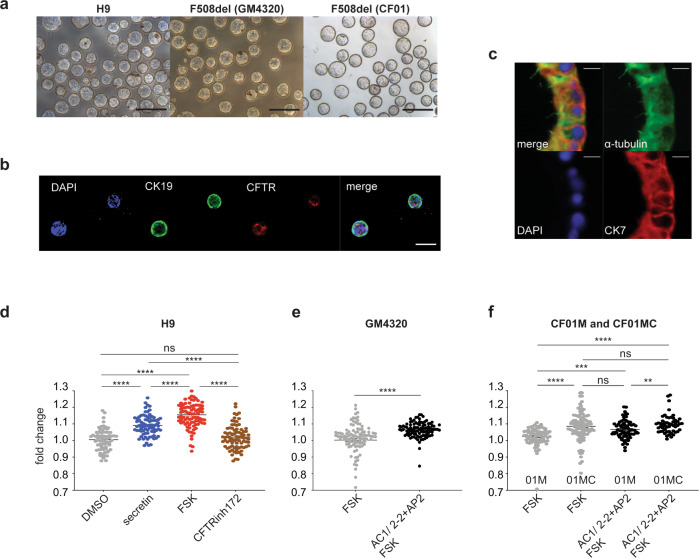
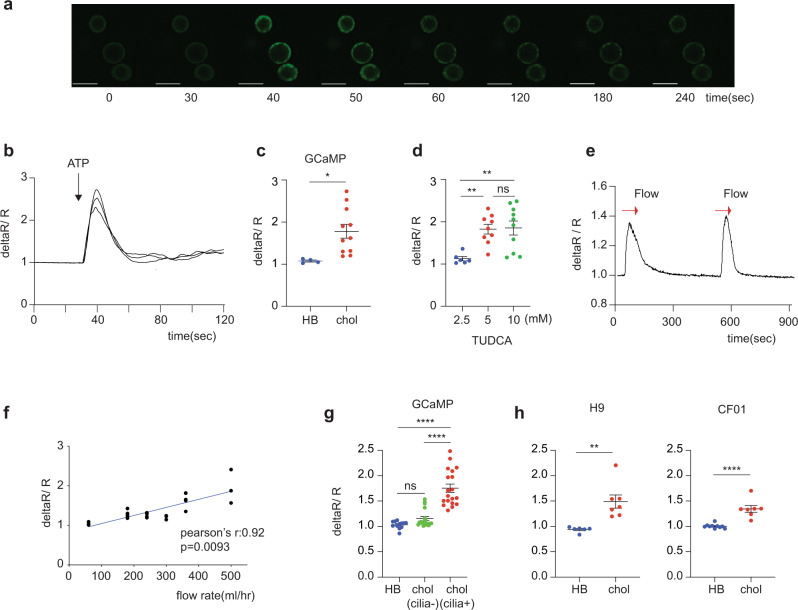
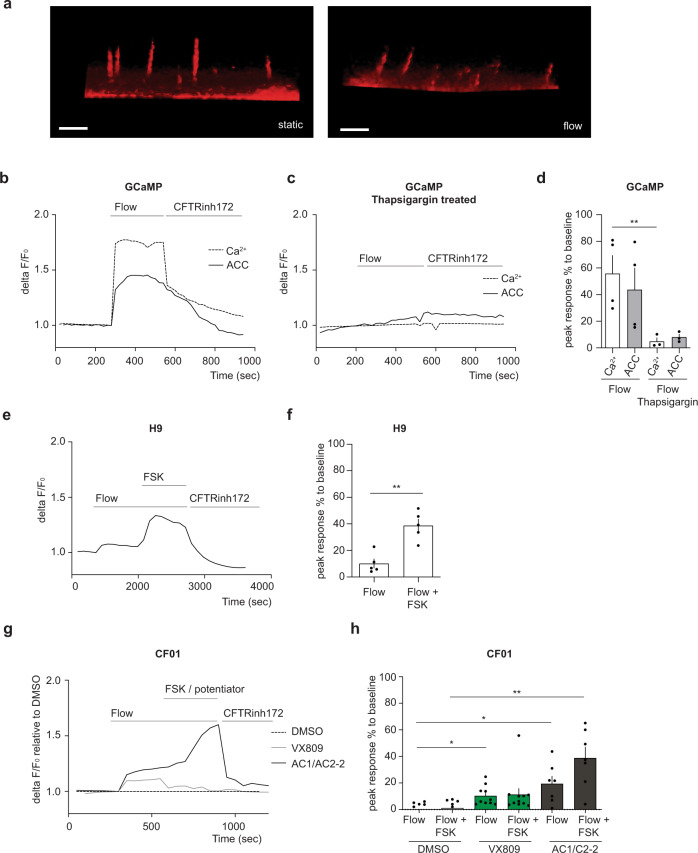
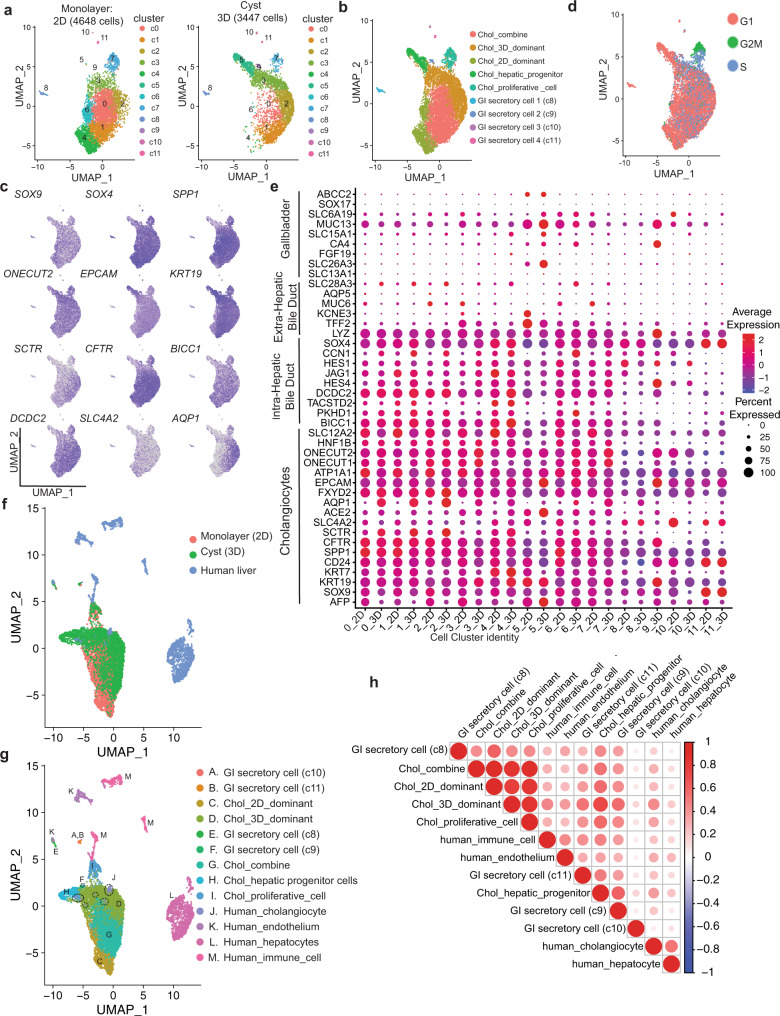
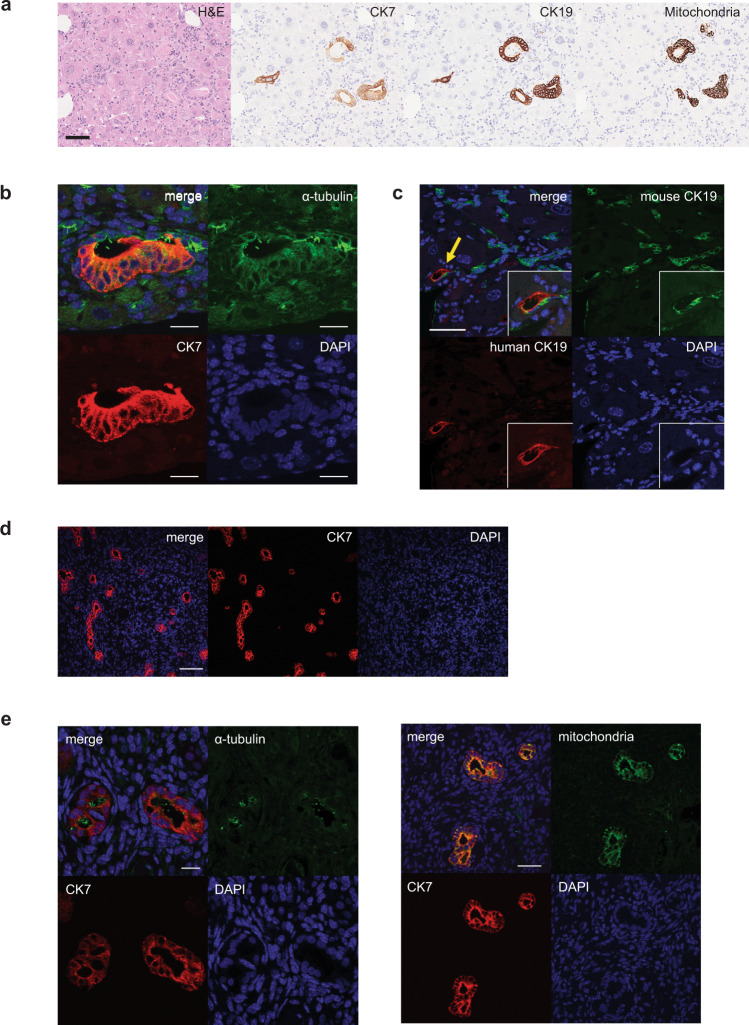
The derivation of mature functional cholangiocytes from human pluripotent stem cells (hPSCs) provides a model for studying the pathogenesis of cholangiopathies and for developing therapies to treat them. Current differentiation protocols are not efficient and give rise to cholangiocytes that are not fully mature, limiting their therapeutic applications. Here, we generate functional hPSC-derived cholangiocytes that display many characteristics of mature bile duct cells including high levels of cystic fibrosis transmembrane conductance regulator (CFTR) and the presence of primary cilia capable of sensing flow. With this level of maturation, these cholangiocytes are amenable for testing the efficacy of cystic fibrosis drugs and for studying the role of cilia in cholangiocyte development and function. Transplantation studies show that the mature cholangiocytes generate ductal structures in the liver of immunocompromised mice indicating that it may be possible to develop cell-based therapies to restore bile duct function in patients with biliary disease.


Conflict of interest statement

OHSU has commercially licensed HPd3/DHIC5-4D9; authors C.D. and M.G. are inventors of this antibody. The remaining authors declare no competing interests.

Figures

Fig. 1
Fig. 1. Establishment of differentiation protocol of hPSC-derived functional cholangiocytes in monolayer culture.
a Schematic of differentiation protocol. b RTqPCR analysis of CFTR, SOX9, AFP, and ALB expression in the presence of factors for 6 days following HGF and EGF treatment for 4 days after the passage on either Matrigel (yellow) or OP9-Jagged1 (blue) from the day 27 hepatoblast. GB gall bladder, AL adult liver, FL fetal liver, PANC pancreas. #Represents statistical significance among factors in Matrigel or in OP9-Jagged1. #p ≤ 0.05, ##p ≤ 0.01, ###p ≤ 0.001, ####p ≤ 0.0001 one-way ANOVA. * Represents statistical significance between factors in Matrigel and in OP9-Jagged1 *p ≤ 0.05, ***p ≤ 0.001, ****p ≤ 0.0001 two-tailed Student’s t test. Data are represented as mean ± SEM. (n = 3). c Western blot analysis showing mature and immature glycosylated CFTR bands C and B in hESC-derived cholangiocytes at day 37 after treated with different concentrations of RA. Numbers on the left side represent the molecular weight. Uncropped blots in Source Data. d Quantification of CFTR proteins in hPSC-derived cholangiocytes at day 37 after treated with different concentrations of RA. two-tailed Student’s t test compared to RA 0μM. Data are represented as mean ± SEM. (n = 4).
Fig. 2
Fig. 2. FSK, NOG, and RI promote the generation of DHIC5-4D9 positive cells.
a Flow cytometry analysis showing the proportion of DHIC5-4D9+ cells at day 37, day 43, and day 49. All factor represents addition of Noggin, Forskolin and Rho-Kinase inhibitor (NFR) following RA treatment. Minus represents withdrawal of each representative factor from NFR for 6 days. Data are represented as mean ± SEM (n = 3–5). b % Positivity of DHIC5-4D9+ cells after 6 days in the presence of factors. *p ≤ 0.05, ****p ≤ 0.0001 two-tailed Student’s t test compared to control. Data are represented as mean ± SEM (n = 5 biologically independent samples from RI, FSK, NOG, n = 4 biologically independent samples per group from the rest). c Quantification of DHIC5-4D9 positive cells in day 49 hPSC-derived cholangiocytes after treatment with different indicated cytokine/small molecule combinations. *p ≤ 0.05, ****p ≤ 0.0001 one-way ANOVA. Data are represented as mean ± SEM (n = 4 biologically independent samples from RA/NFR, n = 3 biologically independent samples per group from the rest). d RT-qPCR analysis of the expression of the indicated gene in each population at different stages of H9-derived cholangiocytes. HB hepatoblast, GB gall bladder, AL adult liver, FL fetal liver, PANC pancreas. *p ≤ 0.05, **p ≤ 0.01, ***p ≤ 0.001, ****p ≤ 0.0001 one-way ANOVA. Data are represented as mean ± SEM (n = 3). e Immunostaining analysis showing the proportion of acetylated α-tubulin and SLC4A2 (top), CFTR and CK7 (second row from the top), SCTR and CK7 (third from the top), ASBT and CK19 (bottom) cells in day 49 cholangiocyte. Scale bar represents 25 μm.
Fig. 3
Fig. 3. DHIC5-4D9 positive cells show primary cilia, a characteristic feature of cholangiocyte.
a Confocal microscopy analysis showing co-expression of acetylated α-tubulin and ZO1 in day 49 cholangiocyte. Scale bar represents 10 μm. b Quantification of cilia positive cells in day 37 (after RA) and day 49 hPSC-derived cholangiocytes after treatment with different indicated cytokine molecule combinations. *p ≤ 0.05, **p ≤ 0.01, ****p ≤ 0.0001 one-way ANOVA. Data are represented as mean ± SEM (n = 3). c High magnification image with confocal microscopy demonstrating co-localization of ARL13B with acetylated-α-tubulin (+) primary cilia. Scale bar represents 5 μm. d Scanning electron microscope image of primary cilia and microvilli in 2 cholangiocytes. Red arrows indicate the tips of cilia. Scale bar represents 5 μm. e qPCR analysis for indicated genes in flow-based sorting fractions of DHIC5-4D9+ cells in day 49 cholangiocyte. GB gall bladder, AL adult liver, FL fetal liver, PANC pancreas. *p ≤ 0.05, **p ≤ 0.01, ***p ≤ 0.001 one-way ANOVA. Data are represented as mean ± SEM (n = 3).
Fig. 4
Fig. 4. CFTR Modulator profiling of CF patient-derived cholangiocytes in 96-well monolayer culture.
a The Z factors show the quality of the FLIPR assay measuring Apical Chloride Conductance (ACC) in 96-well plate with hPSC-derived cholangiocytes at day 49. b The kinetics of ACC by FLIPR assay in H9-derived cholangiocytes at day 49. c Western blotting shows the mature glycosylated CFTR band in day 49 H9 cholangiocyte along with the controls from CFTR expressing human bronchial epithelial HBE cell line (WT wild type, KO CFTR knock out). CNX calnexin control. Uncropped blots in Source Data. d The kinetics of ACC by FLIPR assay among different drug treatment in CF01a (left) and CF01b (right) iPSC-derived cholangiocytes. e The kinetics of ACC by FLIPR assay in CF01MC iPSC-derived cholangiocytes (left). Representative % value of CFTR channel activity with an exposure of DMSO and FSK in CF01MC iPSC-derived cholangiocytes normalized to DMSO (n = 4, right). f Representative % value of CFTR channel activity with an exposure of DMSO and CFTR modulators in CF01 iPSC-derived cholangiocytes normalized to DMSO. Dashed line indicates FSK response in CF01MC-derived cholangiocytes. Solid and open boxes represent clone a and b respectively. Stars show statistical significance to VX809/VX770, one-way ANOVA (CF01a n = 3, CF01b n = 4). g The kinetics of ACC by FLIPR assay among different drug treatment in CF02a (left) and CF02b (right) iPSC-derived cholangiocytes. h The kinetics of ACC by FLIPR assay in CF02MC iPSC-derived cholangiocytes (left). Representative % value of CFTR channel activity with an exposure of DMSO and FSK in CF02MC iPSC-derived cholangiocytes normalized to DMSO (n = 4, right). i Representative % value of CFTR channel activity with an exposure of DMSO and CFTR modulators in CF02 iPSC-derived cholangiocytes normalized to DMSO. Dashed line indicates FSK response in CF02MC-derived cholangiocytes. Solid and open boxes represent clone a and b respectively. Stars show statistical significance to VX809/VX770, one-way ANOVA (CF02a n = 4, CF02b n = 4). *p ≤ 0.05, **p ≤ 0.01,***p ≤ 0.001, ****p ≤ 0.0001, (Median ± SEM), Box plots include median line and IQR ranges at the box bounds with the whiskers defining the minima and maxima data points.
Fig. 5
Fig. 5. 3D cholangiocytes cyst/organoids show CFTR function and modeling of CFLD.
a Photomicrographs of cyst/organoid structures that develop in liquid culture condition from monolayer hPSC-derived cholangiocytes. Scale bar represents 500 μm. b Microscopic analysis showing the co-expression of CK19 (green) and CFTR (red) in H9-derived cholangiocyte cysts. Scale bar represents 100 μm. c Immunostaining analysis showing the co-expression of acetylated-α-tubulin (green) and CK7 (red) in H9-derived cholangiocyte cysts. Scale bar represents 10 μm. d Quantification of the degree of H9-derived 3D cholangiocyte cyst swelling 1 h after DMSO and secretin. FSK stimulation in the absence or presence of CFTR inhibitor CFTR Inh-172. ****p ≤ 0.0001 one-way ANOVA (n = 4 biologically independent experiments from DMSO and secretin, n = 3 biologically independent experiments from FSK and CFTRinh172). e Quantification of the degree of F508del (GM4320)-derived 3D cholangiocyte cyst swelling 1 h after FSK stimulation in the presence of DMSO or CFTR modulators. ****p ≤ 0.0001 two-tailed Student’s t test (n = 3). f Quantification of the degree of F508del (CF01) or corrected F508del (CF01MC)-derived 3D cholangiocyte cyst swelling 1 h after FSK stimulation in the presence of DMSO or CFTR modulators. **p ≤ 0.01, ***p ≤ 0.001, ****p ≤ 0.0001, one-way ANOVA (n = 3). Data are represented as mean ± SEM. Each dot represents cyst and n = 15–40 cysts were measured per microwell.
Fig. 6
Fig. 6. Intracellular Calcium release in ciliated hPSCs derived cholangiocyte.
a Representative time lapse image of calcium influx in GCaMP hES derived cholangiocyte cyst (3D) in response to ATP. Scale bar represents 200 μm. b Representative traces from Fig. 6a showing the intra cellular calcium release in GCaMP hESC-derived cholangiocytes in the response to ATP. c Quantification of maximum fluorescent intensity representing intra cellular Ca2+ release in GCaMP hESC-derived hepatoblasts (HB) and cholangiocytes (chol) in the response to ATP, *p ≤ 0.05 two-tailed Student’s t test (n = 4 biologically independent samples from HB, n = 3 biologically independent samples from chol). d Quantification of maximum fluorescent intensity representing intra cellular Ca2+ release in GCaMP hESC-derived cholangiocytes in the response to different concentrations of TUDCA, **p ≤ 0.01, one-way ANOVA (n = 3 biologically independent experiments per each concentration). Data are represented as mean ± SEM. e Representative trace of the intra cellular calcium release in GCaMP hESC-derived cholangiocytes induced by flow in the absence of ATP. f Quantification of maximum fluorescent intensity in GCaMP hESC-CF01derived cholangiocytes with increased flow rate (n = 3). Two-tailed pearson correlation coefficient was calculated by Prism8. g Quantification of maximum fluorescent intensity representing intra cellular Ca2+ release in indicated GCaMP derived hepatoblasts (HB), non-ciliated cholangiocyte (cilia-), and ciliated cholangiocytes (cilia + ) in the response to flow, ****p ≤ 0.0001 one-way ANOVA (n = 3 biologically independent experiments per each group). h Quantification of maximum fluorescent intensity representing intra cellular Ca2+ release in indicated hPSC-derived hepatoblasts (HB) and cholangiocytes (chol) in the response to flow, **p ≤ 0.01, ****p ≤ 0.0001 two-tailed Student’s t test (n = 3 biologically independent experiments per each group). Each circle represents the structure measured for intracellular calcium release.
Fig. 7
Fig. 7. CFTR function in ciliated hPSC-derived cholangiocyte in response to flow.
a Microscopic images show that cilium extend straight from the cell surface in the static condition (left). Flow (102 μl/s) bent cilium (right). Scale bars represent 5 μm. b Correlation between calcium influx and CFTR function. Continuous flow induced calcium influx and Apical Chloride Conductance (ACC) in GCaMP derived cholangiocyte. c Representative trace of the Apical Chloride Conductance (ACC) and calcium influx in GCaMP derived cholangiocyte with the presence of thapsigargin in response to flow. d Quantitative analysis showing the peak response of calcium and ACC, **p ≤ 0.01 one-way ANOVA. Data are represented as mean ± SEM (n = 3–4). e Representative trace of the Apical Chloride Conductance (ACC) in H9-derived cholangiocyte cysts in response to flow followed by flow in the presence of FSK. Response was blocked by CFTR inhibitor172. f Quantitative analysis showing the peak response of ACC in H9-derived cholangiocyte cysts in response to flow, **p ≤ 0.01 two-tailed Student’s t test (n = 5). g Representative trace of the apical chloride conductance (ACC) in CF01 derived cholangiocyte after treated with CF modulators in response to flow. h Quantitative analysis showing the peak response of ACC in CF01 derived cholangiocyte in response to flow in the presence of CFTR modulators, *p ≤ 0.05, **p ≤ 0.01 one-way ANOVA. Data are represented as mean ± SEM (n = 5–11).
Fig. 8
Fig. 8. Global gene analysis of 2D and 3D cyst/organoids hPSC-derived cholangiocytes.
a UMAP projection of 2D (left) and 3D (right) hPSC-derived cholangiocytes labeled by cell cluster. b UMAP projection of 2D dominant, 3D dominant, and 2D/3D combine populations of hPSC-derived cholangiocytes. c UMAP plots displaying the expressions of selected cholangiocyte markers. d UMAP plots showing cells in various cell cycles. e Dot plots displaying expression of genes indicative of cholangiocytes and known markers for different regions of primary bile ducts. The plot is split by cluster ID (0–11) and data source (2D vs. 3D). Size of the dot represents proportion of the population that expresses each gene. Color indicates the means of average expression level. f UMAP projection of 2D and 3D hPSC-derived cholangiocytes and adult human liver cells labeled by data source. g UMAP projection of 2D and 3D hPSC-derived cholangiocytes and human adult liver cells labeled by pre-annotated cell type. Circles with dotted line represent human adult cholangiocyte (cluster J). h Correlation matrix summarizing Pearson correlation coefficient measuring the correlation between hPSC-derived cholangiocyte populations and human adult liver cells.
Fig. 9
Fig. 9. Engraftment of hPSC-derived cholangiocyte in mice liver.
a Photomicrographs of duct-like structures generated from hPSC-derived cholangiocytes in the liver of TK-NOG mouse after 6 weeks of transplantation. HE and DAB staining with human specific antibodies. Scale bar represents 50 μm. b Confocal image of a histological section in the liver of TK-NOG mouse after 6 weeks of transplantation showing duct structures with primary cilia (green) counterstained with CK7 (red) and DAPI (blue). Scale bar represents 20 μm. c Confocal image of a histological section in the liver of TK-NOG mouse after 6 weeks of transplantation co-expressing human CK19 (red) and mouse CK19 (green). Scale bar represents 50 μm. d Confocal image of histological section showing duct structures in the kidney of NSG mouse showing human CK7 (red). Scale bar represents 100 μm. e Left: high magnification image of confocal microscopy demonstrating that hPSC-derived cholangiocyte display co-localization of CK7 (red) with acetylated α-tubulin (green) in the mouse kidney subcapsular space. Scale bar represents 20 μm. Right: high magnification image of confocal microscopy demonstrating that hPSC-derived cholangiocytes display co-localization of CK7 (red) with human mitochondria (green) in the mouse kidney subcapsular space. Scale bar represents 50 μm.

References

    1. Banales JM, et al. Cholangiocyte pathobiology. Nat. Rev. Gastroenterol. Hepatol. 2019;16:269–281. - PMC - PubMed
    1. Jones H, Alpini G, Francis H. Bile acid signaling and biliary functions. Acta Pharm. Sin. B. 2015;5:123–128. - PMC - PubMed
    1. Larusso NF, Masyuk TV. The role of cilia in the regulation of bile flow. Dig. Dis. 2011;29:6–12. - PMC - PubMed
    1. Mansini AP, et al. The cholangiocyte primary cilium in health and disease. Biochim. Biophys. Acta Mol. Basis Dis. 2018;1864:1245–1253. - PMC - PubMed
    1. Masyuk AI, et al. Cholangiocyte primary cilia are chemosensory organelles that detect biliary nucleotides via P2Y12 purinergic receptors. Am. J. Physiol. Gastrointest. Liver Physiol. 2008;295:G725–G734. - PMC - PubMed

Publication types

MeSH terms

Substances