. 2021 Nov 11;11(1):22106.
doi: 10.1038/s41598-021-01512-y.

Blocked O-GlcNAc cycling alters mitochondrial morphology, function, and mass

Affiliations

Blocked O-GlcNAc cycling alters mitochondrial morphology, function, and mass

Elizabeth O Akinbiyi et al. Sci Rep. .

Abstract

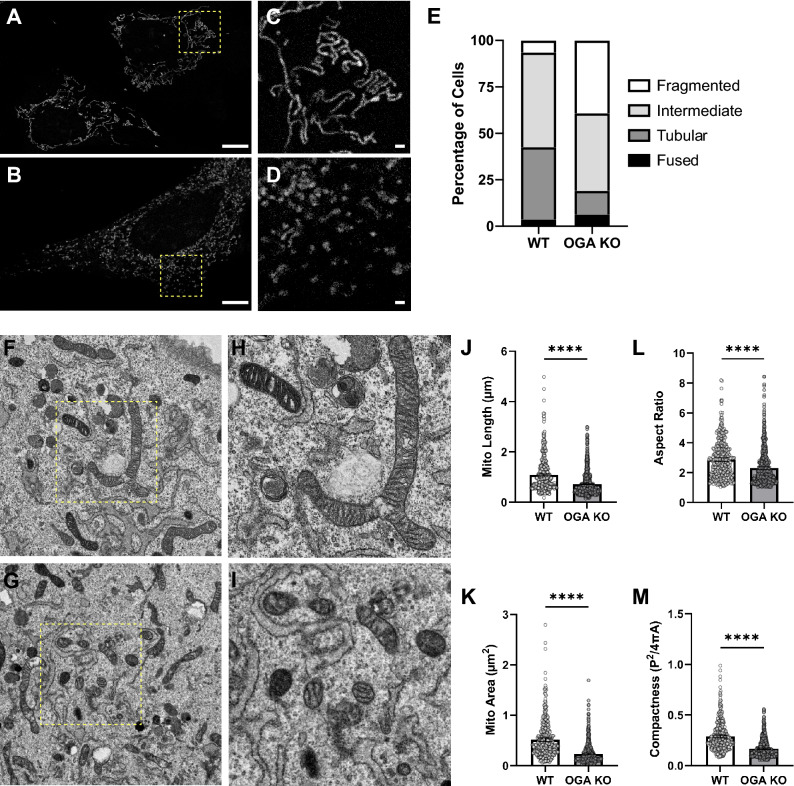
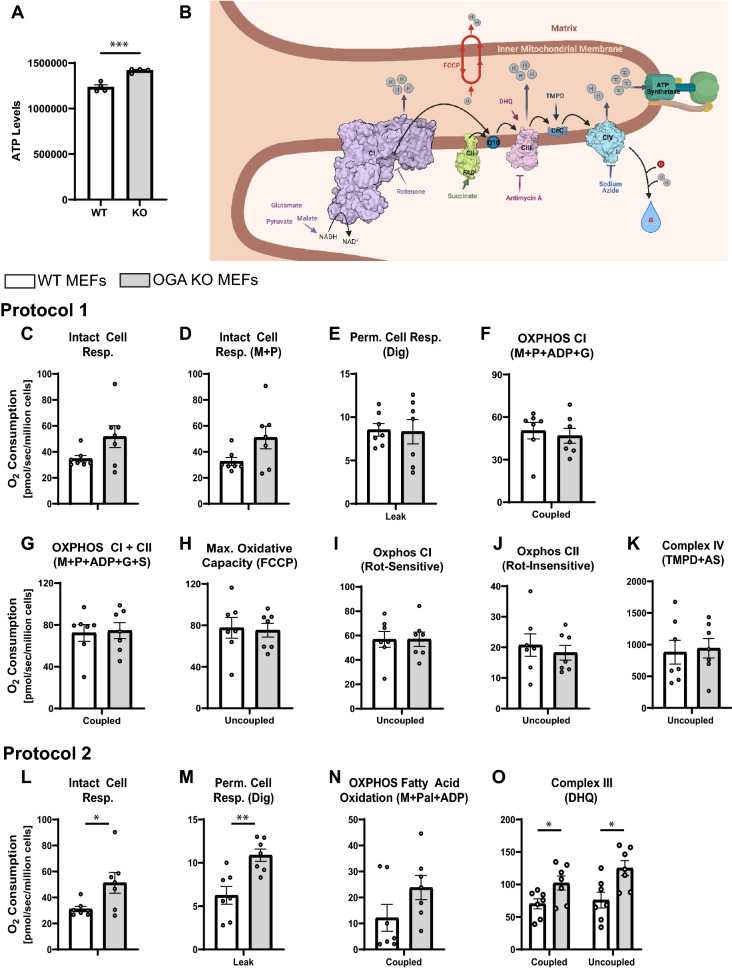
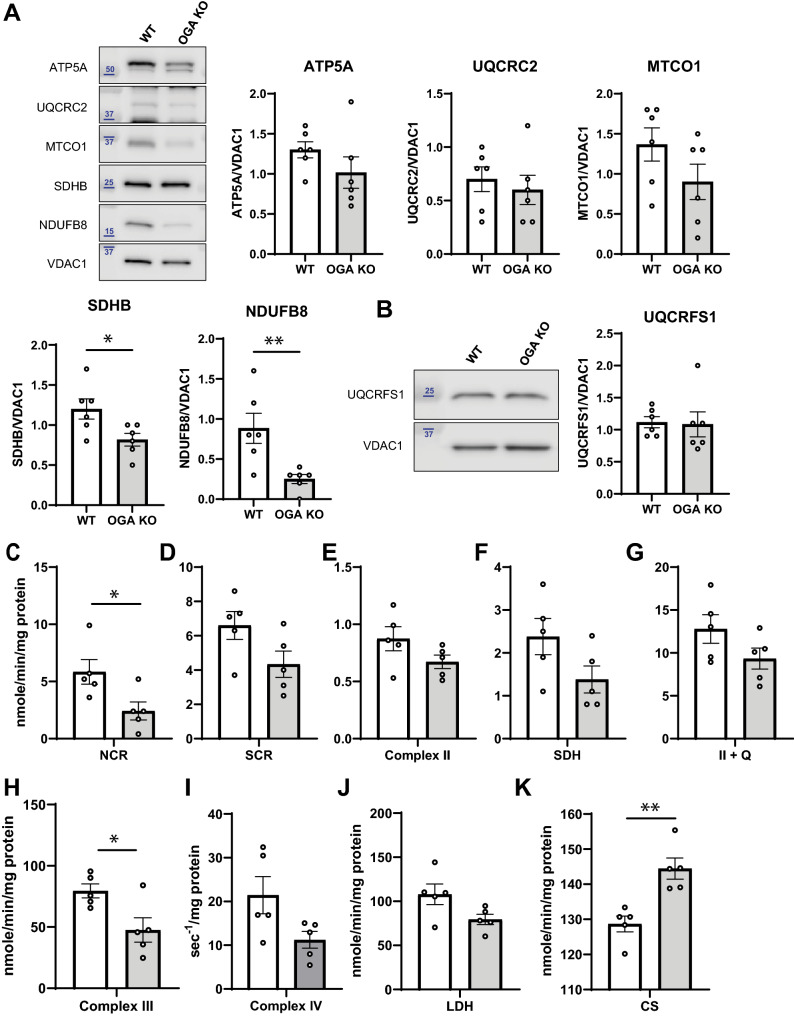
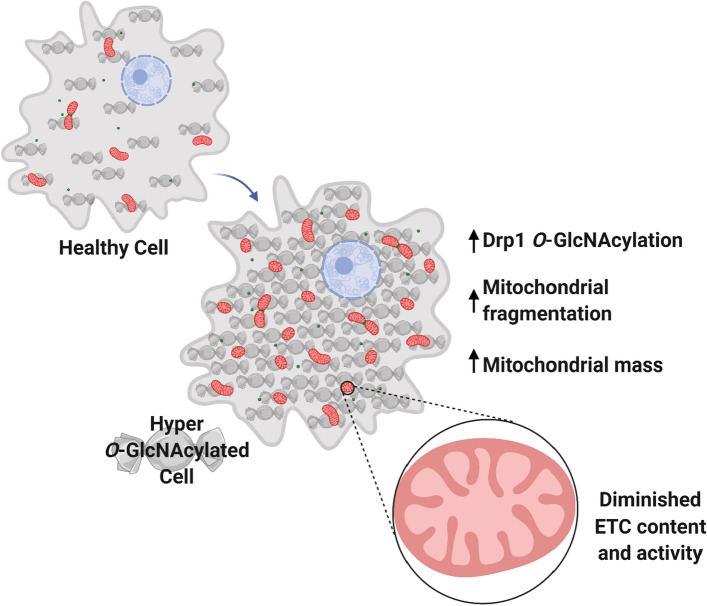
O-GlcNAcylation is a prevalent form of glycosylation that regulates proteins within the cytosol, nucleus, and mitochondria. The O-GlcNAc modification can affect protein cellular localization, function, and signaling interactions. The specific impact of O-GlcNAcylation on mitochondrial morphology and function has been elusive. In this manuscript, the role of O-GlcNAcylation on mitochondrial fission, oxidative phosphorylation (Oxphos), and the activity of electron transport chain (ETC) complexes were evaluated. In a cellular environment with hyper O-GlcNAcylation due to the deletion of O-GlcNAcase (OGA), mitochondria showed a dramatic reduction in size and a corresponding increase in number and total mitochondrial mass. Because of the increased mitochondrial content, OGA knockout cells exhibited comparable coupled mitochondrial Oxphos and ATP levels when compared to WT cells. However, we observed reduced protein levels for complex I and II when comparing normalized mitochondrial content and reduced linked activity for complexes I and III when examining individual ETC complex activities. In assessing mitochondrial fission, we observed increased amounts of O-GlcNAcylated dynamin-related protein 1 (Drp1) in cells genetically null for OGA and in glioblastoma cells. Individual regions of Drp1 were evaluated for O-GlcNAc modifications, and we found that this post-translational modification (PTM) was not limited to the previously characterized residues in the variable domain (VD). Additional modification sites are predicted in the GTPase domain, which may influence enzyme activity. Collectively, these results highlight the impact of O-GlcNAcylation on mitochondrial dynamics and ETC function and mimic the changes that may occur during glucose toxicity from hyperglycemia.


Conflict of interest statement

The authors declare no competing interests.

Figures

Figure 1
Figure 1
Mitochondrial Fission is Enhanced in OGA KO MEFs. (A–D) Confocal microscopy images with Mitotracker dye are presented for WT (A) and OGA KO (B) MEFs; Scale bars, 10 µm. Select areas (highlighted with a yellow dashed box) are enlarged for WT (C) and OGA KO (D) MEFs; Scale bars, 1 µm. (E) The quantified percentage of cells characterized by mitochondrial morphologies (fused, tubular, intermediate, or fragmented) in basal WT and OGA KO MEFs are shown (WT cells = 108 counted, OGA KO cells = 110 counted). (F–I) Representative transmission electron microscopy (TEM) images of fixed sections for WT (F) and OGA KO (G) MEFs are presented; Scale bar, 2 µm. Enlarged areas of WT (H) and OGA KO (I) MEFs highlight local mitochondrial morphologies. Quantification of mitochondrial length (J), area (K), aspect ratio (L), and compactness (M) are shown (An unpaired Student’s t test shows ****p < 0.0001; WT mitochondria = 391 counts, OGA KO mitochondria = 616 counts).
Figure 2
Figure 2
Comparison of Oxidative Phosphorylation in permeabilized WT and OGA KO cells. (A) Relative ATP levels were measured in WT and OGA KO MEFs. (B) A schematic representation of the individual ETC complexes is shown highlighting the substrates and inhibitors used in Protocols 1 and 2. (C–O) The measured oxygen consumption rates (pmol O2/sec/million cells) observed for WT (white bars) and OGA KO (grey bars) MEFs treated with the indicated substrates or inhibitor are presented. For Protocol 1 (CK), intact cellular respiration (ICR) rate (C), ICR with malate (M) and pyruvate (P) (D), Digitonin (Dig) Permeabilized Cell Respiration, coupled leak rate (E), Oxphos of CI (M + P + adenosine diphosphate [ADP] + G), coupled (F), Oxphos of CI + CII (M + P + ADP + G + S), coupledF (G), Maximal Oxphos Capacity (trifluoromethoxy carbonylcyanide phenylhydrazone [FCCP] added, panel (H), Oxphos of CI (Rot-sensitive), uncoupled (I) Oxphos of CII (Rot-insensitive), uncoupled (J), and Oxphos of CIV (TMPD + AS), uncoupled (K) were determined. For Protocol 2 (LO), ICR rate (L), Digitonin (Dig) Permeabilized Cell Respiration, coupled leak rate (M), Oxphos of fatty acid (M + palmitoylcarnitine [Pal] + ADP), coupled (N), Oxphos of CIII (duroquinol [DHQ]), coupled and uncoupled (O) were measured (An unpaired Student’s t test shows *p < 0.05; **p < 0.01). Representative traces for WT and OGA KO MEFs are presented in Supplementary Figure S1.
Figure 3
Figure 3
Decreased ETC complex protein content and activities in OGA KO MEFs. (A) ETC proteins content were detected by western blot and quantified relative to VDAC1; Complex I = NDUFB8 (NADH:Ubiquinone Oxidoreductase Subunit B8, Complex II = SDHB (Succinate Dehydrogenase Complex Iron Sulfur Subunit B), Complex III = UQCRC2 (Ubiquinol-cytochrome c reductase core protein 2), Complex IV = MTCO1 (Mitochondrially Encoded Cytochrome C Oxidase I), ATPase Synthase = ATP5A (ATP Synthase F1 Subunit Alpha). (B) The protein content of UQCRFS1 (Ubiquinol-Cytochrome C Reductase, Rieske Iron-Sulfur Polypeptide 1) was also assessed. Blue numbers indicate molecular weight markers. (CK) The individual complex rates (nmol/min/mg protein) were measured for CI + CIII (C) rotenone-sensitive NADH cytochrome c reductase, NCR), CII + CIII (D) antimycin-sensitive succinate cytochrome c reductase, SCR), the Thenoyltrifluoroacetone (TTFA)-sensitive complex II (E, Complex II), succinate dehydrogenase (F, SDH), complex II with exogenous coenzyme Q analogue added (G, CII + Q), decylubiquinol-cytochrome c oxidoreductase (H, Complex III), and lactate dehydrogenase (I, LDH). The first order rate constant (k-1/mg protein) for Complex IV was determined (J). The activity of citrate synthase (CS) was also measured (K). An unpaired Student’s t test shows *p < 0.05; **p < 0.01. Full-length Western Blots (uncropped) are provided in Supplementary Figure S2.
Figure 4
Figure 4
Drp1 O-GlcNAcylation is elevated in OGA KO MEFs, glioblastoma (GBM) cell lines, and sustained on overexpressed Drp1 mutants. (A) Western blot analysis of Drp1 within WGA precipitates from WT and OGA KO MEFs is shown and quantified. N = 6, Student’s t test, error bars represent SEM. (B) Western blot analysis of Drp1 from WGA precipitation of human astrocytes and glioblastoma cell lines (CNS1, Gli36, LN229, and U87) is presented with quantification. N = 4, Student’s t test, error bars represent SEM. Input is 10% protein concentration of precipitation. (C) Western blots of Myc-tagged Drp1 (WT, T548A, T549A, T548/9A, and ΔVD) constructs overexpressed and WGA precipitated from Drp1 CRISPR HCT 116 cells is shown and quantified. N = 4, Student’s t test, error bars represent SEM. Input is 10% protein concentration of precipitation. Full-length Western Blots (uncropped) are provided in Supplementary Figure S3.
Figure 5
Figure 5
In vitro validation and Prediction of Drp1 O-GlcNAcylation Sites. (A) In vitro O-GlcNAcylation of recombinant Drp1 and Drp1 GTPase-GED (GG, GTPase domain, green, & BSE, magenta purple) with recombinant OGT was observed. (B) GTPase activity rates were measured using a continuous GTPase assay with full-length Drp1 that had been incubated with OGT with or without UDP-GlcNAc. (C) Drp1 protein domain schematic and a 3D homology model highlights predicted O-GlcNAc modifications (blue cubes denote solvent accessible predicted residues and yellow spheres denote solvent inaccessible predicted residues). The complete list of predicted sites is available in Supplementary Table 1.
Figure 6
Figure 6
Model of the Effect of Hyper-O-GlcNAcylation on Mitochondrial Structure and Function. Elevated O-GlcNAcylation (represented by candies) within the cellular environment leads to mitochondrial fragmentation (executed by Drp1, green dots) and diminished ETC content and activity. A compensatory increase in mitochondrial mass compensates for these local defects, leading to relatively normal respiratory capacity when compared to a healthy cell with proper O-GlcNAc cycling. Model created with BioRender.com.

References

    1. Hart GW. Nutrient regulation of signaling and transcription. J. Biol. Chem. 2019;294:2211–2231. - PMC - PubMed
    1. Seo J, Lee KJ. Post-translational modifications and their biological functions: Proteomic analysis and systematic approaches. J. Biochem. Mol. Biol. 2004;37:35–44. - PubMed
    1. Bah A, Forman-Kay JD. Modulation of intrinsically disordered protein function by post-translational modifications. J. Biol. Chem. 2016;291:6696–6705. - PMC - PubMed
    1. Buuh ZY, Lyu Z, Wang RE. Interrogating the roles of post-translational modifications of non-histone proteins. J. Med. Chem. 2018;61:3239–3252. - PubMed
    1. Yang YR, Suh PG. O-GlcNAcylation in cellular functions and human diseases. Adv. Biol. Regul. 2014;54:68–73. - PubMed

Publication types

MeSH terms