. 2022 May;40(5):787-798.
doi: 10.1038/s41587-021-01074-4. Epub 2021 Nov 11.

A fluorescent sensor for spatiotemporally resolved imaging of endocannabinoid dynamics in vivo

Affiliations

A fluorescent sensor for spatiotemporally resolved imaging of endocannabinoid dynamics in vivo

Ao Dong et al. Nat Biotechnol. 2022 May.

Abstract

Endocannabinoids (eCBs) are retrograde neuromodulators with important functions in a wide range of physiological processes, but their in vivo dynamics remain largely uncharacterized. Here we developed a genetically encoded eCB sensor called GRABeCB2.0. GRABeCB2.0 consists of a circular-permutated EGFP and the human CB1 cannabinoid receptor, providing cell membrane trafficking, second-resolution kinetics with high specificity for eCBs, and shows a robust fluorescence response at physiological eCB concentrations. Using GRABeCB2.0, we monitored evoked and spontaneous changes in eCB dynamics in cultured neurons and acute brain slices. We observed spontaneous compartmentalized eCB transients in cultured neurons and eCB transients from single axonal boutons in acute brain slices, suggesting constrained, localized eCB signaling. When GRABeCB2.0 was expressed in the mouse brain, we observed foot shock-elicited and running-triggered eCB signaling in the basolateral amygdala and hippocampus, respectively. In a mouse model of epilepsy, we observed a spreading wave of eCB release that followed a Ca2+ wave through the hippocampus. GRABeCB2.0 is a robust probe for eCB release in vivo.


Figures

Extended Data Fig. 1
Extended Data Fig. 1. Strategy for optimizing and screening the GRABeCB sensors
a, A flowchart showing the development process of the eCB2.0 sensor. Responses to 10 μM 2-AG of candidate sensors were shown alongside each step. b, Schematic diagram depicting the structure of the GRABeCB2.0 sensor. The IgK leader sequence and the sequence derived from GRABNE are shown. c, Amino acids sequence of the eCB2.0 sensor. The phenylalanine residue at position 1772.64 in the CB1R was mutated to an alanine to generate the eCBmut sensor (indicated by the gray box). Note that the numbering used in the figure corresponds to the start of the IgK leader sequence.
Extended Data Fig. 2
Extended Data Fig. 2. Dose–response curves of GRABeCB2.0 to synthetic CB1R agonists and the phytocannabinoid Δ-9-THC
a, Dose–response curve of eCB2.0 to WIN55212-2; n = 3 wells each, mean ± s.e.m. b, Dose–response curve of eCB2.0 to CP55940; n = 3 wells each, mean ± s.e.m. c, Dose–response curve of eCB2.0 to Δ-9-THC; n = 3 wells each, mean ± s.e.m.
Extended Data Fig. 3
Extended Data Fig. 3. Photostability and intracellular signaling couplings of GRABeCB2.0 sensor
a, Normalized fluorescence of EGFP-CAAX and eCB2.0 (in the absence and presence of 2-AG) in HEK293T cells during 1P (confocal) bleaching. b, Integrated fluorescence of EGFP-CAAX and eCB2.0 (in the absence and presence of 2-AG) shown in a; n = 29, 27, 28 cells from 3 cultures. Boxes show the first and third quartiles as well as the median (line), and the whiskers extend to the most extreme data point that is no more than 1.5× the interquartile range from the box. Two-tailed Mann-Whitney tests were performed: P=1.44E-10 (between EGFP and eCB2.0 in saline) and 1.37E-6 (between EGFP and eCB2.0 with 2-AG). c, Fast and slow time constants and slow component amplitudes of EGFP-CAAX and eCB2.0 (in the absence and presence of 2-AG) traces fit by double exponentials. d, Normalized fluorescence of EGFP-CAAX and eCB2.0 (in the absence and presence of 2-AG) in HEK293T cells during 2P bleaching. e, Time constants of EGFP-CAAX and eCB2.0 (in the absence and presence of 2-AG) traces fit by single exponentials; n = 79, 48, 104 cells from 3 cultures. Boxes show the first and third quartiles as well as the median (line), and the whiskers extend to the most extreme data point that is no more than 1.5× the interquartile range from the box. Two-tailed Mann-Whitney tests were performed: P=0.0049 (between EGFP and eCB2.0 in saline) and 0.0581 (between EGFP and eCB2.0 with 2-AG). f, Schematic diagram depicting the strategy for measuring G protein activation using the chimeric Gαq-i protein. g, Representative traces showing the jRGECO1a responses to 2-AG perfusion in cells expressing CB1R, CB1R+eCB2.0 or eCB2.0. h, Dose-response curves of peak jRGECO1a ΔF/F0 measured in cells expressing CB1R, CB1R+eCB2.0, or eCB2.0; n = 4, 4 and 3 cultures, mean ± s.e.m. Two concentrations of 2-AG were used for eCB2.0 expressed cells. Two-tailed Student’s t tests were performed: P=0.2392, 0.1455, 0.6711, 0.9191 and 0.8371 (between CB1R and CB1R+eCB2.0); P= 0.0156 and 0.0015 (between CB1R and eCB2.0). i, G protein coupling was measured using a BRET Gβγ sensor in cells expressing CB1R, eCB2.0, or eCBmut; n = 3 experiments, mean ± s.e.m. Two-tailed Student’s t tests were performed: P=3.84E-05, 0.4082, 0.0699 and 0.2961. j, β-arrestin coupling was measured using the Tango assay in cells expressing CB1R, eCB2.0, or eCBmut; n = 3 wells each, mean ± s.e.m. k, Dose-response curves of eCB2.0 to 2-AG measured in cells expressing eCB2.0 or eCB2.0+CB1R; n = 3 wells each, mean ± s.e.m. Two-tailed Student’s t tests were performed: P=0.3036, 0.3231, 0.7697, 0.7900, 0.9723, 0.5482 and 0.1383. ***, p < 0.001; **, p < 0.01; *, p < 0.05; n.s., not significant.
Extended Data Fig. 4
Extended Data Fig. 4. Expression of GRABeCB2.0 has no significant effect on electrically evoked glutamate release in cultured neurons
a, Fluorescence microscopy images of neurons expressing Rncp-iGluSnFR (upper) and neurons co-expressing Rncp-iGluSnFR and eCB2.0 (bottom). Similar results were observed for more than 20 neurons. Scale bar, 30 μm. b, Example traces showing the electrical stimulation evoked glutamate signals. c, Pseudocolor change in Rncp-iGluSnFR fluorescence in neurons expressing Rncp-iGluSnFR (upper) and co-expressing Rncp-iGluSnFR and eCB2.0 (bottom) before and after the electrical stimulation. Shown are 25 regions of interest (ROIs) in one culture each. d, Summary of peak Rncp-iGluSnFR ΔF/F0 measured in neurons expressing Rncp-iGluSnFR (upper) or co-expressing Rncp-iGluSnFR and eCB2.0 (bottom); n = 100 ROIs from 4 cultures each. Boxes show the first and third quartiles as well as the median (line), and the whiskers extend to the most extreme data point that is no more than 1.5× the interquartile range from the box. Two-tailed Mann-Whitney test was performed: P=0.2564. n.s., not significant.
Extended Data Fig. 5
Extended Data Fig. 5. Estimated concentrations of electrically evoked 2-AG release in cultured neurons
a, An example trace of ΔF/F0 measured in eCB2.0 expressed neurons; the indicated concentrations of 2-AG were applied. b, An example dose-response curve measured in neurons expressing eCB2.0. eCB2.0 signals evoked by 1 – 100 electrical pulses at 20 Hz and corresponding estimated 2-AG concentrations were indicated (green dots). c, Summary of estimated 2-AG release concentrations evoked by 1 – 100 electrical pulses at 20 Hz; n = 3 cultures, mean ± s.e.m.
Extended Data Fig. 6
Extended Data Fig. 6. Spontaneous eCB transients in cultured neurons are sensitive to the CB1R neutral antagonist but not the action potential blocker
a, Cumulative transient change in eCB2.0 fluorescence measured during 20 mins of recording in the absence (left) or presence (right) of 1 μM NESS0327. Pseudocolor images were calculated as the average temporal projection subtracted from the maximum temporal projection. Similar results were observed for 3 cultures. Scale bar, 100 μm. b, Summary of the frequency of transient changes in eCB2.0 fluorescence measured in saline (Ctrl) and after NESS0327 application; n = 18 & 18 sessions from 3 cultures with 10-min recording/session. Boxes show the first and third quartiles as well as the median (line), and the whiskers extend to the most extreme data point that is no more than 1.5× the interquartile range from the box. Two-tailed Student’s t test was performed: P=1.68E-5. c, Cumulative transient change in eCB2.0 fluorescence measured during 20 mins of recording in the absence (left) or presence (right) of 1 μM TTX. Pseudocolor images were calculated as the average temporal projection subtracted from the maximum temporal projection. Similar results were observed for 3 cultures. Scale bar, 100 μm. d, Summary of the frequency of transient changes in eCB2.0 fluorescence measured in saline (Ctrl) and after TTX application; n = 12 & 14 sessions from 3 cultures with 10-min recording/session. Boxes show the first and third quartiles as well as the median (line), and the whiskers extend to the most extreme data point that is no more than 1.5× the interquartile range from the box. Two-tailed Student’s t test was performed: P=0.5972. ***, p < 0.001; n.s., not significant.
Extended Data Fig. 7
Extended Data Fig. 7. Detection of 2-AG, AEA, and DSI in GRABeCB2.0 expressed acute striatal slices
a, Schematic diagram depicting the strategy for virus injection in DLS, followed by the preparation of acute brain slices used for electrical stimulation and recording. b, Schematic diagram depicting the quantification of F0 and decay time constant of the evoked eCB2.0 signal. c, Quantification of relative F0 and decay time constant of evoked eCB2.0 signals before and after JZL184 or URB597 treatment. n = 3 slices, mean ± s.e.m. d, Fluorescence microscopy images of control and eCB2.0 expressed striatal slices. Recorded MSN neurons were loaded with Alexa 594. Similar results were observed for more than 10 neurons. Scale bar, 10 μm. e, Depolarizing neurons in control and eCB2.0 expressed striatum caused similar depression on sIPSC. Three shadow regions correspond to baseline, early and late in c. f, Summary of normalized charge recorded in MSNs in control and eCB2.0 expressed striatum during baseline, right after depolarization (early) and 16 s after depolarization (late); n = 8 and 13 neurons, mean ± s.e.m. Two-tailed Wilcoxon matched-pairs signed rant tests were performed: P=0.0078 (upper left), 0.0234 (upper right), 0.0134 (bottom left) and 0.0266 (bottom right). **, p < 0.01; *, p < 0.05.
Extended Data Fig. 8
Extended Data Fig. 8. Detection of eCB signals in acute hippocampal and BLA slices using 2 photon imaging
a, Schematic diagram depicting the strategy for virus injection in the hippocampal CA1 region, followed by the preparation of acute slices for electrical stimulation and 2-photon imaging. b, (Left) fluorescence image of eCB2.0 expressed in the hippocampal CA1 region, showing the position of the stimulating electrode. (Right) pseudocolor images showing the change in eCB2.0 fluorescence at baseline and after 10 or 50 pulses applied at 20 Hz. The dashed circle shows the ROI for quantification. Similar results were observed for 5 slices. Scale bar, 100 μm. c, Representative traces and summary of the peak change in eCB2.0 fluorescence evoked by electrical pulses applied at the indicated frequencies; n = 5 slices, mean ± s.e.m. d, Time course of the change in eCB2.0 fluorescence; where indicated, AEA and AM251 were applied. e, Representative traces of the change in eCB2.0 fluorescence evoked by electrical stimulation in the absence and presence of AM251. f, Schematic diagram depicting the strategy for virus injection in the BLA region, followed by the preparation of acute slices for electrical stimulation and 2-photon imaging. g, Pseudocolor images showing the change in eCB2.0 fluorescence after 20, 50 or 100 pulses applied at 20 Hz. Similar results were observed for 3 slices. Scale bar, 100 μm. h, Traces of eCB2.0 fluorescence evoked by electrical pulses applied at the indicated frequencies. i, Representative pseudocolor image, trace, and summary of peak change in eCB2.0 fluorescence upon 75 mM K+ ACSF perfusion. Scale bar, 100 μm. n = 3 slices, mean ± s.e.m.
Extended Data Fig. 9
Extended Data Fig. 9. Expression of GRABeCB sensors has minimal effect on animal behaviors
a, Fluorescence images of coronal slices prepared from mice expressing GFP or GRABeCB2.0 in BLA. Similar results were observed for 6 mice. Scale bar, 1 mm. b, Schematic diagrams showing the open field test (OFT) and the elevated plus maze test (EPMT). c, Quantification of behavioral parameters in the OFT. n = 6 mice, mean ± s.e.m. Two-tailed Student’s t tests were performed: P=0.2084, 0.8737, 0.5858 and 0.4464. d, Quantification of behavioral parameters in the EPMT. n = 6 mice, mean ± s.e.m. Two-tailed Student’s t tests were performed: P=0.2912, 0.5377, 0.6007, 0.3386, 0.3748, 0.4958 and 0.1411. e, Schematic diagram showing the fear conditioning test. f, Quantification of freezing behavior before, during and after conditioning. n = 6 mice, mean ± s.e.m. Two-way ANOVA test was performed: P=0.3799 (between two animal groups during conditioning); two-tailed Student’s t tests were performed: P=0.3297 and 0.8669 (during retrieval). g, Quantification of averaged speed, running speed and averaged distance in control, eCB2.0 and eCBmut expressing mice; n = 19, 8 and 6 mice. Boxes show the first and third quartiles as well as the median (line), and the whiskers extend to the most extreme data point that is no more than 1.5× the interquartile range from the box. One-way ANOVA tests were performed: P=0.9017, 0.0681 and 0.4197. n.s., not significant.
Extended Data Fig. 10
Extended Data Fig. 10. eCB and Ca2+ waves in mouse hippocampal CA1 region during seizure activity
In vivo two-photon fluorescence images of eCB2.0 and jRGECO1a expressed in the mouse hippocampal CA1 region before and after stimulus evoked seizure activity. Frames were extracted from those shown in Supplementary Video 1. Seconds (s) after the stimulus are indicated. Similar results were observed for 6 mice. Scale bar, 100 μm.
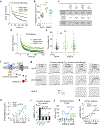
Fig. 1 ∣
Fig. 1 ∣. Development, optimization, and characterization of GRABeCB sensors in HEK293T cells
a, Schematic diagram depicting the design and principle of the GRABeCB sensor, consisting of the CB1 receptor and circular-permutated GFP. Ligand binding activates the sensor, inducing a change in fluorescence. b, Screening and optimization steps of GRABeCB sensors and the normalized fluorescence response to 10 μM 2-AG. c, Expression and fluorescence change in response to 100 μM 2-AG and AEA in HEK293T cells expressing eCB2.0. Similar results were observed for more than 20 cells. Scale bar, 30 μm. d, Dose-response curves measured in HEK293T cells expressing eCB2.0 or eCBmut, with the corresponding EC50 values for 2-AG and AEA shown; n = 6 experiments, mean ± s.e.m. e, Normalized fluorescence change in response to the indicated compounds (each at 10 μM) measured in cells expressing eCB2.0. Where indicated, the CB1R inverse agonist AM251 was also added. LPA, lysophosphatidic acid; S1P, sphingosine-1-phosphate; ACh, acetylcholine; DA, dopamine; GABA, gamma-aminobutyric acid; Glu, glutamate; Gly, glycine; NE, norepinephrine; 5-HT, 5-hydroxytryptamine; His, histamine; Epi, epinephrine; Ado, adenosine; Tyr, tyramine. n = 3 wells for ACh, Glu, Gly, NE, 5-HT, His, Epi, Ado and Tyr; n = 4 for other groups, mean ± s.e.m. One-way ANOVA test was performed for all groups: P=8.00E-26; Tukey tests were performed post hoc: P=0 (between 2-AG and AEA+AM251, 2-AG+AM251, LPA, …, or Tyr), P=0 (between AEA and AEA+AM251, 2-AG+AM251, LPA, …, or Tyr). f, Illustration of the localized puffing system using a glass pipette containing 100 μM 2-AG and/or AM251 positioned above an eCB2.0-expressing cell. The dotted black line indicates the region of interest for line scanning. Similar results were observed for more than 10 cells. Scale bar, 30 μm. g, Change in eCB2.0 fluorescence was measured in an eCB2.0-expressing cell using line scanning; where indicated, 2-AG and AM251 were puffed on the cell. The graph at the right summarizes the on and off time constants measured upon application of 2-AG and upon application of AM251, respectively; n = 11 (τon) and 4 (τoff) cells, mean ± s.e.m. h, One-photon (1P) excitation and emission spectra and two-photon (2P) excitation spectra of eCB2.0 in the absence and presence of 2-AG. Excitation and emission peaks were labeled. ***, p < 0.001.
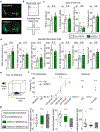
Fig. 2 ∣
Fig. 2 ∣. Characterization of GRABeCB sensors in primary cultured neurons
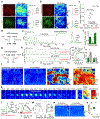
a, Fluorescence microscopy images of primary cultured rat cortical neurons expressing eCB2.0 (green) and either synaptophysin-mScarlet (top row; red) or PSD95-mScarlet (bottom row; red). In the top row, arrows indicate axons; in the bottom row, arrowheads indicate dendrites and dendritic spines. Similar results were observed for more than 10 neurons. Scale bars, 30 μm (top row) and 15 μm (bottom row). b, Fluorescence microscopy images and fluorescence response to 100 μM 2-AG (top row) or AEA (bottom row) in neurons expressing eCB2.0 (left) or eCBmut (right). The insets in the eCBmut images are contrast-enhanced to show expression of the sensor. Similar results were observed for more than 30 neurons. Scale bars, 30 μm. c, (Left) example traces of ΔF/F0 measured in an eCB2.0-expressing neuron; the indicated concentrations of 2-AG and AEA, followed by 100 μM AM251, were applied. (Right) dose-response curves measured in neurons expressing eCB2.0 or eCBmut, with the corresponding EC50 values shown; n = 5 cultures each, mean ± s.e.m. d, Summary of the change in eCB2.0 fluorescence in response to 100 μM 2-AG or AEA measured in the neurites and soma; n = 5 cultures each, mean ± s.e.m. Paired two-tailed Student’s t tests were performed: P=0.0073 (left) and 0.0068 (right). e, Example images (left), trace (middle), and quantification (right) of the change in eCB2.0 fluorescence in response to a 2-hour application of WIN55212-2, followed by AM251; n = 3 cultures each, mean ± s.e.m. Similar results were observed for more than 20 neurons. Scale bar, 100 μm. One-way ANOVA test was performed all groups: P= 4.48E-13; Tukey tests were performed post hoc: P=0 (between Saline and 0.5 h, 1.0 h, 1.5 h or 2.0 h), P=0 (between AM251 and 0.5 h, 1.0 h, 1.5 h or 2.0 h). ***, p < 0.001; **, p < 0.01.
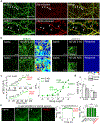
Fig. 3 ∣
Fig. 3 ∣. Release of endogenous eCB measured in primary cultured neurons
a, Fluorescence microscopy images and fluorescence response measured in neurons co-expressing Rncp-iGluSnFR (red) and eCB2.0 (green). Similar results were observed for more than 20 neurons. Scale bar, 200 μm. b, Fluorescence microscopy images and fluorescence response measured in eCB2.0-expressing neurons preloaded with Calbryte-590 (red). Similar results were observed for more than 20 neurons. Scale bar, 200 μm. c, Relative peak change in eCB2.0 fluorescence plotted against the relative peak change in Calbryte590 fluorescence measured in response to the indicated number of electrical pulses, normalized to the response evoked by 200 pulses; n = 4 cultures each, mean ± s.e.m. Also shown is the response to 20 electrical pulses with no extracellular Ca2+. d, Diagram depicting the pathway for eCB synthesis. DAG, diacylglycerol; DAGL, diacylglycerol lipase; NAPE, N-arachidonoyl phosphatidylethanolamine; NAPE-PLD, NAPE-hydrolyzing phospholipase D. e, Representative traces (left) and expanded traces (right) showing the change in eCB2.0 fluorescence in responses to 20 electrical pulses applied before (1) and after (2) DO34 application; WIN55212-2 was applied at the end of the experiment. f, Summary of the peak change in eCB2.0 fluorescence in response to 20 pulses applied at baseline (Ctrl), 26 min after DO34 application, and after WIN55212-2 application; n = 3 cultures each, mean ± s.e.m. Paired two-tailed Student’s t test was performed: P=0.0004. g, Diagram depicting the degradation pathways for 2-AG and AEA. AA, arachidonic acid; MAGL, monoacylglycerol lipase; FAAH, fatty acid amide hydrolase. h, Representative traces (left) and expanded traces (right) showing the change in eCB2.0 fluorescence in response to 20 electrical pulses applied before (1) and after (2) JZL184 or URB597 application; AM251 was applied at the end of the experiment. i, Summary of the decay time constant (τdecay) measured at baseline (Ctrl) and 68 min after application of either JZL184 or URB597; n = 3 and 4 cultures each, mean ± s.e.m. Paired two-tailed Student’s t test was performed: P=0.0462 (left) and 0.0354 (right). j, Pseudocolor images showing spontaneous changes in eCB2.0 fluorescence transients, single pulse–evoked fluorescence change, and the change in fluorescence induced by 10 μM WIN55212-2 (note the difference in scale). Scale bar, 100 μm. k, Time-lapse pseudocolor images taken from the area shown by the bottom dashed rectangle in panel j. Scale bar, 10 μm. l, Traces from the experiment shown in panel k, showing the change in fluorescence measured spontaneously, induced by a single pulse, or in the presence of AM251. Normalized traces with the corresponding rise time constants are shown at the right. m, Spatial profile of the transient change in fluorescence shown in panel k. The summary data are shown at the right; n = 42 transients from 3 cultures. n, Cumulative transient change in eCB2.0 fluorescence measured during 19 mins of recording in the absence (left) or presence (right) of AM251 (right). Pseudocolor images were calculated as the average temporal projection subtracted from the maximum temporal projection. Scale bar, 100 μm. o, Summary of the frequency of transient changes in eCB2.0 fluorescence measured before (Ctrl) and after AM251 application; n = 5 & 3 with 10-min recording/session. Boxes show the first and third quartiles as well as the median (line), and the whiskers extend to the most extreme data point that is no more than 1.5× the interquartile range from the box. Two-tailed Student’s t test was performed: P=5.79E-06. ***, p < 0.001; *, p < 0.05.
Fig. 4 ∣
Fig. 4 ∣. Using the GRABeCB sensor to detect eCB release in acute brain slices
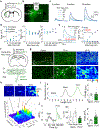
a, Schematic diagram depicting the strategy for virus injection in the dorsolateral striatum (DLS), followed by the preparation of acute brain slices used for electrical stimulation and photometry recording. The dashed box corresponds to the image shown in panel b. b, Fluorescence image of a coronal slice prepared from a mouse following injection of AAV-syn-eCB2.0 in the DLS, with a diagram showing the electrode position and photometry recording. Similar results were observed for more than 6 slices. Scale bar, 1 mm. c, Representative traces showing the change in eCB2.0 fluorescence evoked by 2, 5, or 10 electrical pulses applied at the indicated frequencies. d, Peak change in eCB2.0 fluorescence (left), rise t1/2 (middle), and decay time constant (right) plotted against stimulation frequency for 2, 5, and 10 pulses; n = 6 slices, mean ± s.e.m. e, Representative traces (left) and summary of the peak change in eCB2.0 fluorescence (right) evoked by electrical pulses at the indicated frequency in slices expressing eCB2.0 in the absence or presence of AM251 and in slices expressing eCBmut; n = 4 slices for eCB2.0 and AM251 groups, n = 3 for eCBmut group, mean ± s.e.m. f, Schematic diagram depicting the strategy for viral expression in the hippocampal CA1 of CB1R-P2A-FlpO mice and the expression of eCB2.0 in CB1R positive neurons. g, Fluorescence images of eCB2.0 expressed in CA1 region in saline (left) and 75 mM K+ solution (middle) conditions. Pseudocolor images showing the change in eCB2.0 fluorescence after 75 mM K+ solution perfusion (right). Bottom images are taken from the area shown by the dashed yellow box in the upper panels. Similar results were observed for more than 5 slices. Scale bar, 20 μm (upper) and 5 μm (bottom). h, Representative images and 3D illustration showing a bouton during baseline, spontaneous eCB release and 75 mM K+ induced eCB release conditions. Scale bar, 2 μm. i, Spatial profile of the transient change in fluorescence from a single bouton shown in panel h. The summary data are shown at the right; n = 6 and 21 boutons, mean ± s.e.m. j, (Left) Temporal profile of the transient change in fluorescence from a single bouton shown in panel h. (Right) The summary data of t1/2 and peak ΔF/F0; n = 6 and 21 boutons, mean ± s.e.m.
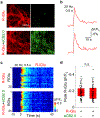
Fig. 5 ∣
Fig. 5 ∣. Measuring in vivo eCB signals in the mouse basolateral amygdala in response to foot shock
a, Schematic diagram depicting the strategy for viral expression in the basolateral amygdala, optogenetic stimulation and fiber photometry recording. b, Immunofluorescence image showing eCB2.0 (green) and ChRmine (red) expressed in the BLA and the placement of the recording fiber. Similar results were observed for 4 mice. Scale bar, 200 μm. c, Representative traces of the change in eCB2.0 fluorescence (averaged green trace with 5 single-trial gray traces) in response to 635 nm laser stimulation in the BLA from 1 mouse; isosbestic signals (averaged black trace with 5 single-trial gray traces) were used to monitor potential movement artifacts. d, Quantification of peak amplitudes (z-score) of the signals in all mice. n = 4 mice, mean ± s.e.m. Paired two-tailed Student’s t test was performed: P=0.0418. e, Schematic diagram depicting the strategy for viral expression in the basolateral amygdala. f, Immunofluorescence image showing eCB2.0 (green) and mCherry (red) expressed in the BLA and the placement of the recording fiber; the nuclei were counterstained with DAPI (blue). Similar results were observed for 6 mice. Scale bar, 300 μm. g, Schematic diagram depicting the fiber photometry recording during foot shock and representative single-trial traces of the change in eCB2.0 and mCherry fluorescence; an electrical foot shock (2-sec duration) was applied at time 0. h, Pseudocolor change in eCB2.0 fluorescence before and after a 2-sec foot shock. Shown are five consecutive trials in one mouse, time-aligned to the onset of each foot shock. i, (Left) average traces of the change in eCB2.0 and mCherry (top) and eCBmut and mCherry (bottom) fluorescence; the gray shaded area indicates application of an electrical foot shock. (Right) summary of the peak change in fluorescence; n = 6 mice each, mean ± s.e.m. Paired two-tailed Student’s t test (between eCB2.0 and mCh) and two-tailed Student’s t test (between eCB2.0 and eCBmut) were performed: P=0.0009 and 1.35E-06. j, Summary of rise and decay time constants measured for the change in eCB2.0 fluorescence in response to foot shock; n = 21 trials for rise measurement and n = 18 trials for decay measurement from 6 animals, mean ± s.e.m. ***, p < 0.001; *, p < 0.05.
Fig. 6 ∣
Fig. 6 ∣. Measuring in vivo eCB dynamics in the mouse hippocampus during running and seizure activity
a, Schematic diagram depicting the strategy for viral expression and cannula placement in the mouse hippocampus. b, (Left) Fluorescence microscopy image showing eCB2.0 expression in the hippocampal CA1 region in a coronal brain slice. Scale bars, 200 μm and 50 μm (inset). (Right) In vivo 2-photon image of the pyramidal layer in the hippocampal CA1 region, showing eCB2.0 (green) and jRGECO1a (red) fluorescence. Scale bar, 50 μm. c, Schematic cartoon illustrating the experiment in which a mouse expressing eCB2.0 and jRGECO1a in the hippocampal CA1 is placed on a treadmill and allowed to run spontaneously while fluorescence is measured using 2-photon microscopy. d, Average traces of eCB2.0/eCBmut and jRGECO1a transients recorded in the soma of individual neurons in the pyramidal layer upon the start and stop of spontaneous running episodes (dashed lines). e, Summary of the peak responses in panel d; n = 7 and 4 mice each for eCB2.0 and eCBmut, respectively, mean ± s.e.m. Two-tailed Student’s t test was performed between jR and jR: P=0.5979; one-tailed Student’s t test was performed between eCB2.0 and eCBmut: P=0.0284. f, Summary of the rise and decay kinetics of the jRGECO1a and eCB2.0 signals measured at the start and end of spontaneous running; n = 7 mice, mean ± s.e.m. Paired two-tailed Student’s t tests were performed: P=0.5954 (left) and 0.0993 (right). g, Schematic diagram depicting the electrode placement and 2-photon imaging in mice expressing eCB2.0 and jRGECO1a in the hippocampal CA1 region; the electrode is used to induce kindling seizure activity and to measure the local field potential (LFP). h, Example LFP trace (top) and medio-lateral projections (line profile) of jRGECO1a (middle) and eCB2.0 (bottom) fluorescence during stimulus-induced non-convulsive seizures and a subsequent spreading wave. The dashed vertical line at time 0 indicates the stimulus onset. i, Individual (thin gray lines) and average (thick lines) traces of the change in jRGECO1a and eCB2.0/eCBmut fluorescence measured during seizure activity. The dashed vertical line at time 0 indicates the stimulus onset. The summary of the area under the curve (AUC) is shown at the right; n = 8 and 4 for eCB2.0 and eCBmut, respectively, mean ± s.e.m. Two-tailed Student’s t tests were performed: P=0.2607 (between jR and jR:) and P=0.00098 (between eCB2.0 and eCBmut). j, Spreading eCB wave measured through the hippocampal CA1 region after seizure activity. ROIs representing individual neurons are pseudocolored based on the peak time of their eCB2.0 signal relative to the peak time of the average signal, and the arrow shows the direction of the wave. a, anterior; l, lateral; m, medial; p, posterior. k, Traces of eCB2.0 fluorescence measured in individual cells sampled systematically along a line fitted to the spreading wave. The dashed line shows the spreading of peak signals. l, Velocity and direction of the spreading jRGECO1a and eCB2.0 waves. The length of each arrow indicates the velocity in μm/s. In each panel, each colored arrow indicates an individual session, and the thick black line indicates the average. n = 7 sessions in 6 mice. ***, p < 0.001; *, p < 0.05; n.s., not significant.

References

    1. Zuardi AW History of cannabis as a medicine: a review. Braz J Psychiatry 28, 153–157, doi:10.1590/s1516-44462006000200015 (2006). - DOI - PubMed
    1. Piomelli D The molecular logic of endocannabinoid signalling. Nat Rev Neurosci 4, 873–884, doi:10.1038/nrn1247 (2003). - DOI - PubMed
    1. Wilson RI & Nicoll RA Endocannabinoid signaling in the brain. Science 296, 678–682, doi:10.1126/science.1063545 (2002). - DOI - PubMed
    1. Kano M, Ohno-Shosaku T, Hashimotodani Y, Uchigashima M & Watanabe M Endocannabinoid-mediated control of synaptic transmission. Physiological reviews 89, 309–380, doi:10.1152/physrev.00019.2008 (2009). - DOI - PubMed
    1. Hebert-Chatelain E et al. A cannabinoid link between mitochondria and memory. Nature 539, 555–559, doi:10.1038/nature20127 (2016). - DOI - PubMed

Publication types

Substances