. 2022 Apr;40(4):527-538.
doi: 10.1038/s41587-021-01091-3. Epub 2021 Nov 11.

Identifying phenotype-associated subpopulations by integrating bulk and single-cell sequencing data

Affiliations

Identifying phenotype-associated subpopulations by integrating bulk and single-cell sequencing data

Duanchen Sun et al. Nat Biotechnol. 2022 Apr.

Abstract

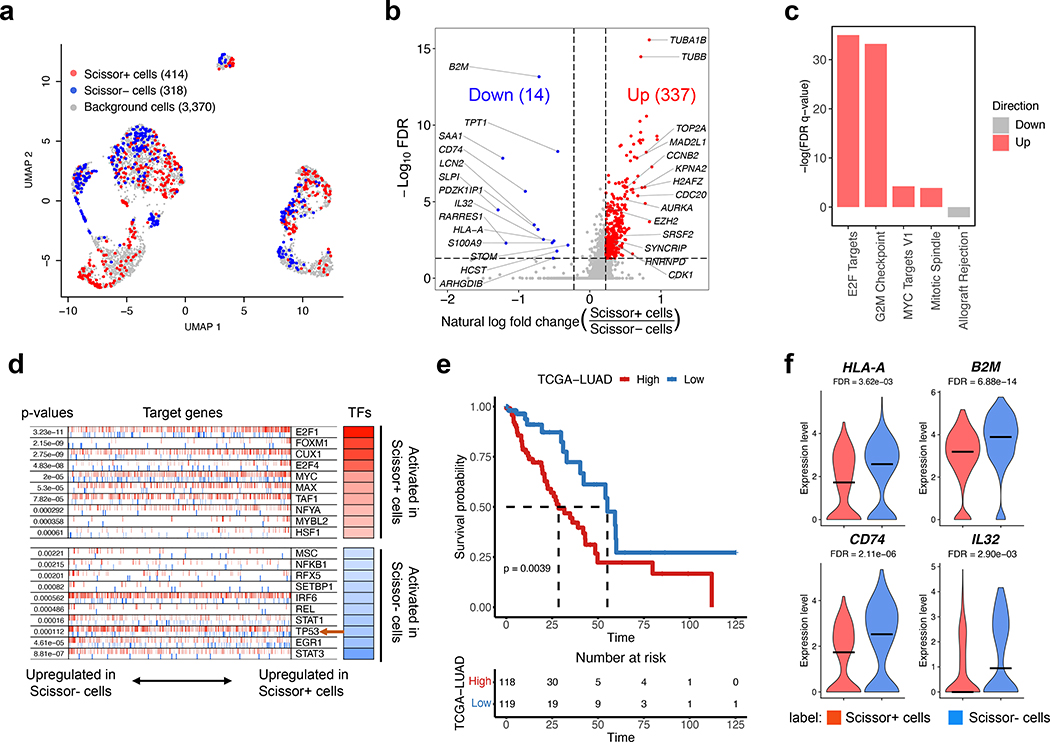
Single-cell RNA sequencing (scRNA-seq) distinguishes cell types, states and lineages within the context of heterogeneous tissues. However, current single-cell data cannot directly link cell clusters with specific phenotypes. Here we present Scissor, a method that identifies cell subpopulations from single-cell data that are associated with a given phenotype. Scissor integrates phenotype-associated bulk expression data and single-cell data by first quantifying the similarity between each single cell and each bulk sample. It then optimizes a regression model on the correlation matrix with the sample phenotype to identify relevant subpopulations. Applied to a lung cancer scRNA-seq dataset, Scissor identified subsets of cells associated with worse survival and with TP53 mutations. In melanoma, Scissor discerned a T cell subpopulation with low PDCD1/CTLA4 and high TCF7 expression associated with an immunotherapy response. Beyond cancer, Scissor was effective in interpreting facioscapulohumeral muscular dystrophy and Alzheimer's disease datasets. Scissor identifies biologically and clinically relevant cell subpopulations from single-cell assays by leveraging phenotype and bulk-omics datasets.


Figures

Fig. 1.
Fig. 1.. The workflow of Scissor and its performance in applications with known phenotype-associated cell subpopulations.
a, The inputs for Scissor are a single-cell expression matrix, a bulk expression matrix, and a corresponding phenotype of interest such as drug response or clinical information. b, Scissor calculates a correlation matrix and a cell-cell similarity network based on input sources, which are further integrated with the phenotype into a network regularized sparse regression model to select the most relevant cell subpopulations. c, The selected cells by Scissor with red and blue dots indicating the cells positively or negatively associated with the phenotype of interest. d, The Scissor results are evaluated by a reliability significance test to control the false associations between single-cell and bulk data. MSE, mean squared error; AUC, area under the ROC curve; c-index, concordance index. e, The selected cells by Scissor can be further investigated by downstream analyses. f, The UMAP visualization of the simulated cells. The orange and green dots are the ground truth cell subpopulations specific to phenotype I and II, respectively. g, The visualization of the Scissor selected cells on the same UMAP as in a. The red and blue dots are the Scissor selected cells associated with phenotype I and II. h, The Venn diagrams show overlaps between the Scissor selected cells and the ground truth phenotype-specific cells. i, The UMAP visualization of 29,888 LUAD cells. The color encoding the cell types defined in the original paper. j, The UMAP visualization of the Scissor selected cells. The red and blue dots are cells associated with the tumor and normal phenotypes. k. The pie chart of the Scissor selected cells with the corresponding bar plots showing the detailed constitutions in each type defined in i.
Fig. 2.
Fig. 2.. Scissor identification results on lung cancer cells guided by TCGA-LUAD survival outcomes.
a, The UMAP visualization of 4,102 LUAD cancer cells. b, The UMAP visualization of the Scissor selected cells. The red and blue dots are Scissor+ (worse survival) and Scissor- (good survival) cells. c, The bar plot shows the constitution of Scissor+ cells in different clusters. d, The volcano plot of differential gene expressions in Scissor+ cells versus all other cells. The two vertical dashed lines represent ± ln(1.25) fold-changes in gene expression, and the horizontal dashed line denotes FDR cutoff 0.05. The FDR was the adjusted p-value calculated by the two-tailed Wilcoxon rank-sum test. e, The violin plots of expression levels of selected up-regulated genes in Scissor+ cells. The FDR was the adjusted p-value calculated by the two-tailed Wilcoxon rank-sum test. f, The enrichment bar plot of selected hypoxia-related Reactome and Hallmark pathways. g, The Kaplan-Meier survival curves show the clinical relevance of the lung cancer signature on four independent datasets. Tick marks indicate censoring events. The statistical p-values were determined by the two-tailed log-rank sum test. h, The forest plots show the hazard ratios and 95% confidence intervals for the lung cancer signature and three additional clinical features according to the univariate Cox model. i, The forest plots show the hazard ratios and 95% confidence intervals for the lung cancer signature and stage information according to the multivariable Cox model. Squares represent the hazard ratios and the horizontal bars extend from the lower limits to the upper limits of the 95% confidence intervals of the estimates of the hazard ratios. These statistics are calculated on GSE11969 (n = 149 biologically independent samples) and GSE13213 (n = 117 biologically independent samples), respectively. The statistical p-values were determined by the two-tailed Wald test.
Fig. 3.
Fig. 3.. Scissor identification results on lung cancer cells guided by TP53 mutation status.
a, The UMAP visualization of the Scissor selected cells. The red and blue dots are cells associated with the TP53 mutant and wild-type phenotypes. b, The volcano plot of differential gene expressions in Scissor+ cells versus Scissor- cells. Red and blue points mark the genes with significantly increased or decreased expressions in Scissor+ cells (FDR <0.05 and absolute fold-change > 1.25). The two vertical dashed lines represent ± ln(1.25) fold-changes in gene expression, and the horizontal dashed line denotes FDR cutoff 0.05. The FDR was the adjusted p-value calculated by the two-tailed Wilcoxon rank-sum test. c, The enrichment bar plot of selected cell cycle-related pathways in the Hallmark domain. d, The master regulator analysis reveals the top 10 most activated TFs in Scissor+ cells and Scissor- cells, respectively. The targets of each TF are shown as tick marks with red vertical lines representing positive targets and blue vertical lines for negative targets. Each row also illustrates the statistical p-value and the inferred differential activity for each transcription factor. e, The Kaplan-Meier survival curve shows the clinical relevance of the TP53 mutation signature. Tick marks indicate censoring events. A table is attached below to display the number of alive patients at given time points. The statistical p-value was determined by the two-tailed log-rank sum test. f, The violin plots of expression levels of selected down-regulated genes in Scissor+ cells. The FDR was the adjusted p-value calculated by the two-tailed Wilcoxon rank-sum test.
Fig. 4.
Fig. 4.. Scissor identification results on melanoma T cells.
a, The UMAP visualization of 1,894 melanoma T cells in six clusters. b, The UMAP visualization of the Scissor selected cells. c, The bar plot shows the distribution of Scissor+ cells across the six T cell populations. d, The volcano plot of differential gene expressions in Scissor+ cells versus all other cells. The two vertical dashed lines represent ± ln(1.25) fold-changes, and the horizontal dashed line denotes FDR cutoff 0.05. The FDR was the adjusted p-value calculated by the two-tailed Wilcoxon rank-sum test. e, The violin plots show the expression levels of important immune genes in Scissor+ cells. The FDR was the adjusted p-value calculated by the two-tailed Wilcoxon rank-sum test. f, The enrichment bar plot shows the significantly enriched pathways in Scissor+ cells compared with all other cells (FDR <0.05). g, The boxplot shows the enrichment scores of the immunotherapy responsive signature in the non-responders and responders from Sade-Feldman’s cohort. h, The GSEA enrichment plot of the up and down signature genes in the responder vs. non-responder comparison from Sade-Feldman’s cohort. i, The boxplot shows the enrichment scores of the immunotherapy responsive signature in five types of CD8 T cells from a mouse liver tumor model (n = 3 biologically independent replicates per group from left to right). j, The boxplot shows the enrichment scores of the immunotherapy responsive signature in the memory precursor CD8 T cells and short-lived effector CD8 T cells (n = 3 biologically independent replicates in each condition). Box plot center line and box limits represent median value, upper, and lower quartiles, respectively. Box whiskers indicate the largest and smallest values no more than 1.5 times the interquartile range from the limits. The statistical p-value was determined by the two-tailed Student’s t-test, unless otherwise indicated.
Fig. 5.
Fig. 5.. Scissor identification results on Facioscapulohumeral muscular dystrophy (FSHD) cells.
a, The UMAP visualization of 6,899 cells derived from FSHD and control samples. b, The UMAP visualization of the Scissor selected cells. The red and blue dots are representing Scissor+ and Scissor- cells, associated with FSHD and control phenotypes, respectively. c, The bar plot shows the detailed phenotypic constitutions of the Scissor selected cells. d, The volcano plot of differential gene expressions in Scissor+ cells versus Scissor- cells. Red and blue points mark the genes with significantly increased or decreased expressions in Scissor+ cells compared to Scissor- cells (FDR <0.05 and absolute fold-change > 1.25). The two vertical dashed lines represent ± ln(1.25) fold-changes in gene expression, and the horizontal dashed line denotes FDR cutoff 0.05. The FDR was the adjusted p-value calculated by the two-tailed Wilcoxon rank-sum test. e, The violin plots show the expression levels of selected dysregulated genes in Scissor+ cells. The FDR was the adjusted p-value calculated by the two-tailed Wilcoxon rank-sum test. f, The enrichment bar plot of selected muscle-related pathways in the Hallmark, GO’s biological process, and cellular component domains. g, The boxplots show the enrichment scores of the FSHD molecular signature in the FSHD and normal controls from three independent validation datasets. The statistical p-values were determined by the two-tailed Student’s t-test. Box plot center line and box limits represent median value, upper, and lower quartiles, respectively. Box whiskers indicate the largest and smallest values no more than 1.5 times the interquartile range from the limits.
Fig. 6.
Fig. 6.. Scissor identification results on Alzheimer’s disease.
a-f. The UMAP visualizations of the Scissor selected cells on oligodendrocytes (a), OPCs (c), and astrocytes (e) with corresponding bar plots showing the phenotypic constitutions of the Scissor selected cells on oligodendrocytes (b), OPCs (d), and astrocytes (f). g, The heatmap of differential gene fold-changes in Scissor+ cells versus Scissor- cells across all three brain cell types. Red and blue elements mark the genes with significantly increased or decreased expressions in Scissor+ cells (FDR <0.05 and absolute fold change > 1.25). h, The heatmap of enriched Reactome pathways. The red and blue elements represent the activated and repressed pathways in corresponding cell types. i, The boxplot shows the enrichment scores of the oligodendrocytes molecular signature in AD patients and normal controls from GSE109887. j, The boxplot shows enrichment scores of the OPCs molecular signature in AD patients and normal controls from GSE109887. k, The boxplot shows the enrichment scores of the astrocytes molecular signature in AD patients and normal controls from GSE109887. l, The boxplot shows the enrichment scores of the astrocytes molecular signature in control, incipient, moderate, and severe stage AD patients from GSE28146 (n = 8, n = 7, n=8, and n = 7 biologically independent patients per group from left to right). The statistical p-value was determined by the Kruskal-Wallis test. The linear regression line represents the relationship between median enrichment scores and AD stages. Box plot center line and box limits represent median value, upper, and lower quartiles, respectively. Box whiskers indicate the largest and smallest values no more than 1.5 times the interquartile range from the limits. The statistical p-value was determined by the two-tailed Student’s t-test, unless otherwise indicated.

References

    1. Zhang Q et al. Landscape and Dynamics of Single Immune Cells in Hepatocellular Carcinoma. Cell 179, 829–845 e820 (2019). - PubMed
    1. Yofe I, Dahan R & Amit I Single-cell genomic approaches for developing the next generation of immunotherapies. Nat Med 26, 171–177 (2020). - PubMed
    1. Wagner J et al. A Single-Cell Atlas of the Tumor and Immune Ecosystem of Human Breast Cancer. Cell 177, 1330–1345 e1318 (2019). - PMC - PubMed
    1. Villani AC et al. Single-cell RNA-seq reveals new types of human blood dendritic cells, monocytes, and progenitors. Science 356 (2017). - PMC - PubMed
    1. Patel AP et al. Single-cell RNA-seq highlights intratumoral heterogeneity in primary glioblastoma. Science 344, 1396–1401 (2014). - PMC - PubMed

Publication types

LinkOut - more resources