

A new SEAIRD pandemic prediction model with clinical and epidemiological data analysis on COVID-19 outbreak
- PMID: 34764574
- PMCID: PMC7775669
- DOI: 10.1007/s10489-020-01938-3
A new SEAIRD pandemic prediction model with clinical and epidemiological data analysis on COVID-19 outbreak
Abstract
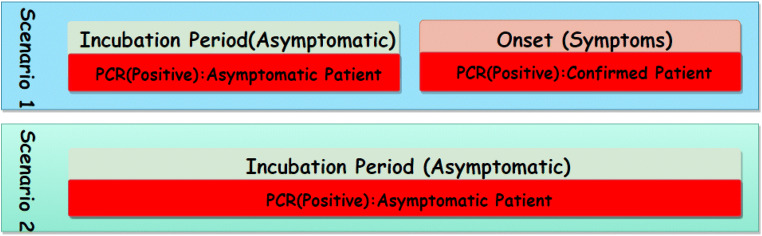
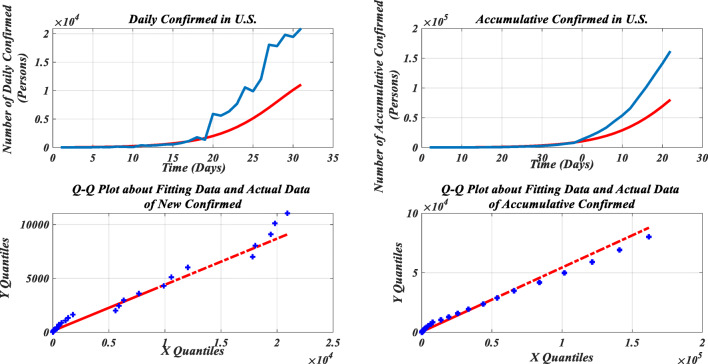
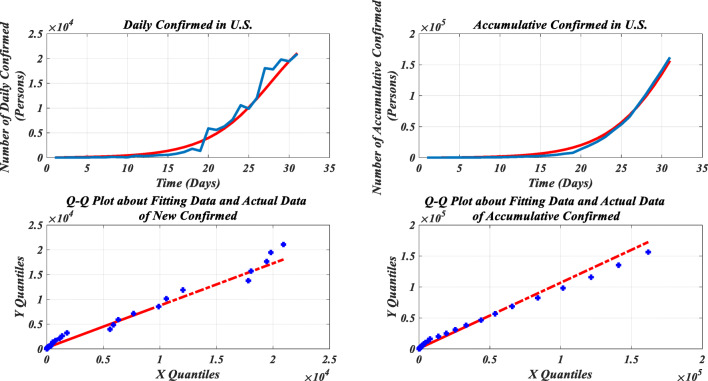
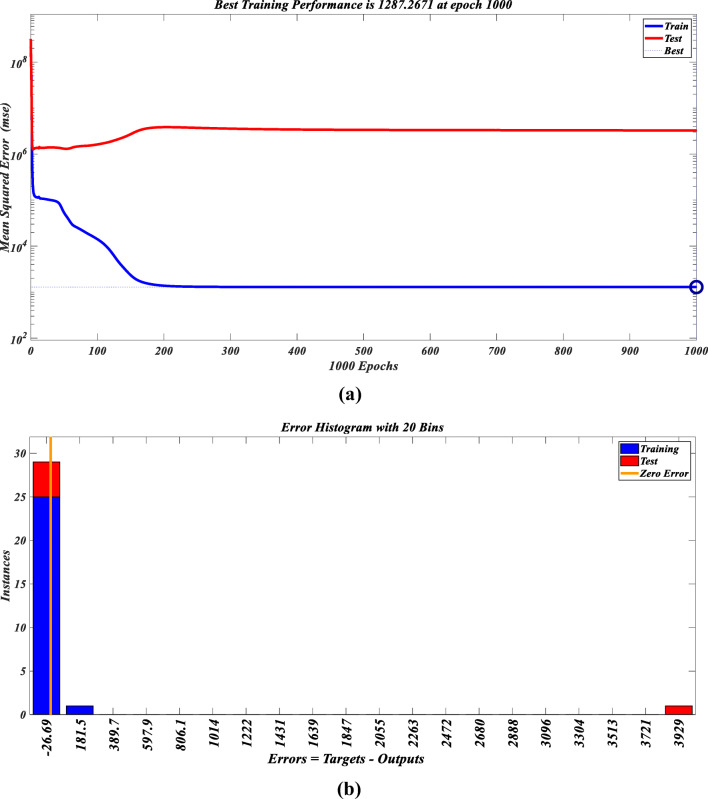
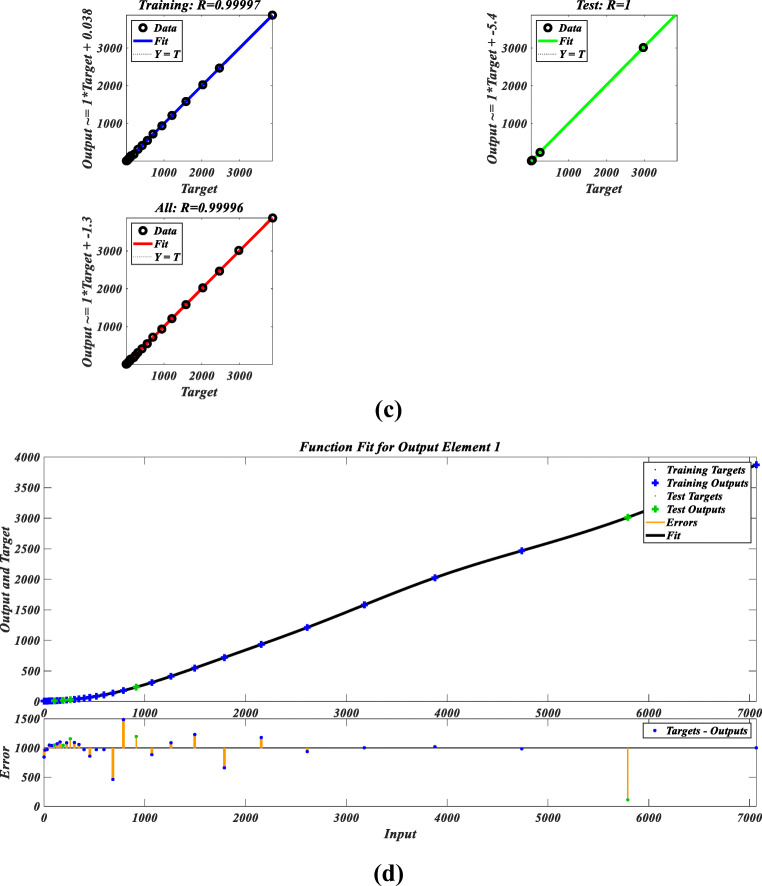
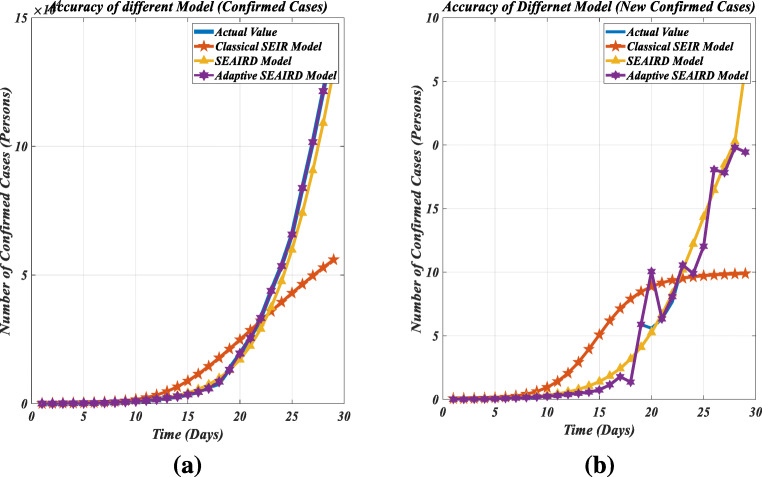
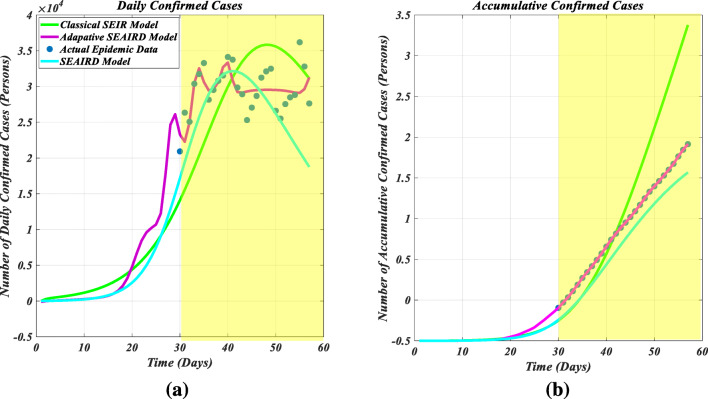
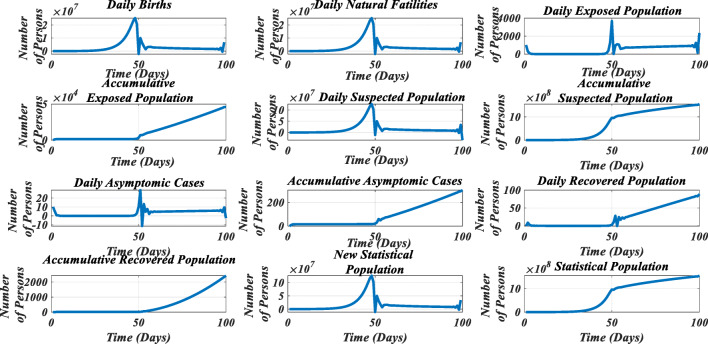
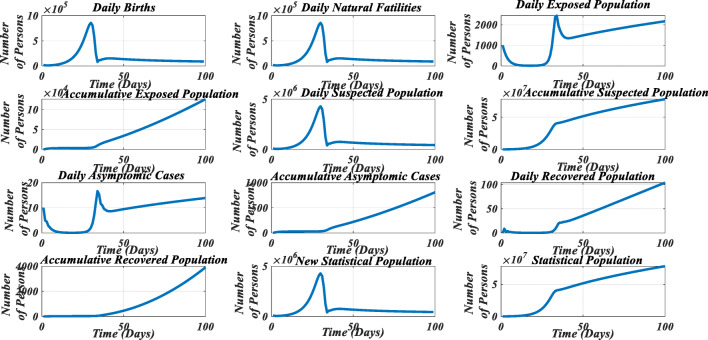
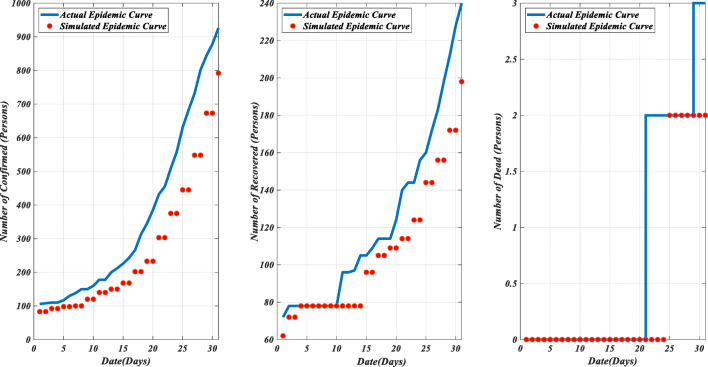
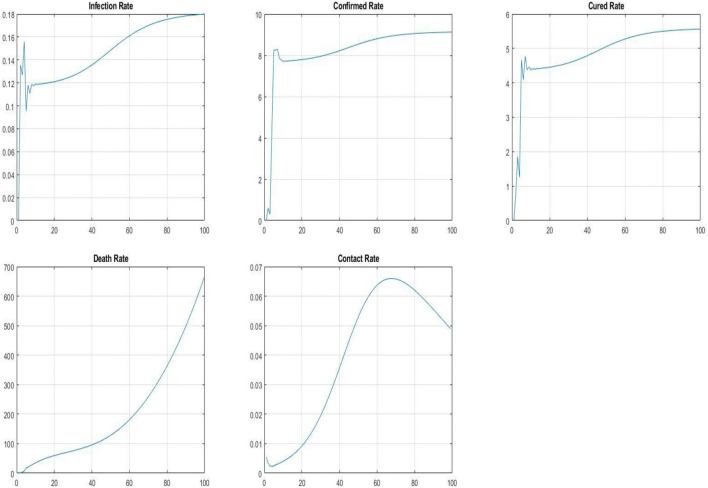
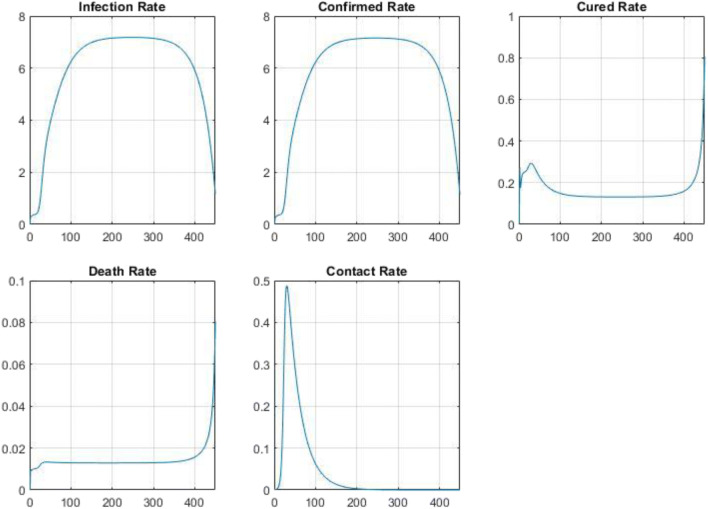
Measuring the spread of disease during a pandemic is critically important for accurately and promptly applying various lockdown strategies, so to prevent the collapse of the medical system. The latest pandemic of COVID-19 that hits the world death tolls and economy loss very hard, is more complex and contagious than its precedent diseases. The complexity comes mostly from the emergence of asymptomatic patients and relapse of the recovered patients which were not commonly seen during SARS outbreaks. These new characteristics pertaining to COVID-19 were only discovered lately, adding a level of uncertainty to the traditional SEIR models. The contribution of this paper is that for the COVID-19 epidemic, which is infectious in both the incubation period and the onset period, we use neural networks to learn from the actual data of the epidemic to obtain optimal parameters, thereby establishing a nonlinear, self-adaptive dynamic coefficient infectious disease prediction model. On the basis of prediction, we considered control measures and simulated the effects of different control measures and different strengths of the control measures. The epidemic control is predicted as a continuous change process, and the epidemic development and control are integrated to simulate and forecast. Decision-making departments make optimal choices. The improved model is applied to simulate the COVID-19 epidemic in the United States, and by comparing the prediction results with the traditional SEIR model, SEAIRD model and adaptive SEAIRD model, it is found that the adaptive SEAIRD model's prediction results of the U.S. COVID-19 epidemic data are in good agreement with the actual epidemic curve. For example, from the prediction effect of these 3 different models on accumulative confirmed cases, in terms of goodness of fit, adaptive SEAIRD model (0.99997) ≈ SEAIRD model (0.98548) > Classical SEIR model (0.66837); in terms of error value: adaptive SEAIRD model (198.6563) < < SEAIRD model(4739.8577) < < Classical SEIR model (22,652.796); The objective of this contribution is mainly on extending the current spread prediction model. It incorporates extra compartments accounting for the new features of COVID-19, and fine-tunes the new model with neural network, in a bid of achieving a higher level of prediction accuracy. Based on the SEIR model of disease transmission, an adaptive model called SEAIRD with internal source and isolation intervention is proposed. It simulates the effects of the changing behaviour of the SARS-CoV-2 in U.S. Neural network is applied to achieve a better fit in SEAIRD. Unlike the SEIR model, the adaptive SEAIRD model embraces multi-group dynamics which lead to different evolutionary trends during the epidemic. Through the risk assessment indicators of the adaptive SEAIRD model, it is convenient to measure the severity of the epidemic situation for consideration of different preventive measures. Future scenarios are projected from the trends of various indicators by running the adaptive SEAIRD model.
Keywords: Asymptomatic cases; COVID-19; Disease transmission; Enhanced surveillance; Interventions; Novel coronavirus; Risk assessment; SEAIRD; SEIR; Severity.
© Springer Science+Business Media, LLC, part of Springer Nature 2021.
Figures
Similar articles
-
Effectiveness of a scenario-based, community-based intervention in containing COVID-19 in China.Front Public Health. 2024 Nov 27;12:1449305. doi: 10.3389/fpubh.2024.1449305. eCollection 2024. Front Public Health. 2024. PMID: 39664544 Free PMC article.
-
Neural-SEIR: A flexible data-driven framework for precise prediction of epidemic disease.Math Biosci Eng. 2023 Aug 23;20(9):16807-16823. doi: 10.3934/mbe.2023749. Math Biosci Eng. 2023. PMID: 37920035
-
A Simulation of a COVID-19 Epidemic Based on a Deterministic SEIR Model.Front Public Health. 2020 May 28;8:230. doi: 10.3389/fpubh.2020.00230. eCollection 2020. Front Public Health. 2020. PMID: 32574303 Free PMC article.
-
Compartmental structures used in modeling COVID-19: a scoping review.Infect Dis Poverty. 2022 Jun 21;11(1):72. doi: 10.1186/s40249-022-01001-y. Infect Dis Poverty. 2022. PMID: 35729655 Free PMC article.
-
Transmission dynamics model and the coronavirus disease 2019 epidemic: applications and challenges.Med Rev (2021). 2022 Feb 28;2(1):89-109. doi: 10.1515/mr-2021-0022. eCollection 2022 Feb 1. Med Rev (2021). 2022. PMID: 35658113 Free PMC article. Review.
Cited by
-
Forecasting and modeling of the COVID-19 pandemic in the USA with a timed intervention model.Sci Rep. 2022 Mar 14;12(1):4339. doi: 10.1038/s41598-022-07487-8. Sci Rep. 2022. PMID: 35288588 Free PMC article.
-
How limitations in energy access, poverty, and socioeconomic disparities compromise health interventions for outbreaks in urban settings.iScience. 2021 Dec 17;24(12):103389. doi: 10.1016/j.isci.2021.103389. Epub 2021 Nov 1. iScience. 2021. PMID: 34746688 Free PMC article.
-
Propagation Analysis of COVID-19: An SIR Model-Based Investigation of the Pandemic.Arab J Sci Eng. 2021 Aug 10:1-13. doi: 10.1007/s13369-021-05904-0. Online ahead of print. Arab J Sci Eng. 2021. PMID: 34395158 Free PMC article.
-
Spatial Interaction Analysis of Infectious Disease Import and Export between Regions.Int J Environ Res Public Health. 2024 May 18;21(5):643. doi: 10.3390/ijerph21050643. Int J Environ Res Public Health. 2024. PMID: 38791857 Free PMC article.
-
Study on the impact of COVID-19 epidemic and agent disease risk simulation model based on individual factors in Xi'an City.Front Cell Infect Microbiol. 2025 May 13;15:1547601. doi: 10.3389/fcimb.2025.1547601. eCollection 2025. Front Cell Infect Microbiol. 2025. PMID: 40433669 Free PMC article.
References
-
- Musinguzi G, Asamoah BO. The Science of Social Distancing and Total Lock Down: Does it Work? Whom does it Benefit? Electronic Journal of General Medicine. 2020;17(6):em230. doi: 10.29333/ejgm/7895. - DOI
-
- Harko T, Lobo FSN, Mak MK. Exact analytical solutions of the susceptible-infected-recovered (SIR) epidemic model and of the SIR model with equal death and birth rates. Appl Math Comput. 2014;236:184–194.
-
- Cliff, A.; Smallman-Raynor, M. (2013). “Oxford Textbook of Infectious Disease Control: A Geographical Analysis from Medieval Quarantine to Global Eradication”. Oxford University Press. pp. 125-36. ISBN 978-0199596614
-
- William Booth (2020). “A tale of two epidemics: scientists in Sweden and Britain fight over who took the right public health path”, Washington Post, May 9
LinkOut - more resources
Full Text Sources
Miscellaneous