. 2021 Oct 16:32:6-14.
doi: 10.1016/j.ctro.2021.10.003. eCollection 2022 Jan.

Evaluation of deep learning-based multiparametric MRI oropharyngeal primary tumor auto-segmentation and investigation of input channel effects: Results from a prospective imaging registry

Affiliations

Evaluation of deep learning-based multiparametric MRI oropharyngeal primary tumor auto-segmentation and investigation of input channel effects: Results from a prospective imaging registry

Kareem A Wahid et al. Clin Transl Radiat Oncol. .

Abstract

Background/purpose: Oropharyngeal cancer (OPC) primary gross tumor volume (GTVp) segmentation is crucial for radiotherapy. Multiparametric MRI (mpMRI) is increasingly used for OPC adaptive radiotherapy but relies on manual segmentation. Therefore, we constructed mpMRI deep learning (DL) OPC GTVp auto-segmentation models and determined the impact of input channels on segmentation performance.

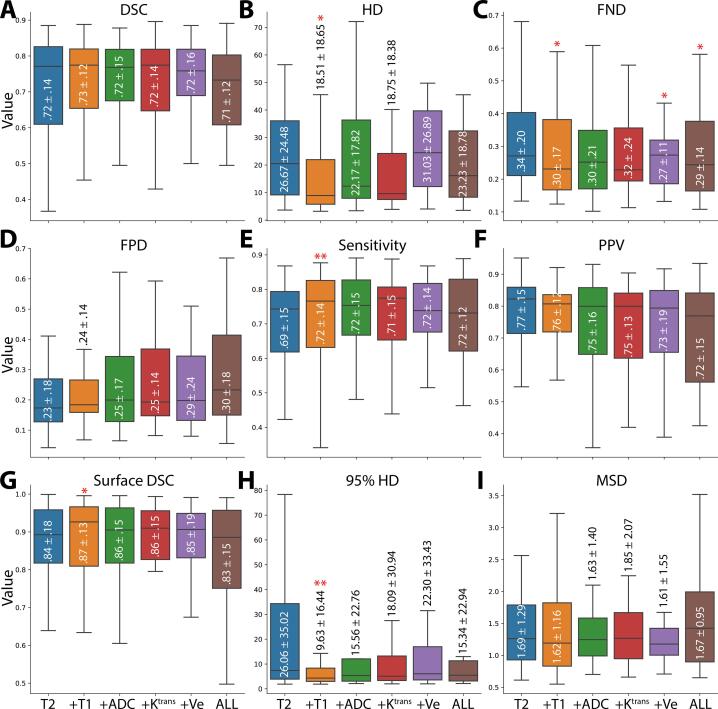
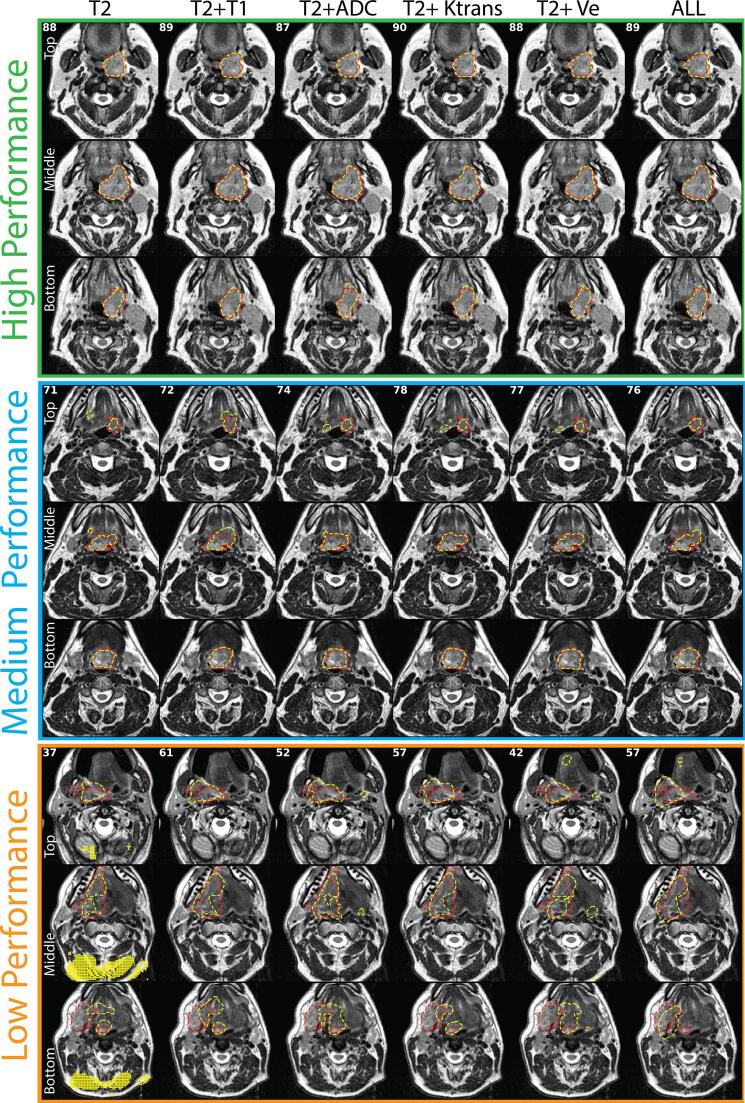
Materials/methods: GTVp ground truth segmentations were manually generated for 30 OPC patients from a clinical trial. We evaluated five mpMRI input channels (T2, T1, ADC, Ktrans, Ve). 3D Residual U-net models were developed and assessed using leave-one-out cross-validation. A baseline T2 model was compared to mpMRI models (T2 + T1, T2 + ADC, T2 + Ktrans, T2 + Ve, all five channels [ALL]) primarily using the Dice similarity coefficient (DSC). False-negative DSC (FND), false-positive DSC, sensitivity, positive predictive value, surface DSC, Hausdorff distance (HD), 95% HD, and mean surface distance were also assessed. For the best model, ground truth and DL-generated segmentations were compared through a blinded Turing test using three physician observers.

Results: Models yielded mean DSCs from 0.71 ± 0.12 (ALL) to 0.73 ± 0.12 (T2 + T1). Compared to the T2 model, performance was significantly improved for FND, sensitivity, surface DSC, HD, and 95% HD for the T2 + T1 model (p < 0.05) and for FND for the T2 + Ve and ALL models (p < 0.05). No model demonstrated significant correlations between tumor size and DSC (p > 0.05). Most models demonstrated significant correlations between tumor size and HD or Surface DSC (p < 0.05), except those that included ADC or Ve as input channels (p > 0.05). On average, there were no significant differences between ground truth and DL-generated segmentations for all observers (p > 0.05).

Conclusion: DL using mpMRI provides reasonably accurate segmentations of OPC GTVp that may be comparable to ground truth segmentations generated by clinical experts. Incorporating additional mpMRI channels may increase the performance of FND, sensitivity, surface DSC, HD, and 95% HD, and improve model robustness to tumor size.


Conflict of interest statement

The authors declare that they have no known competing financial interests or personal relationships that could have appeared to influence the work reported in this paper.

Figures

Fig. 1
Fig. 1
Annotation, processing, and analysis of data used in this study. (A) Multiparametric MRI input channels for oropharyngeal tumor segmentation. The white dotted line depicts the primary gross tumor volume segmentation. Anatomical sequence images are outlined in grey boxes, while functional sequence parametric map images are outlined in red boxes. (B) Image processing steps which included image cropping, resampling, and rescaling. (C) An illustration of the 3D Residual U-net model architecture. For illustrative purposes, only one input channel (T2-weighted image) is shown, but multiple input channel combinations were used throughout the analysis as separate models. (D) Overall study design which incorporated multi-channel input combinations coupled to a leave-one-out cross-validation (LOOCV) evaluation approach. T2 = T2-weighted MRI, T1 = T1-weighted MRI, ADC = apparent diffusion coefficient, Ktrans = volume transfer constant, Ve = extravascular extracellular volume fraction, ALL = all five input channels. BN = Batch normalization, PReLU = parametric rectified linear unit activation function. (For interpretation of the references to colour in this figure legend, the reader is referred to the web version of this article.)
Fig. 2
Fig. 2
Boxplots comparing evaluation metrics of models built with different input channels. Evaluation metrics correspond to Dice similarity coefficient (DSC) (A), Hausdorff distance (HD) (B), false-negative DSC (FND) (C), false-positive DSC (FPD) (D), sensitivity (E), positive predictive value (PPV) (F), surface DSC (G), 95% HD (H), and mean surface distance (MSD) (I). Boxes show quartiles and median lines, while whiskers extend to the remaining distribution. Mean ± standard deviation is shown inside or adjacent to the corresponding box. The single and double stars above the boxplots correspond to significantly lower or higher values, respectively, compared to the baseline model for that metric. T2 = T2-weighted MRI, T1 = T1-weighted MRI, ADC = apparent diffusion coefficient, Ktrans = volume transfer constant, Ve = extravascular extracellular volume fraction, ALL = all five input channels.
Fig. 3
Fig. 3
2D axial slice representations of ground truth segmentations (red dotted outline) and predicted segmentations (yellow dotted outline) for high- (green), medium- (blue), and low- (orange) performance cases. Slices for each case are shown in rows superiorly to inferiorly (top, middle, and bottom). Models are shown in columns. The DSC scores for corresponding models are shown in the top left corners. The high-performance case corresponds to a left tonsillar T4 tumor. The medium-performance case corresponds to a left base of tongue T4 tumor. The low-performance case corresponds to a right base of tongue T4 tumor. T2 = T2-weighted MRI, T1 = T1-weighted MRI, ADC = apparent diffusion coefficient, Ktrans = volume transfer constant, Ve = extravascular extracellular volume fraction, ALL = all five input channels. (For interpretation of the references to colour in this figure legend, the reader is referred to the web version of this article.)
Fig. 4
Fig. 4
Dependence of tumor size on the Dice Similarity Coefficient (DSC) (A), Hausdorff Distance (HD) (B), and surface DSC (C), for various input channel models. T2 = T2-weighted MRI, T1 = T1-weighted MRI, ADC = apparent diffusion coefficient, Ktrans = volume transfer constant, Ve = extravascular extracellular volume fraction, ALL = all five input channels.

References

    1. Bray F., Ferlay J., Soerjomataram I., Siegel R.L., Torre L.A., Jemal A. Global cancer statistics 2018: GLOBOCAN estimates of incidence and mortality worldwide for 36 cancers in 185 countries. CA Cancer J Clin. 2018;68:394–424. - PubMed
    1. De Felice F., Tombolini V., Valentini V., de Vincentiis M., Mezi S., Brugnoletti O. Advances in the Management of HPV-Related Oropharyngeal Cancer. J Oncol. 2019;2019:9173729. - PMC - PubMed
    1. Njeh C.F. Tumor delineation: The weakest link in the search for accuracy in radiotherapy. J Med Phys. 2008;33:136–140. - PMC - PubMed
    1. Njeh CF, Dong L, Orton CG. Point/Counterpoint. IGRT has limited clinical value due to lack of accurate tumor delineation. Med Phys 2013;40:040601. - PubMed
    1. Vorwerk H., Zink K., Schiller R., Budach V., Böhmer D., Kampfer S. Protection of quality and innovation in radiation oncology: The prospective multicenter trial the German Society of Radiation Oncology (DEGRO-QUIRO study) Strahlenther Onkol. 2014;190:433–443. doi: 10.1007/s00066-014-0634-0. - DOI - PubMed

LinkOut - more resources