

Estimating Intra-Urban Inequities in PM2.5-Attributable Health Impacts: A Case Study for Washington, DC
- PMID: 34765851
- PMCID: PMC8574205
- DOI: 10.1029/2021GH000431
Estimating Intra-Urban Inequities in PM2.5-Attributable Health Impacts: A Case Study for Washington, DC
Abstract
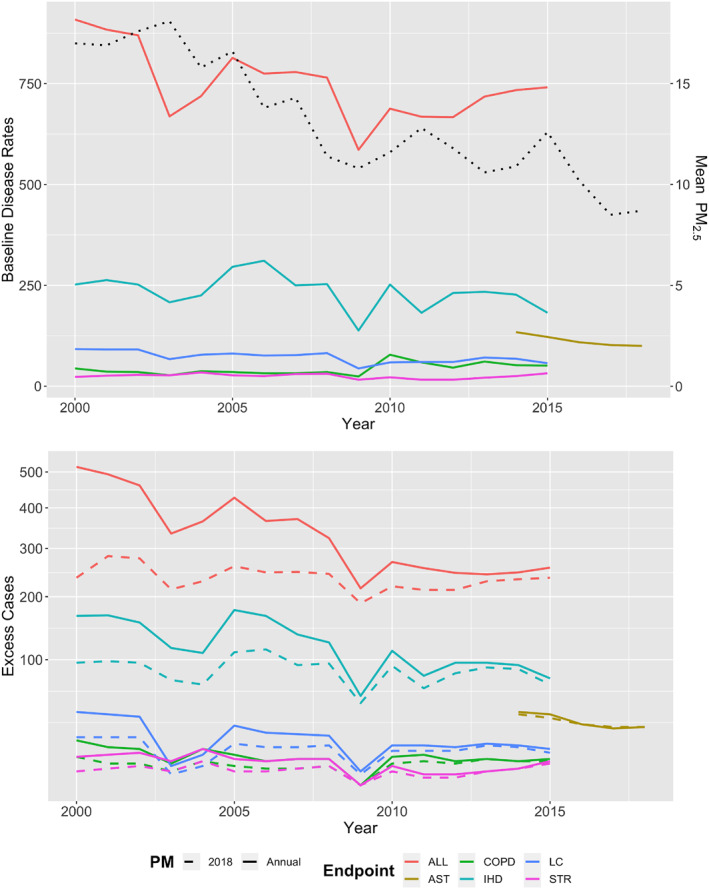
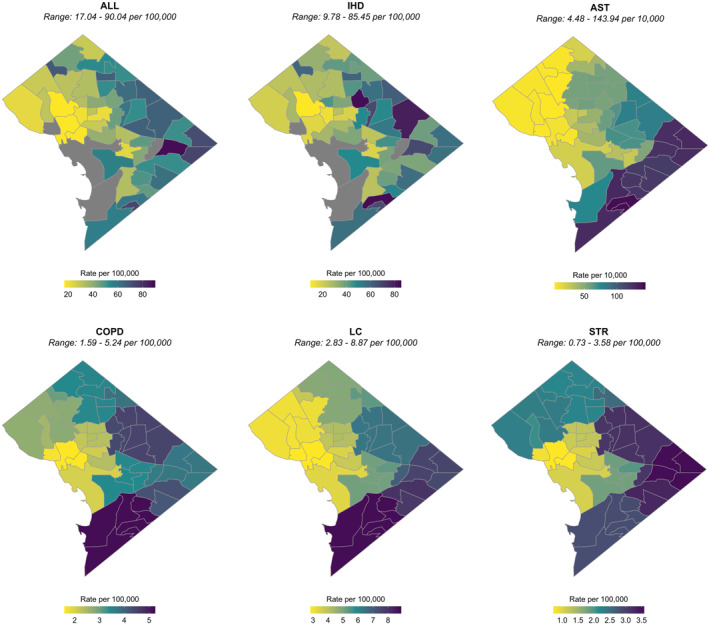
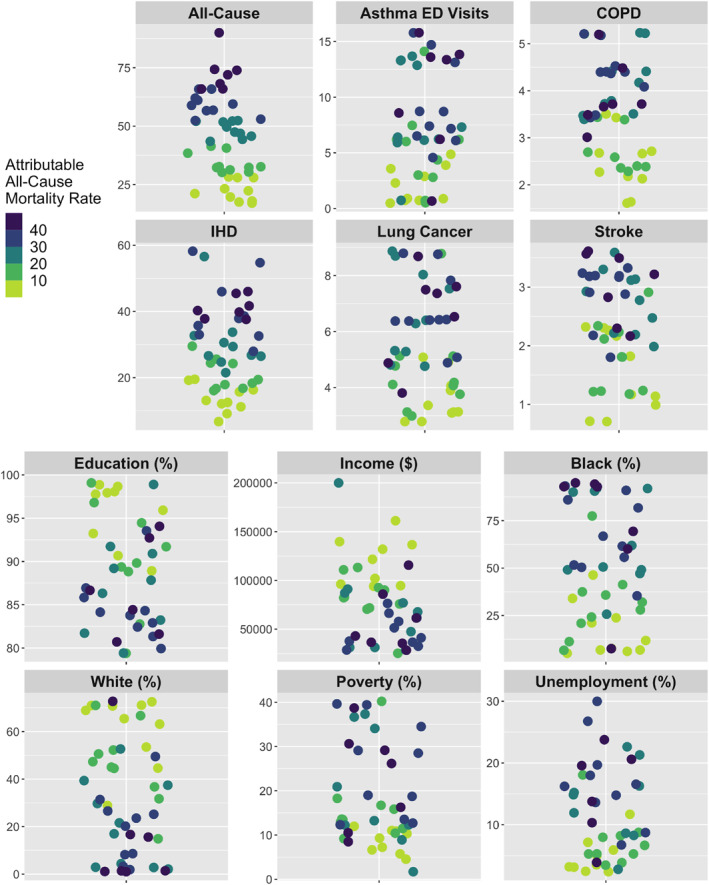
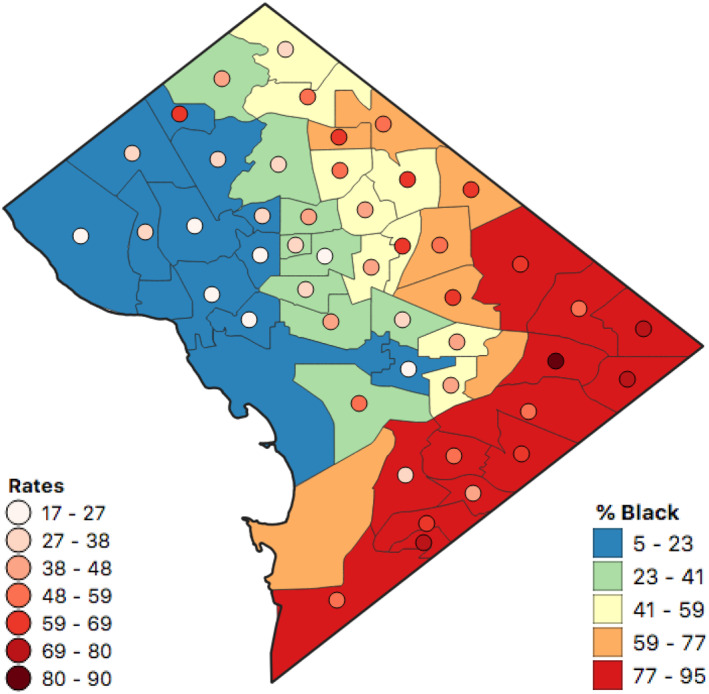
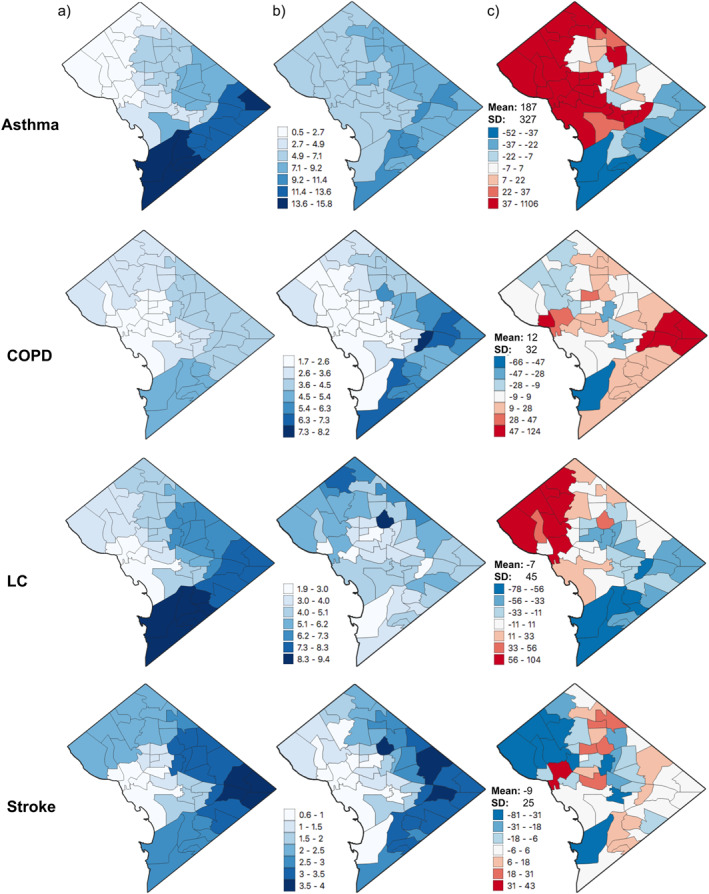
Air pollution levels are uneven within cities, contributing to persistent health disparities between neighborhoods and population sub-groups. Highly spatially resolved information on pollution levels and disease rates is necessary to characterize inequities in air pollution exposure and related health risks. We leverage recent advances in deriving surface pollution levels from satellite remote sensing and granular data in disease rates for one city, Washington, DC, to assess intra-urban heterogeneity in fine particulate matter (PM2.5)- attributable mortality and morbidity. We estimate PM2.5-attributable cases of all-cause mortality, chronic obstructive pulmonary disease, ischemic heart disease, lung cancer, stroke, and asthma emergency department (ED) visits using epidemiologically derived health impact functions. Data inputs include satellite-derived annual mean surface PM2.5 concentrations; age-resolved population estimates; and statistical neighborhood-, zip code- and ward-scale disease counts. We find that PM2.5 concentrations and associated health burdens have decreased in DC between 2000 and 2018, from approximately 240 to 120 cause-specific deaths and from 40 to 30 asthma ED visits per year (between 2014 and 2018). However, remaining PM2.5-attributable health risks are unevenly and inequitably distributed across the District. Higher PM2.5-attributable disease burdens were found in neighborhoods with larger proportions of people of color, lower household income, and lower educational attainment. Our study adds to the growing body of literature documenting the inequity in air pollution exposure levels and pollution health risks between population sub-groups, and highlights the need for both high-resolution disease rates and concentration estimates for understanding intra-urban disparities in air pollution-related health risks.
Keywords: PM2.5‐attributable health impacts; environmental justice; fine particulate matter; health inequities; intra‐urban baseline disease rates; intra‐urban health risks.
© 2021 The Authors. GeoHealth published by Wiley Periodicals LLC on behalf of American Geophysical Union.
Conflict of interest statement
The authors declare no conflicts of interest relevant to this study.
Figures
References
-
- Alexeeff, S. E. , Roy, A. , Shan, J. , Liu, X. , Messier, K. , Apte, J. S. , et al. (2018). High‐resolution mapping of traffic related air pollution with Google street view cars and incidence of cardiovascular events within neighborhoods in Oakland, CA. Environmental Health, 17(1), 38. 10.1186/s12940-018-0382-1 - DOI - PMC - PubMed
-
- Anenberg, S. C. , Horowitz, L. W. , Tong, D. Q. , & West, J. J. (2010). An estimate of the global burden of anthropogenic ozone and fine particulate matter on premature human mortality using atmospheric modeling. Environmental Health Perspectives, 118(9), 1189–1195. 10.1289/ehp.0901220 - DOI - PMC - PubMed
-
- Anenberg, S. C. , Schwartz, J. , Shindell, D. , Amann, M. , Faluvegi, G. , Klimont, Z. , et al. (2012). Global air quality and health co‐benefits of mitigating near‐term climate change through methane and black carbon emission controls. Environmental Health Perspectives, 120(6), 831–839. 10.1289/ehp.1104301 - DOI - PMC - PubMed
LinkOut - more resources
Full Text Sources