. 2021 Nov 1;2(4):100899.
doi: 10.1016/j.xpro.2021.100899. eCollection 2021 Dec 17.

A low-cost and open-source protocol to produce key enzymes for molecular detection assays

Affiliations

A low-cost and open-source protocol to produce key enzymes for molecular detection assays

Gabriel Mendoza-Rojas et al. STAR Protoc. .

Abstract

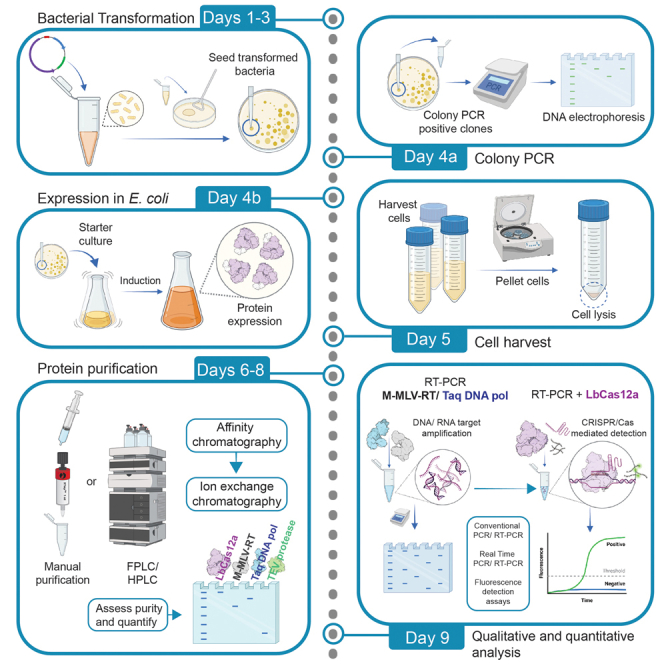
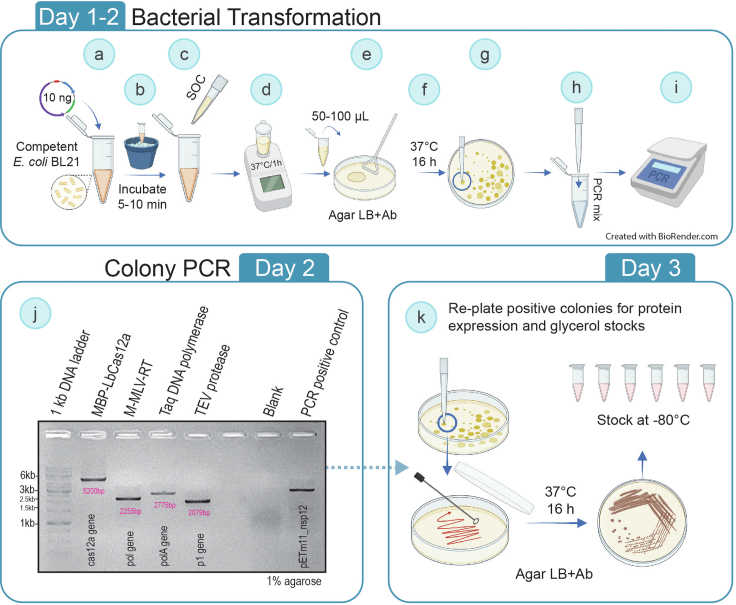
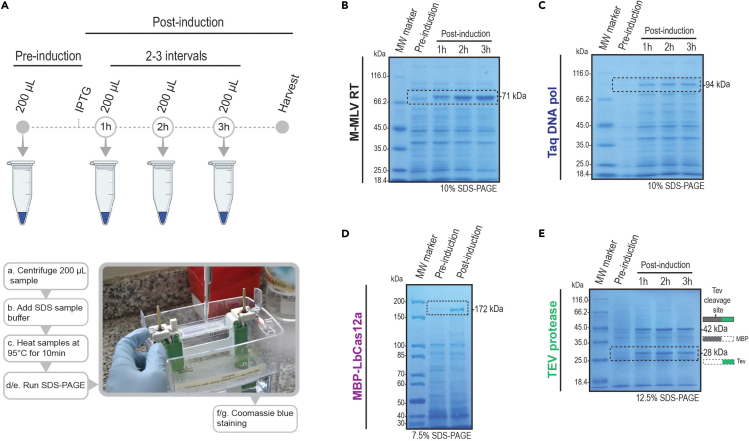
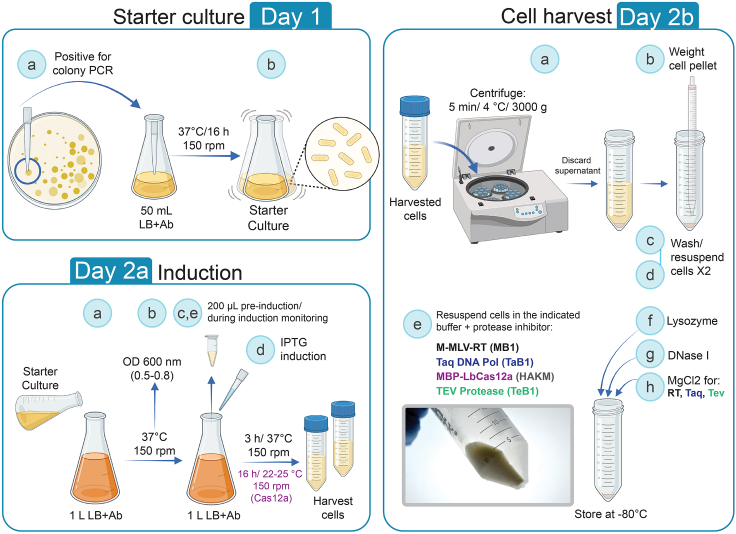
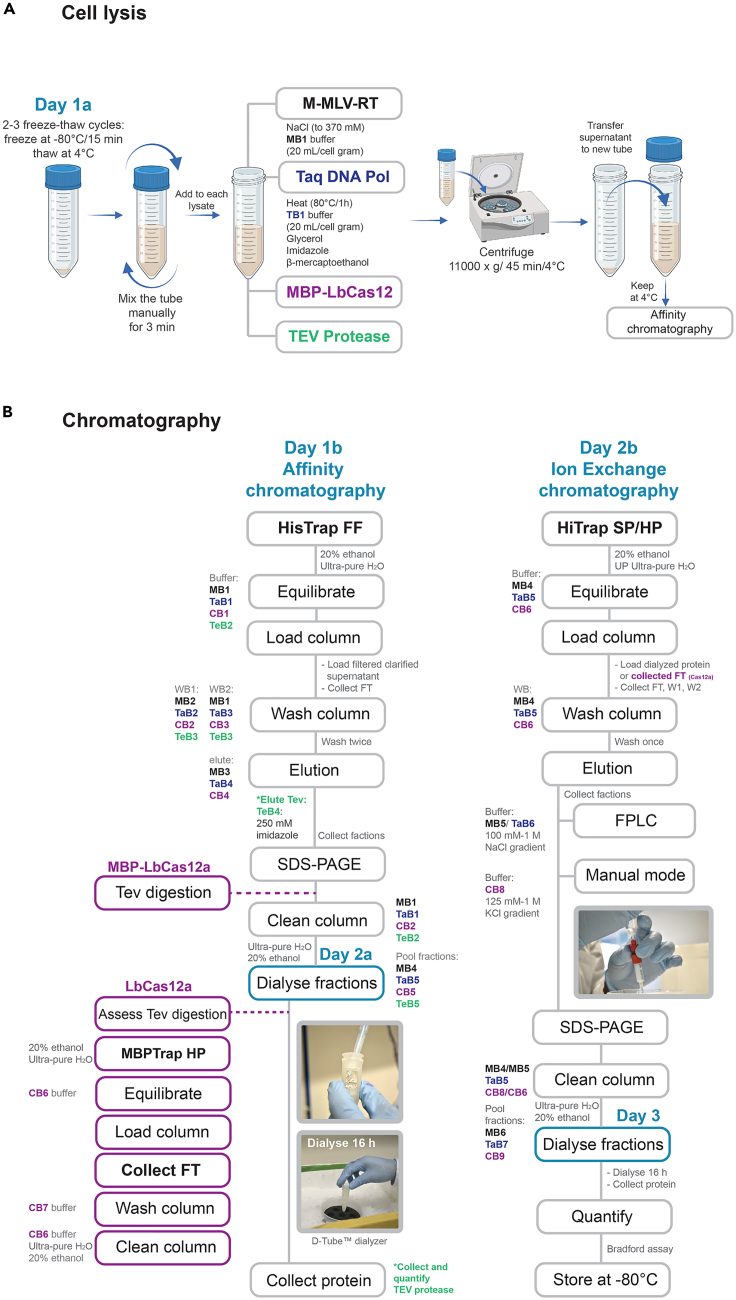
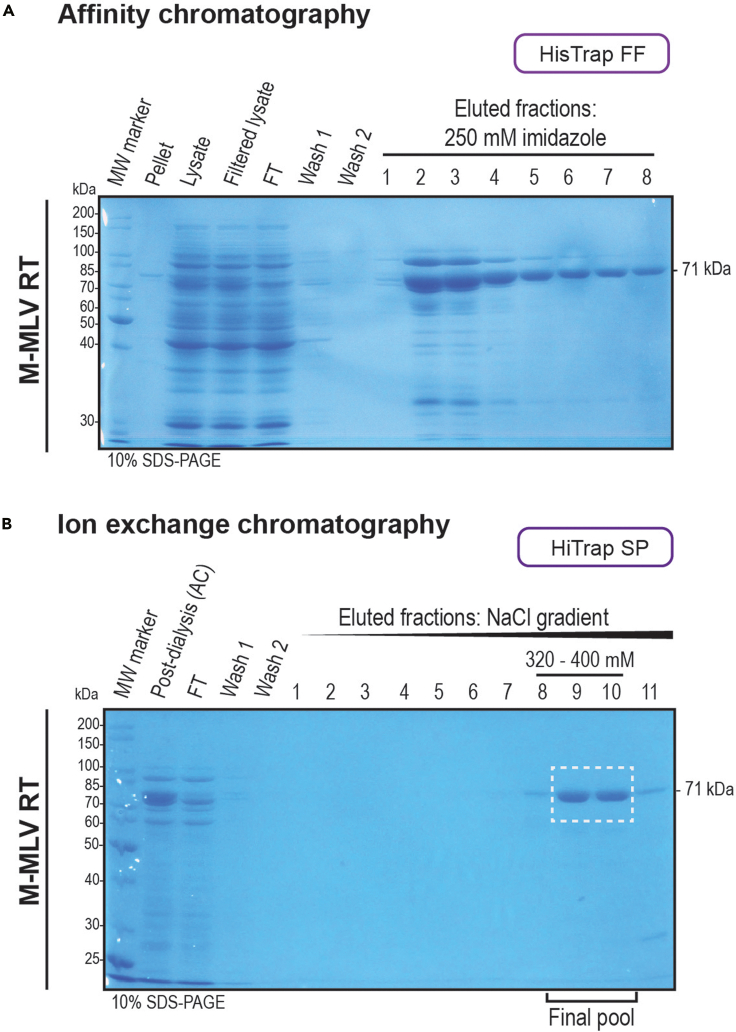
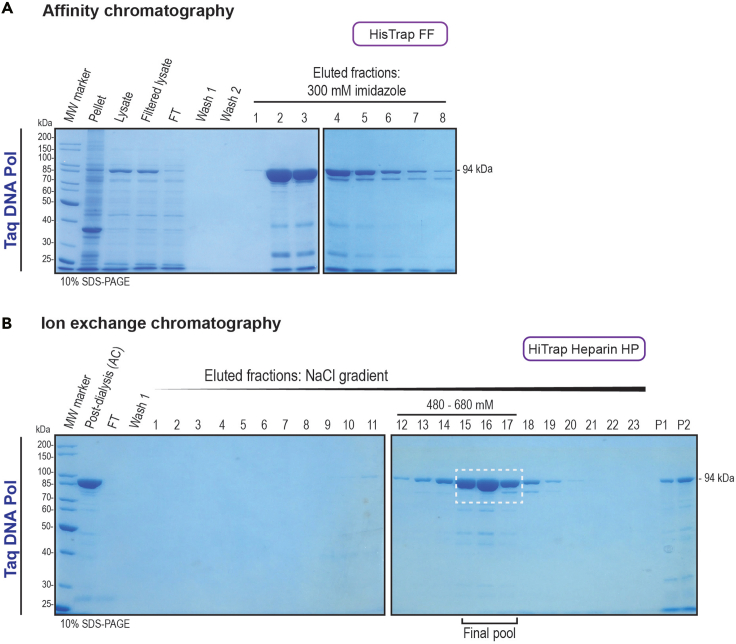
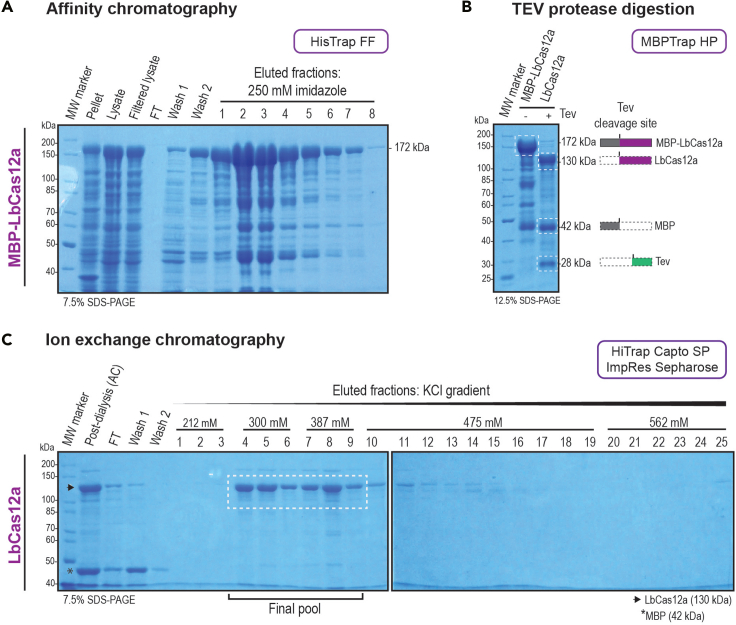
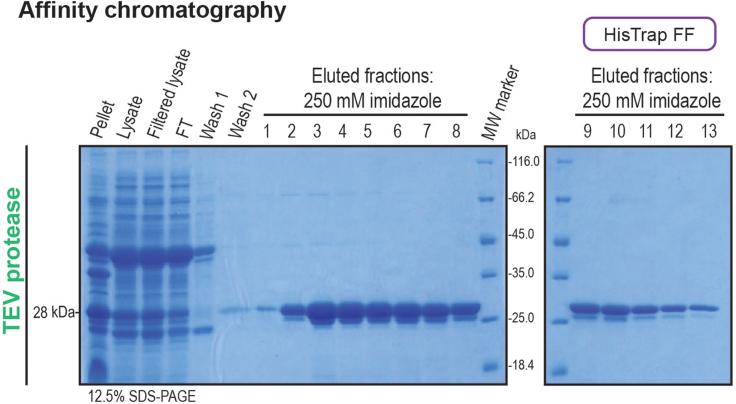
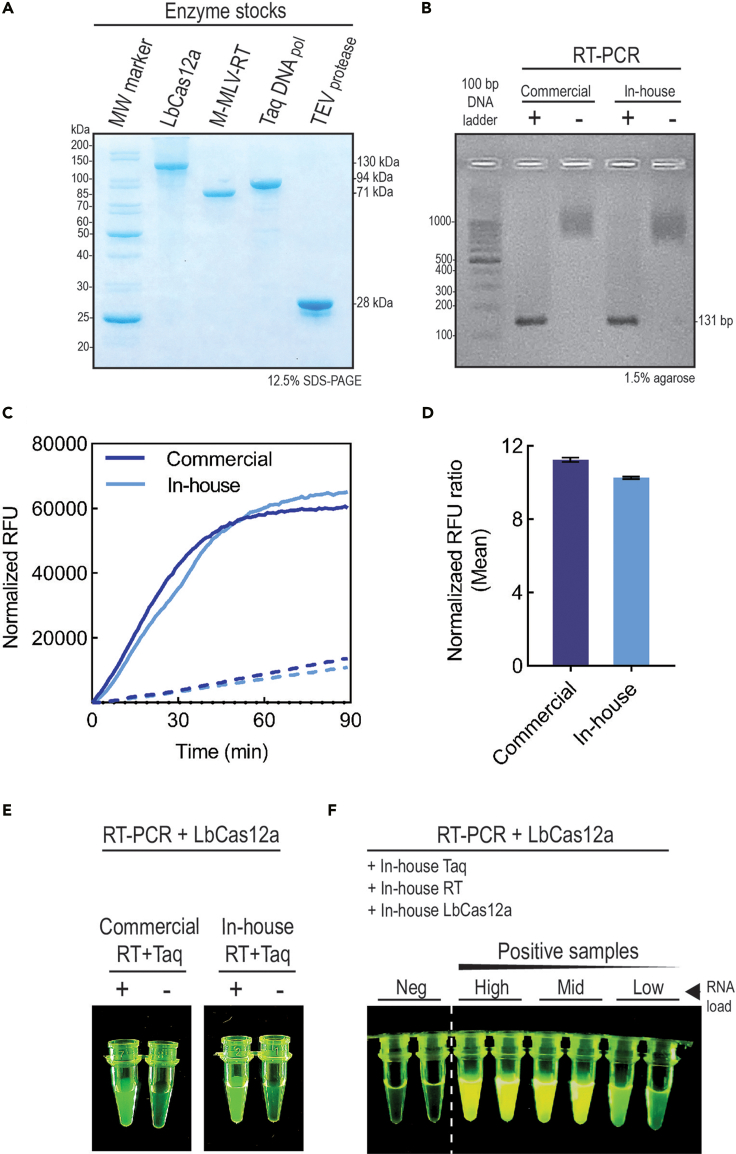
Here, we describe a detailed step-by-step protocol for the expression, purification, quantification, and activity determination of key enzymes for molecular detection of pathogens. Based on previous reports, we optimized the protocol for LbCas12a, Taq DNA polymerase, M-MLV reverse transcriptase, and TEV protease to make it compatible with minimal laboratory equipment, broadly available in low- and middle-income countries. The enzymes produced with this protocol have been successfully used for molecular detection applications. For complete details on the use and execution of this protocol, please refer to Alcántara et al. (2021a, 2021b).

Keywords: Biotechnology and bioengineering; CRISPR; Health Sciences; Microbiology; Molecular Biology; Protein Biochemistry; Protein expression and purification.


Conflict of interest statement

The authors declare no competing interests.

Figures

None
Graphical abstract
Figure 1
Figure 1
Transformation and screening of bacterial colonies for protein expression in E. coli The scheme summarizes all steps to obtain and verify by colony PCR the transformed BL21 E. coli cells that express the key molecular biology enzymes Taq DNA Polymerase, M-MLV Reverse Transcriptase, and LbCas12a. Additionally, BL21 cells obtained from Addgene and carrying the plasmid encoding the TEV protease were checked by colony PCR. The TEV protease is required to cleave LbCas12a from the expressing fusion protein MBP-LbCas12a. Ab: antibiotic.
Figure 3
Figure 3
Analysis of protein expression by SDS-PAGE (A) The workflow shows the sample collection from pre-induction to up to 3 intervals of post-induction. Cells collected from 200 μL aliquots were lysed and the cell lysates were analyzed by SDS-PAGE gel electrophoresis. Proteins were visualized by Coomassie blue staining. Stained acrylamide gels show M-MLV RT (B), Taq DNA polymerase (C), MBP-LbCas12a fusion protein (D), and the TEV protease (E). The bands corresponding to each protein molecular weight are highlighted by a dotted-stroke box, showing increased band intensity from pre- to post-induction samples. Due to the presence of the auto-cleavage site, two different molecular weight bands are observed on (E), corresponding to the MBP tag protein and TEV protease. The SDS-PAGE gel percentage used is shown in the bottom right corner of the gel picture.
Figure 2
Figure 2
Protein expression workflow in E. coli
Figure 4
Figure 4
Cell lysis and protein purification (A) The workflow summarizes the most important steps of the cell lysis on the first part of day 1 (Day 1a). Each protein and the corresponding buffers have been allocated a specific color: M-MLV-RT (black), Taq DNA polymerase (blue), MBP-LbCas12a (purple) and TEV protease (green). (B) The top-to-bottom scheme is divided into affinity (Day 1b) and ion exchange chromatography (Day 2b). Each protein and the corresponding buffers have been colored as in (A). A right-sided, purple-colored scheme has been included for MBP-LbCas12a representing the extra steps required for its purification. Extra steps for TEV protease purification have been highlighted in green. The days and the processes including day transitions are shown in light blue.
Figure 5
Figure 5
Purification of M-MLV reverse transcriptase (RT) HisTrap FF and HiTrap SP columns were used for affinity and ion-exchange chromatography, respectively. (A) The samples collected for cell lysis monitoring, the column post-loading flow-through (FT) and the washes, together with the main fractions obtained from affinity chromatography (AC) were analyzed by 10% SDS-PAGE gel electrophoresis and visualized by Coomassie blue staining. (B) The post-dialysis samples from AC, the FT and the washes, together with the obtained fractions from the buffer salt concentration gradient obtained from ion-exchange chromatography (IEC) were analyzed as in (A). The salt concentrations at which the protein eluted are shown. The white dotted-stroke box shows the fractions selected and pooled for dialysis. The molecular weight of the protein is shown in the right and the SDS-PAGE gel percentage used is shown in the bottom left corners of the gel pictures.
Figure 6
Figure 6
Purification of Taq DNA polymerase HisTrap FF and HiTrap Heparin HP columns were used for affinity and ion-exchange chromatography, respectively. (A) The samples collected for cell lysis monitoring, the column post-loading FT and the washes, together with the main fractions obtained from AC were analyzed by 10% SDS-PAGE gel electrophoresis and visualized by Coomassie blue staining. (B) The post-dialysis samples from AC, the FT and the washes, together with the obtained fractions from the buffer salt concentration gradient obtained from IEC were analyzed as in (A). The salt concentrations at which the protein eluted are shown. The white dotted-stroke box shows the fractions selected and pooled for dialysis. Protein precipitation was observed on AC post-dialysis pooled fractions (P1 and P2). The molecular weight of the protein is shown in the right and the SDS-PAGE gel percentage used is shown in the bottom corners of the gel pictures.
Figure 7
Figure 7
Affinity chromatography of MBP-LbCas12a, TEV digestion and purification of LbCas12a HisTrap FF and MBPTrap HP columns (A and B) were used for affinity chromatography and a HiTrap Capto SP ImpRes Sepharose column (C) for ion-exchange chromatography. (A) The samples collected for cell lysis monitoring, the column post-loading flow-through (FT) and the washes, together with the main fractions obtained from AC were analyzed by SDS-PAGE gel electrophoresis and visualized by Coomassie blue staining. (B) The post-dialysis pooled samples were digested with TEV protease and loaded into the MBPTrap HP column. The white top dotted-stroke boxes show the bands resulting from the (MBP)LbCas12a before and after TEV protease treatment; and the bottom ones show the 28 kDa and 42 kDa bands corresponding to the TEV protease and the MBP tag proteins, respectively. The pre- and post-cleavage molecular weights are shown in the right. (C) The post-dialysis samples from (B), the collected FT from (C) and the washes, together with the obtained fractions from the buffer salt concentration gradient obtained from IEC were analyzed as in (A). The salt concentrations at which the protein eluted are shown. The white dotted-stroke box shows the fractions selected and pooled for dialysis. The band corresponding to LbCas12a is marked with an arrow, while the MBP band is marked with a star symbol. The resulting molecular weights are on the right (A-B) and on the left corner (C) of the picture. The SDS-PAGE gel percentage used is shown in the bottom corners of the gel pictures.
Figure 8
Figure 8
Purification of TEV protease The HisTrap FF column was used for affinity chromatography. The samples collected for cell lysis monitoring, the column post-loading FT and the washes, together with the main fractions obtained from AC were analyzed by SDS-PAGE gel electrophoresis and visualized by Coomassie blue staining. The molecular weight of the TEV protease is shown in the left and the SDS-PAGE gel percentage used is shown in the bottom corner of the gel pictures.
Figure 9
Figure 9
Enzyme activity evaluation and quantitative and qualitative analysis A RT-PCR assay was performed to confirm that the Taq DNA polymerase and the M-MLV reverse transcriptase were in an active state. (A) Purified enzyme stocks were analyzed by SDS-PAGE gel electrophoresis and visualized by Coomassie blue staining. Average purity ranged between 90% and 99% for each enzyme. (B) RT-PCR reaction for functional enzyme confirmation. Results with commercial and in-house produced enzymes using a positive control (+) and a non-template negative control (-, NTC) were analyzed by 1.5% agarose gel electrophoresis and visualized with a blue light transilluminator. (C) CRISPR/Cas reaction for functional enzymes confirmation. The fluorescent target detection was based on the indicated RT-PCR products on (B). The dark and light blue lines represent the normalized fluorescence intensity (RFU) over time (min) of commercial and in-house LbCas12a proteins, respectively. The full lines represent the positive control reactions, while the dotted lines the negative NTC controls. The fluorescence was measured on a SynergyTM H1 Hybrid Multi-Mode plate reader (Biotek). (D) The bar graph shows the mean of the normalized fluorescence intensity ratio of the positive control over the NTC controls. The bars represent the mean of five measurements, and the error bars the standard deviation of the mean. Bar colors as on (C). (E) The CRISPR/Cas reaction was also assessed qualitatively by mixing the reaction mixture in a tube, without exposure to light for 30 min and visualization with a blue light transilluminator. (F) The same reaction and visualization method as in (E) was used for positive samples with different levels of SARS-CoV-2 RNA viral load. This panel has been elaborated from (Alcántara et al., 2021a)(Figure 5).

Comment in

Similar articles

Cited by

References

    1. Alcántara R., Peñaranda K., Mendoza G., Nakamoto J.A., Martins-Luna J., Valle J. del, Adaui V., Pohl M. Unlocking SARS-CoV-2 detection in low- and middle-income. Cell Rep. Methods. 2021 doi: 10.1016/j.crmeth.2021.100093. - DOI - PMC - PubMed
    1. Alcántara R., Peñaranda K., Mendoza-Rojas G., Nakamoto J.A., Dueñas E., Alvarez D., Adaui V., Milón P. UnCovid: a versatile, low-cost, and open-source protocol for SARS-CoV-2 RNA detection. STAR Protoc. 2021 doi: 10.1016/j.xpro.2021.100878. - DOI - PMC - PubMed
    1. Bradford M. A rapid and sensitive method for the quantitation of microgram quantities of protein utilizing the principle of protein-dye binding. Anal Biochem. 1976;72:248–254. - PubMed
    1. Chan W.-T., Verma C.S., Lane D.P., Gan S.K.-E. A comparison and optimization of methods and factors affecting the transformation of Escherichia coli. Biosci. Rep. 2013;33:e00086. - PMC - PubMed
    1. Chen J.S., Ma E., Harrington L.B., Costa M.D., Tian X., Palefsky J.M., Doudna J.A. CRISPR-Cas12a target binding unleashes indiscriminate single-stranded DNase activity. Science. 2018;360:eaar6245. - PMC - PubMed

Publication types

MeSH terms