. 2020 Jul 9;1(2):178-187.
doi: 10.1002/mco2.15. eCollection 2020 Sep.

De novo lipogenesis is elicited dramatically in human hepatocellular carcinoma especially in hepatitis C virus-induced hepatocellular carcinoma

Affiliations

De novo lipogenesis is elicited dramatically in human hepatocellular carcinoma especially in hepatitis C virus-induced hepatocellular carcinoma

Shaojian Li et al. MedComm (2020). .

Abstract

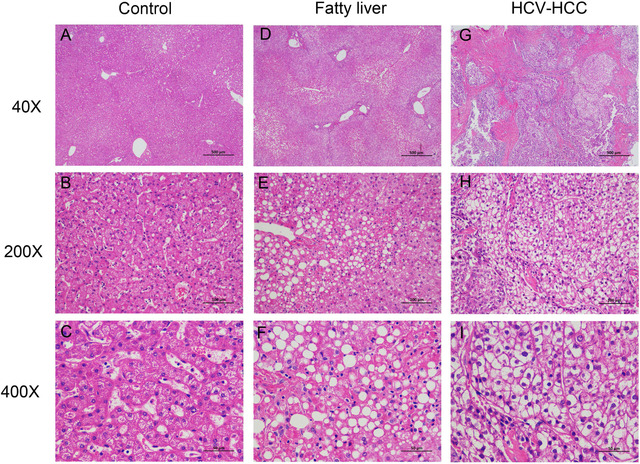
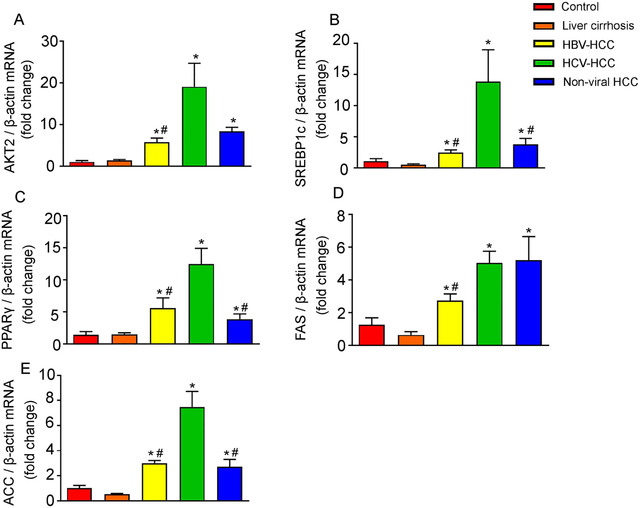
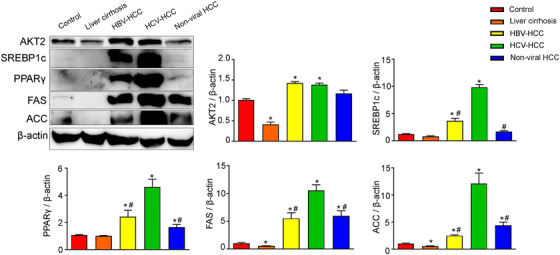
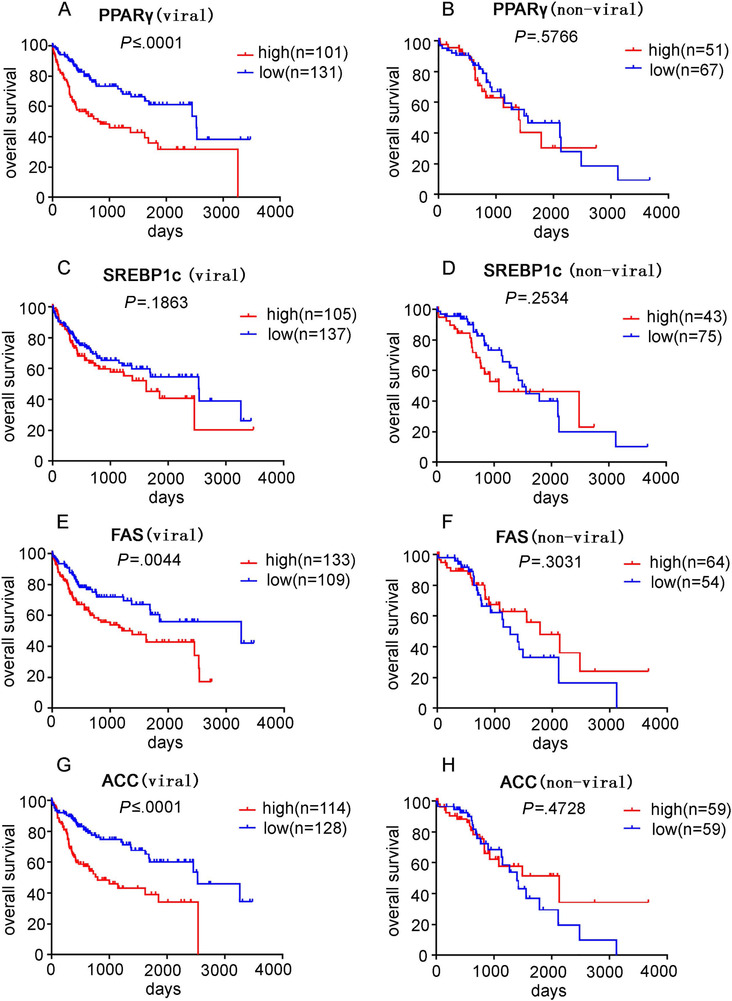
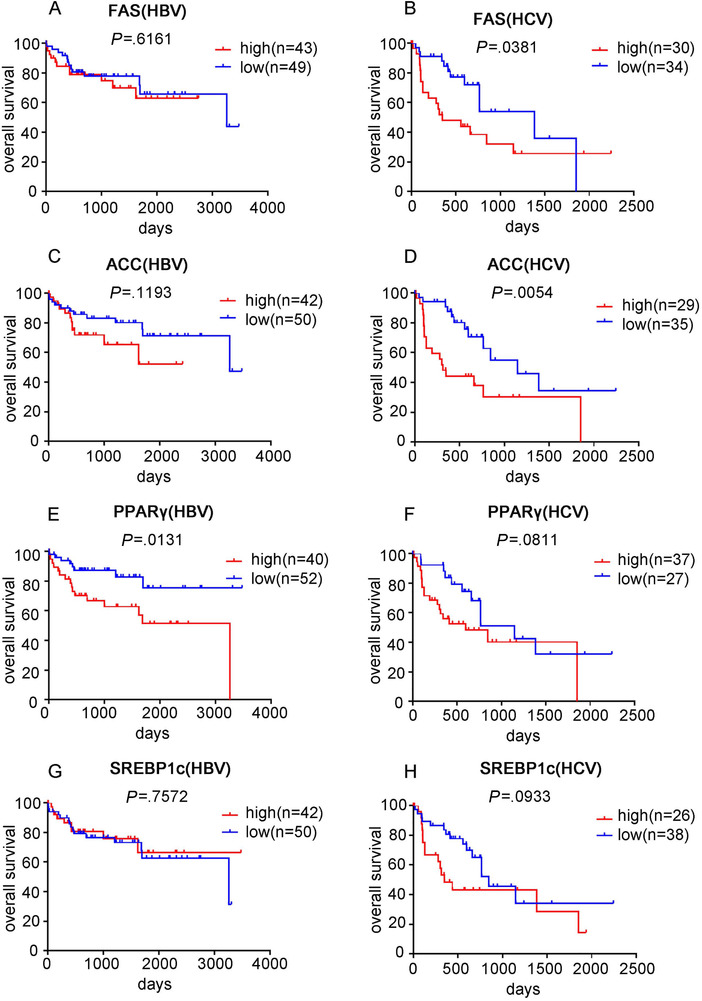
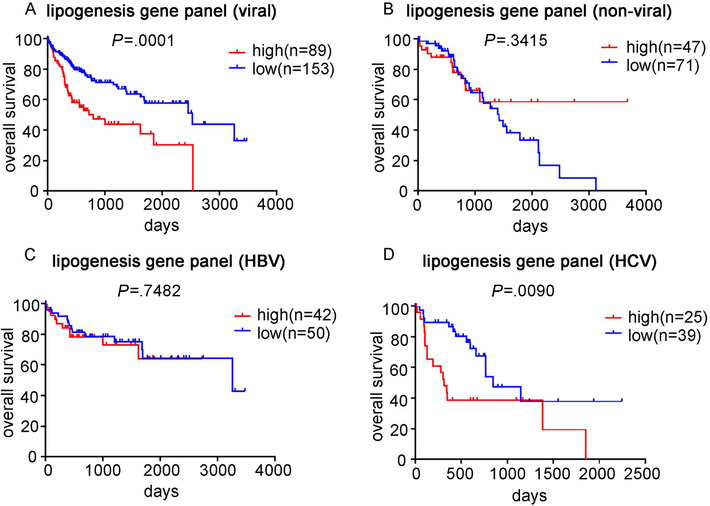
Hepatocellular carcinoma (HCC) is the third leading cause of cancer deaths worldwide. Abnormal de novo lipogenesis is reported to be involved in hepatocarcinogenesis. In current study, de novo lipogenesis and its association with patient survival rate were investigated in human HCC samples induced by hepatitis B virus (HBV), hepatitis C virus (HCV), or nonviral factors. Hepatic mRNA and protein levels of lipogenic transcription factors and lipid synthesis enzymes were examined by realtime-PCR (RT-PCR) and western blot. Association of gene expression and patient survival was analyzed using The Cancer Genome Atlas (TCGA) data. Lipogenic pathway regulators such as AKT2, SREBP1c, PPARγ, and lipogenic enzymes such as ACC and FAS were increased in human HCC when compared with control livers. Notably, a more robust increase in de novo lipogenesis was observed in HCV-HCC when compared to HBV-HCC and nonviral HCC. High FAS and ACC expression correlated with poor overall survival (OS) in HCV-HCC. High expression of lipogenesis gene panel significantly correlated with poor OS in HCV-HCC, but not in HBV-HCC or nonviral HCC. In sum, de novo lipogenesis is stimulated dramatically in human HCC especially in HCV-HCC.

Keywords: HCV‐HCC; de novo lipogenesis; human hepatocellular carcinoma.


Conflict of interest statement

The authors declare no conflict of interest.

Figures

FIGURE 1
FIGURE 1
H&E staining analysis of hepatic steatosis in human control livers, fatty livers, and HCV‐HCC tissues. Representative H&E staining from human control livers (A‐C), fatty livers (D‐F), and HCV‐HCC (G‐I). Images were taken with magnification of 40×, 200×, and 400×
FIGURE 2
FIGURE 2
Quantitative reverse transcription polymerase chain reaction analysis of lipogenic proteins in human control livers, cirrhotic livers, and HCC tissues. Results of quantitative PCR analysis of AKT2 mRNA (A), SREBP1c mRNA (B), PPARγ mRNA (C), FAS mRNA (D), and ACC mRNA (E) in control human livers, cirrhotic livers, HBV‐HCC, HCV‐HCC, and nonviral HCC tissues are expressed as fold change over control livers using β‐actin as internal control. n = 6, * P < .05 versus control human livers; # P < .05 versus HCV‐HCC
FIGURE 3
FIGURE 3
Western blot analysis of lipogenic proteins in human control livers, cirrhotic livers, and HCC tissues. Representative western blot of control human livers, cirrhotic livers, HBV‐HCC, HCV‐HCC, and nonviral HCC tissues. AKT2, SREBP1c, PPARγ, FAS, and ACC were blotted as described in Section 2. β‐Actin was used as loading controls. Quantification of image analysis of hepatic lipogenic proteins expression is expressed as mean values ± SEM. n = 6, * P < .05 versus control human livers; # P < .05 versus HCV‐HCC
FIGURE 4
FIGURE 4
Analysis of the association between lipogenesis and survival outcome in HCC patients. The Kaplan‐Meier statistical analysis was used to analyze the survival curves of HCC patients with different expression levels of PPARγ, SREBP1c, FAS, and ACC. Survival curve of PPARγ in viral HCC (A) and nonviral HCC (B) patients; survival curve of SREBP1c in viral HCC (C) and nonviral HCC (D) patients; survival curve of FAS in viral HCC (E) and nonviral HCC (F) patients; survival curve of ACC in viral HCC (G) and nonviral HCC (H) patients
FIGURE 5
FIGURE 5
Analysis of the association between lipogenesis and survival outcome in HBV‐HCC and HCV‐HCC patients. The Kaplan‐Meier statistical analysis was used to analyze the survival curves of HCC patients with different expression levels of FAS, ACC, PPARγ, and SREBP1c. Survival curve of FAS in HBV‐HCC (A) and HCV‐HCC (B) patients; survival curve of ACC in HBV‐HCC (C) and HCV‐HCC (D) patients; survival curve of PPARγ in HBV‐HCC (E) and HCV‐HCC (F) patients; survival curve of SREBP1c in HBV‐HCC (G) and HCV‐HCC (H) patients
FIGURE 6
FIGURE 6
Analysis of the association between lipogenesis genes panel and survival outcome in HCC patients. The expression of FAS, ACC, PPARγ, and SREBP1c was considered as a lipogenesis genes panel. The Kaplan‐Meier statistical analysis was used to analyze the survival curves of HCC patients with different expression levels of the lipogenesis gene panel. Survival curve of the panel in viral HCC (A) and nonviral HCC (B) patients; survival curve of the panel in HBV‐HCC (C) and HCV‐HCC (D) patients

References

    1. El‐Serag HB. Hepatocellular carcinoma. N Engl J Med. 2011;365:1118‐1127. - PubMed
    1. Forner A, Llovet JM, Bruix J. Hepatocellular carcinoma. Lancet. 2012;379:1245‐1255. - PubMed
    1. Calle EE, Rodriguez C, Walker‐Thurmond K, Thun MJ. Overweight, obesity, and mortality from cancer in a prospectively studied cohort of US adults. N Engl J Med. 2003;348:1625‐1638. - PubMed
    1. El‐serag HB, Tran T, Everhart JE. Diabetes increases the risk of chronic liver disease and hepatocellular carcinoma. Gastroenterology. 2004;126:460‐468. - PubMed
    1. Starley BQ, Calcagno CJ, Harrison SA. Nonalcoholic fatty liver disease and hepatocellular carcinoma: a weighty connection. Hepatology. 2010;51:1820‐1832. - PubMed