

Pathway-extended gene expression signatures integrate novel biomarkers that improve predictions of patient responses to kinase inhibitors
- PMID: 34766125
- PMCID: PMC8491218
- DOI: 10.1002/mco2.46
Pathway-extended gene expression signatures integrate novel biomarkers that improve predictions of patient responses to kinase inhibitors
Abstract
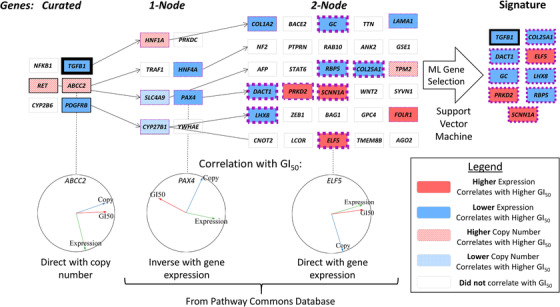
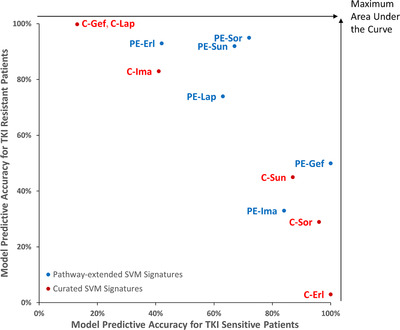
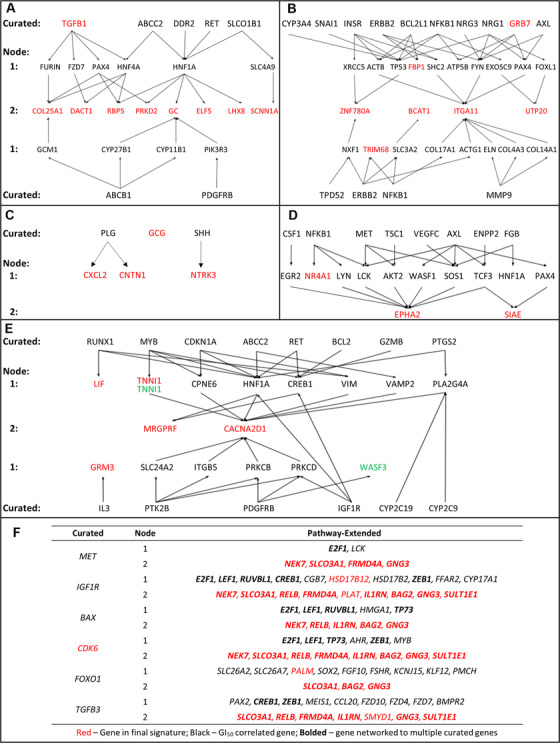
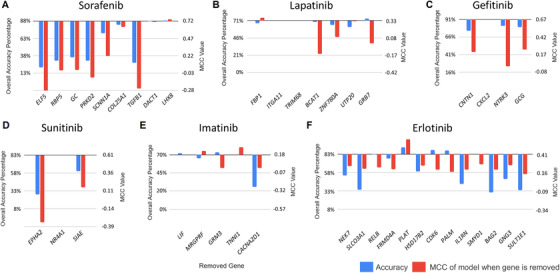
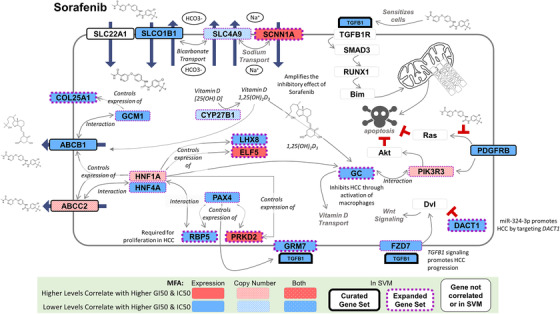
Cancer chemotherapy responses have been related to multiple pharmacogenetic biomarkers, often for the same drug. This study utilizes machine learning to derive multi-gene expression signatures that predict individual patient responses to specific tyrosine kinase inhibitors, including erlotinib, gefitinib, sorafenib, sunitinib, lapatinib and imatinib. Support vector machine (SVM) learning was used to train mathematical models that distinguished sensitivity from resistance to these drugs using a novel systems biology-based approach. This began with expression of genes previously implicated in specific drug responses, then expanded to evaluate genes whose products were related through biochemical pathways and interactions. Optimal pathway-extended SVMs predicted responses in patients at accuracies of 70% (imatinib), 71% (lapatinib), 83% (sunitinib), 83% (erlotinib), 88% (sorafenib) and 91% (gefitinib). These best performing pathway-extended models demonstrated improved balance predicting both sensitive and resistant patient categories, with many of these genes having a known role in cancer aetiology. Ensemble machine learning-based averaging of multiple pathway-extended models derived for an individual drug increased accuracy to >70% for erlotinib, gefitinib, lapatinib and sorafenib. Through incorporation of novel cancer biomarkers, machine learning-based pathway-extended signatures display strong efficacy predicting both sensitive and resistant patient responses to chemotherapy.
Keywords: biochemical pathways; gene signatures; machine learning; systems biology; tyrosine kinase inhibitors.
© 2020 The Authors. MedComm published by Sichuan International Medical Exchange & Promotion Association (SCIMEA) and John Wiley & Sons Australia, Ltd.
Figures
Similar articles
-
Tyrosine Kinase Inhibitors Imatinib and Erlotinib Increase Apoptosis of Antimitotic Drug-resistant KBV20C Cells Without Inhibiting P-gp.Anticancer Res. 2019 Jul;39(7):3785-3793. doi: 10.21873/anticanres.13527. Anticancer Res. 2019. PMID: 31262905
-
Identifying resistance mechanisms against five tyrosine kinase inhibitors targeting the ERBB/RAS pathway in 45 cancer cell lines.PLoS One. 2013;8(3):e59503. doi: 10.1371/journal.pone.0059503. Epub 2013 Mar 29. PLoS One. 2013. PMID: 23555683 Free PMC article.
-
Polymorphisms to predict outcome to the tyrosine kinase inhibitors gefitinib, erlotinib, sorafenib and sunitinib.Curr Top Med Chem. 2012;12(15):1649-59. doi: 10.2174/156802612803531333. Curr Top Med Chem. 2012. PMID: 22978339 Review.
-
Analysis of bypass signaling in EGFR pathway and profiling of bypass genes for predicting response to anticancer EGFR tyrosine kinase inhibitors.Mol Biosyst. 2012 Oct;8(10):2645-56. doi: 10.1039/c2mb25165e. Mol Biosyst. 2012. PMID: 22833077
-
Clinical pharmacokinetics of tyrosine kinase inhibitors: focus on 4-anilinoquinazolines.Clin Pharmacokinet. 2011 Jun;50(6):371-403. doi: 10.2165/11587020-000000000-00000. Clin Pharmacokinet. 2011. PMID: 21553932 Review.
Cited by
-
Ten-year distant-recurrence risk prediction in breast cancer by CanAssist Breast (CAB) in Dutch sub-cohort of the randomized TEAM trial.Breast Cancer Res. 2023 Apr 14;25(1):40. doi: 10.1186/s13058-023-01643-2. Breast Cancer Res. 2023. PMID: 37060036 Free PMC article.
-
Decoding 'Unnecessary Complexity': A Law of Complexity and a Concept of Hidden Variation Behind "Missing Heritability" in Precision Medicine.J Mol Evol. 2021 Oct;89(8):513-526. doi: 10.1007/s00239-021-10023-3. Epub 2021 Aug 2. J Mol Evol. 2021. PMID: 34341835 Free PMC article. Review.
-
Current Bioinformatics Tools in Precision Oncology.MedComm (2020). 2025 Jul 9;6(7):e70243. doi: 10.1002/mco2.70243. eCollection 2025 Jul. MedComm (2020). 2025. PMID: 40636286 Free PMC article. Review.
-
Development and validation of a prognosis prediction model based on 18 endoplasmic reticulum stress-related genes for patients with lung adenocarcinoma.Front Oncol. 2022 Aug 30;12:902353. doi: 10.3389/fonc.2022.902353. eCollection 2022. Front Oncol. 2022. PMID: 36110953 Free PMC article.
References
-
- Pazdur R. Response rates, survival, and chemotherapy trials. J Natl Cancer Inst. 2000;92(19):1552‐1553. - PubMed
-
- Thigpen JT, Vance RB, Khansur T. Second‐line chemotherapy for recurrent carcinoma of the ovary. Cancer. 1993;71(4 Suppl):1559‐1564. - PubMed
-
- Huisman C, Smit EF, Giaccone G, Postmus PE. Second‐line chemotherapy in relapsing or refractory non‐small‐cell lung cancer: a review. J Clin Oncol. 2000;18(21):3722‐3730. - PubMed
-
- Schiller JH, Harrington D, Belani CP, et al. Comparison of four chemotherapy regimens for advanced non‐small‐cell lung cancer. N Engl J Med. 2002;346(2):92‐98. - PubMed
LinkOut - more resources
Full Text Sources