. 2022 Jan;143(1):75-91.
doi: 10.1007/s00401-021-02372-6. Epub 2021 Nov 12.

Diverse human astrocyte and microglial transcriptional responses to Alzheimer's pathology

Affiliations

Diverse human astrocyte and microglial transcriptional responses to Alzheimer's pathology

Amy M Smith et al. Acta Neuropathol. 2022 Jan.

Abstract

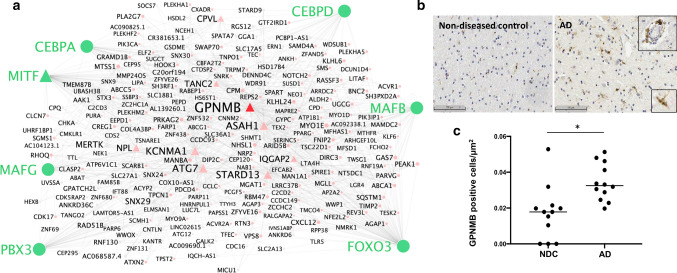
To better define roles that astrocytes and microglia play in Alzheimer's disease (AD), we used single-nuclei RNA-sequencing to comprehensively characterise transcriptomes in astrocyte and microglia nuclei selectively enriched during isolation post-mortem from neuropathologically defined AD and control brains with a range of amyloid-beta and phospho-tau (pTau) pathology. Significant differences in glial gene expression (including AD risk genes expressed in both the astrocytes [CLU, MEF2C, IQCK] and microglia [APOE, MS4A6A, PILRA]) were correlated with tissue amyloid or pTau expression. The differentially expressed genes were distinct between with the two cell types and pathologies, although common (but cell-type specific) gene sets were enriched with both pathologies in each cell type. Astrocytes showed enrichment for proteostatic, inflammatory and metal ion homeostasis pathways. Pathways for phagocytosis, inflammation and proteostasis were enriched in microglia and perivascular macrophages with greater tissue amyloid, but IL1-related pathway enrichment was found specifically in association with pTau. We also found distinguishable sub-clusters in the astrocytes and microglia characterised by transcriptional signatures related to either homeostatic functions or disease pathology. Gene co-expression analyses revealed potential functional associations of soluble biomarkers of AD in astrocytes (CLU) and microglia (GPNMB). Our work highlights responses of both astrocytes and microglia for pathological protein clearance and inflammation, as well as glial transcriptional diversity in AD.

Keywords: Alzheimer’s disease; Amyloid-beta; Astrocytes; Microglia; Tau; snRNA sequencing.


Conflict of interest statement

PMM has received consultancy fees from Roche, Adelphi Communications, Celgene, Neurodiem, and Medscape. He has received honoraria or speakers’ fees from Novartis and Biogen and has received research or educational funds from Biogen, Novartis, and GlaxoSmithKline.

Figures

Fig. 1
Fig. 1
Analysis of human brain microglia and astrocytes from low and high AD pathology brains by single-nuclei RNASeq. a FACS gating method for sorting of human brain nuclei to enrich for microglia and astrocyte double-negative population (pink; mean for 24 samples = 17.9%, standard deviation = 6.2%). Dapi + ve nuclei were selected first, followed by separation based on NeuN and Sox10 staining. b UMAP 2D visualisation of clustering of 91,655 single nuclei from the 24 brain samples (average of 3819 nuclei per sample) including 52,706 (58%) astrocytes and 27,592 (30%) microglia. Smaller numbers of nuclei from neurons, oligodendrocytes, and vascular cells also were found (Extended Data Fig. 2, online resource), but these cell types formed distinct UMAP clusters that were not analysed further. c Heatmap showing cell type-specific marker gene expression in the nuclei clusters. d Heatmap of top differentially expressed genes in each microglial cluster. e Heatmap of top differentially expressed genes in each astrocyte cluster
Fig. 2
Fig. 2
Differential gene expression in astrocytes and microglia with amyloid-beta and pTau pathology. Volcano plot of transcripts differentially expressed in astrocyte nuclei (threshold of ≤ 0.05 adjusted p value, abs logFC ≥ 0.25, omitting the top three most variable genes between samples) with immunohistochemically defined tissue amyloid-beta (a) and pTau (b) density. c Venn diagram illustrating the number of genes positively correlated (top) and negatively correlated (bottom) with amyloid-beta (blue) and pTau pathology (pink) in astrocytes. Volcano plot of transcripts differentially expressed in microglial nuclei (threshold of ≤ 0.05 adjusted p value, abs logFC ≥ 0.25, omitting the top three most variable genes between samples) with immunohistochemically defined tissue amyloid-beta (d) and pTau (e) density. f Venn diagram illustrating the number of genes positively correlated (top) and negatively correlated (bottom) with amyloid-beta (blue) and pTau (pink) pathology in microglia
Fig. 3
Fig. 3
Functional enrichment of differential gene expression with amyloid-beta (left) and pTau (right) pathology in astrocytes. The plots describe the significant functionally enriched pathways in astrocytes obtained using enrichR (see “Methods”) from Gene Ontology (GO), Reactome, and Wikipathways (WP) databases
Fig. 4
Fig. 4
Functional enrichment of differential gene expression with amyloid-beta (left) and pTau (right) pathology in microglia. The plots describe the significant functionally enriched pathways in microglia obtained using enrichR (see “Methods”) from Gene Ontology (GO), Reactome, and Wikipathways (WP) databases
Fig. 5
Fig. 5
GPNMB is a hub gene in microglial gene co-expression modules up-regulated with AD pathology. a Graph of microglial gene co-expression module 11 enriched with amyloid-beta and pTau pathology for which GPNMB is a hub gene (triangles = module hub genes). GPNMB is expressed in regulons identified by their transcription factors (in green). b Immunohistochemical staining of GPNMB in post-mortem human brain tissue from representative NDC and AD brains with nuclear counterstain. Staining is present in both microglia and perivascular macrophages (insets). Scale = 100 μm. c Quantification of density of GPNMB-positive cells in cortical tissue by automated image analysis showing an increase in GPNMB-positive cells per μm2 for AD cases compared to NDC (p = 0.0023; Mann–Whitney test, two-tailed; N = 12). Each point represents a single sample and the horizontal bar indicates the median

References

    1. Aibar S, Gonzalez-Blas CB, Moerman T, Huynh-Thu VA, Imrichova H, Hulselmans G, Rambow F, Marine JC, Geurts P, Aerts J, et al. SCENIC: single-cell regulatory network inference and clustering. Nat Methods. 2017;14:1083–1086. doi: 10.1038/nmeth.4463. - DOI - PMC - PubMed
    1. Al-Dalahmah O, Sosunov AA, Shaik A, Ofori K, Liu Y, Vonsattel JP, Adorjan I, Menon V, Goldman JE. Single-nucleus RNA-seq identifies Huntington disease astrocyte states. Acta Neuropathol Commun. 2020;8:19–19. doi: 10.1186/s40478-020-0880-6. - DOI - PMC - PubMed
    1. Andrews SJ, Fulton-Howard B, Goate A. Interpretation of risk loci from genome-wide association studies of Alzheimer's disease. Lancet Neurol. 2020;19:326–335. doi: 10.1016/S1474-4422(19)30435-1. - DOI - PMC - PubMed
    1. Baker M, Mackenzie IR, Pickering-Brown SM, Gass J, Rademakers R, Lindholm C, Snowden J, Adamson J, Sadovnick AD, Rollinson S, et al. Mutations in progranulin cause tau-negative frontotemporal dementia linked to chromosome 17. Nature. 2006;442:916–919. doi: 10.1038/nature05016. - DOI - PubMed
    1. Benjamini Y, Hochberg Y. Controlling the false discovery rate: a practical and powerful approach to multiple testing. J R Stat Soc: Ser B (Methodol) 1995;57:289–300.

Publication types