Review
. 2021 Nov 12;12(1):167.
doi: 10.1186/s13244-021-01109-z.

Rhino-orbito-cerebral Mucormycosis: Pictorial Review

Affiliations
Review

Rhino-orbito-cerebral Mucormycosis: Pictorial Review

Vivek Pai et al. Insights Imaging. .

Abstract

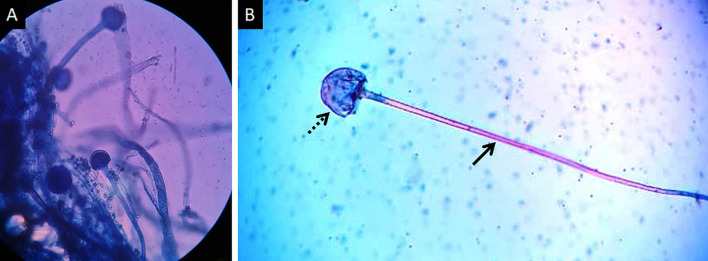
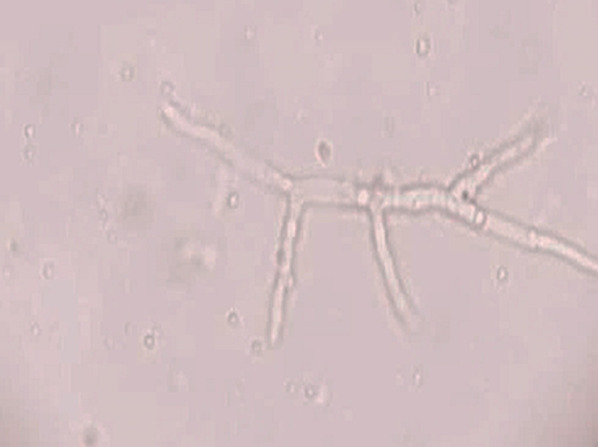
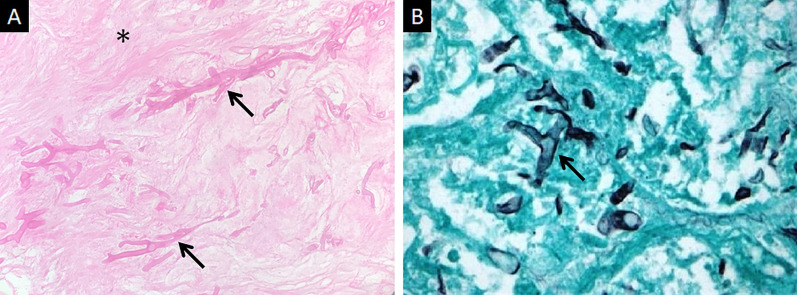
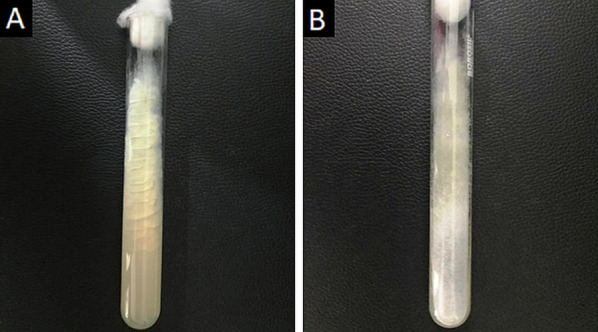
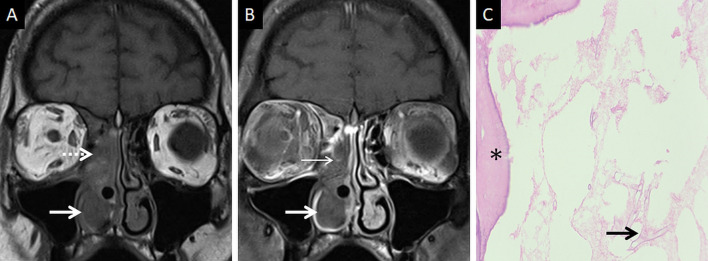
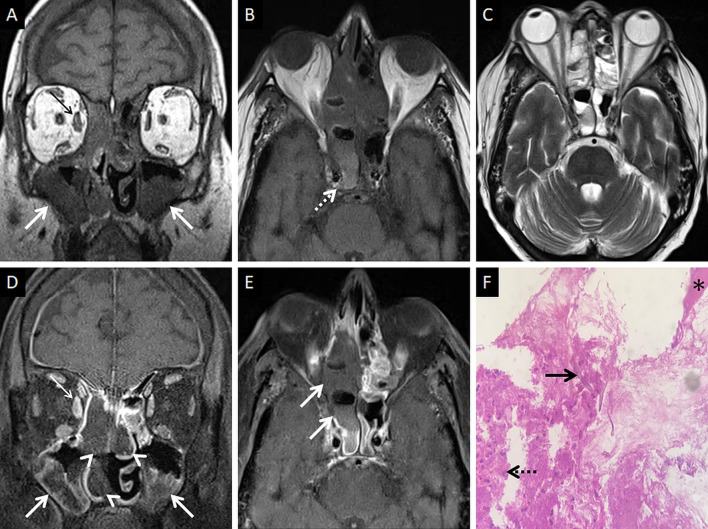
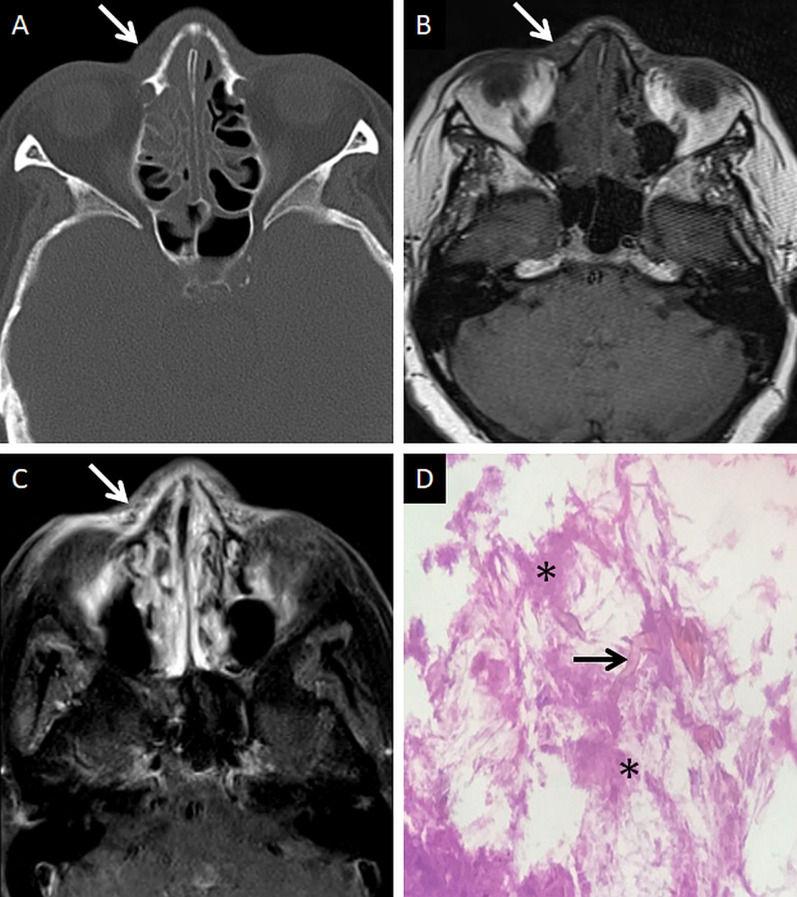
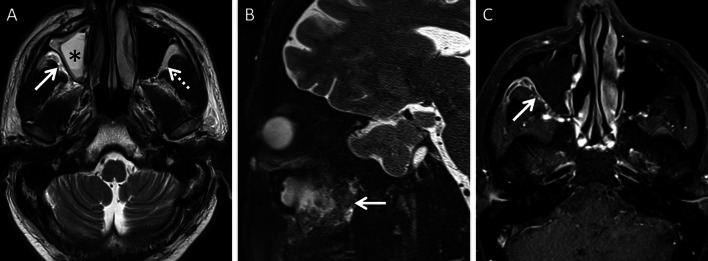
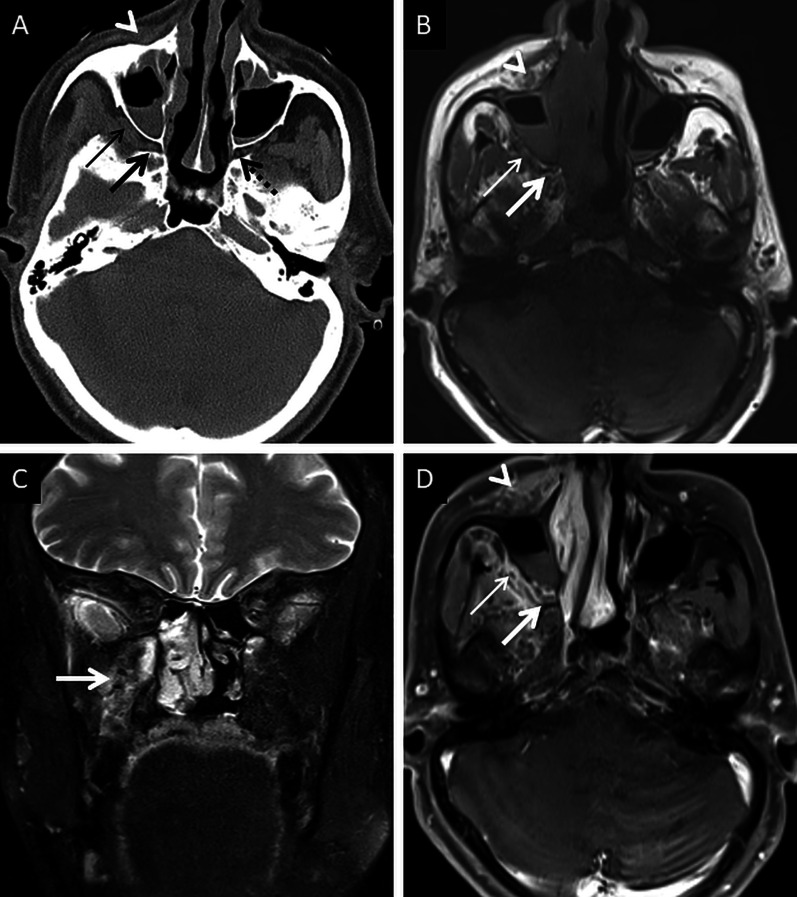
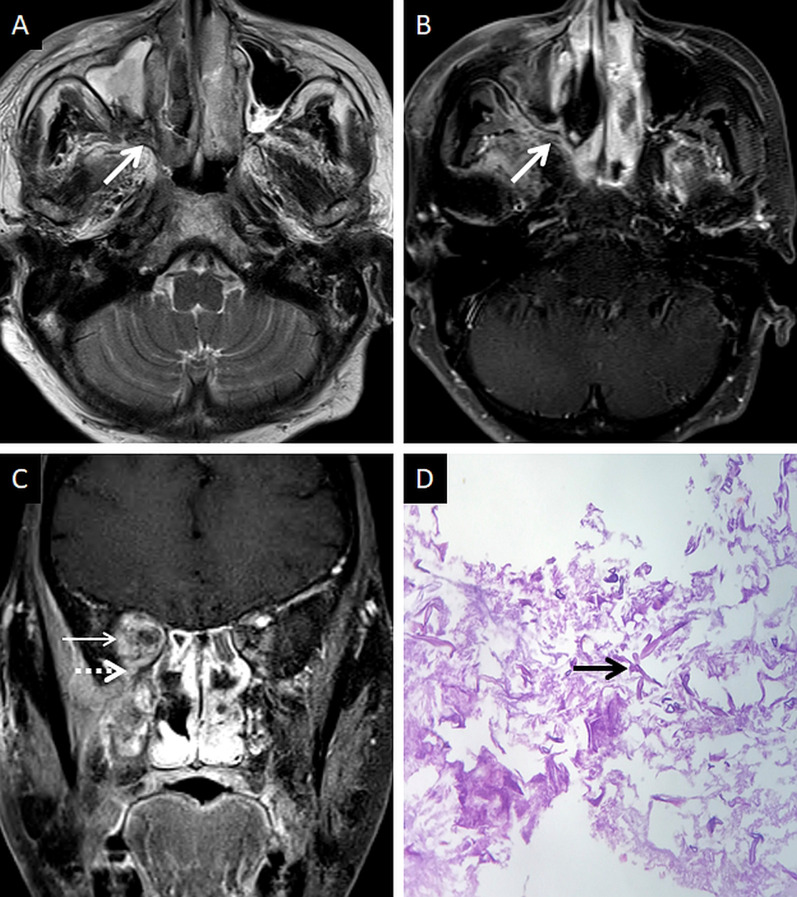
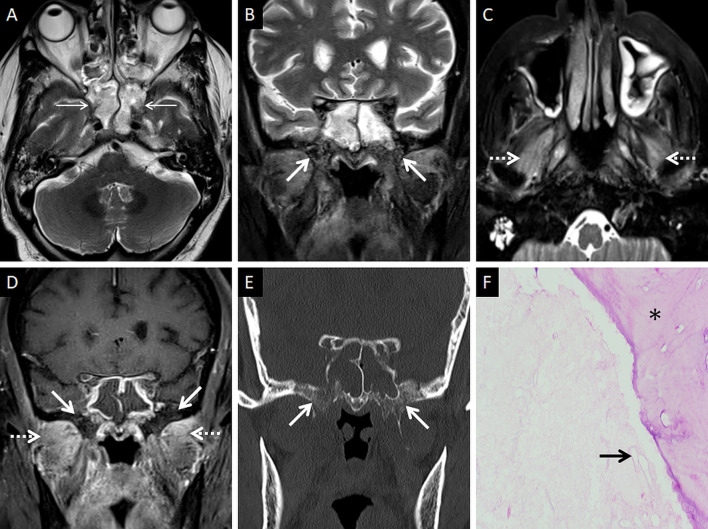
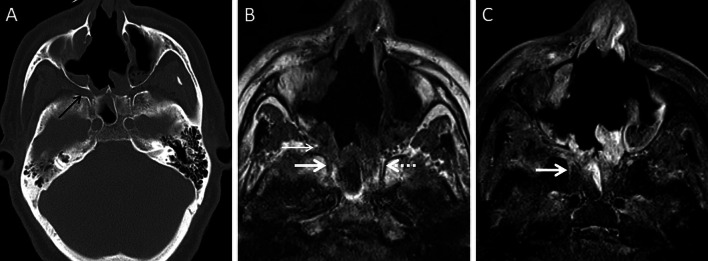
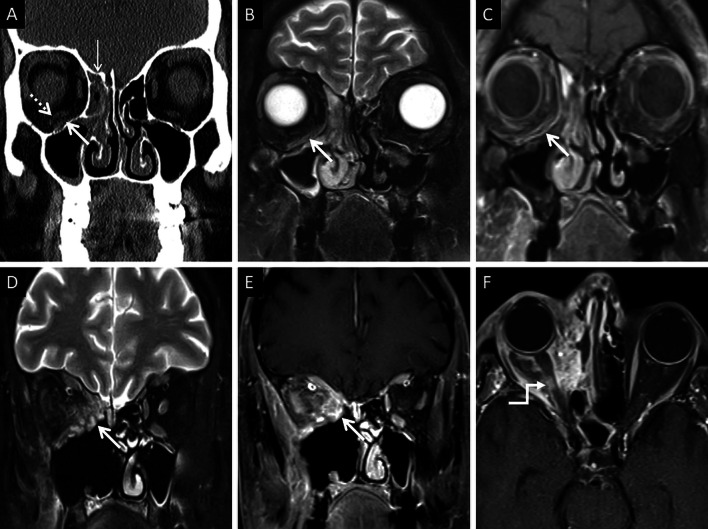
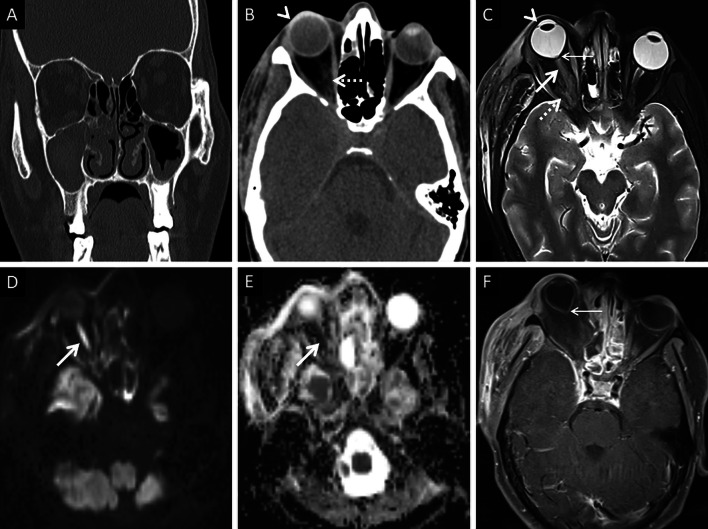
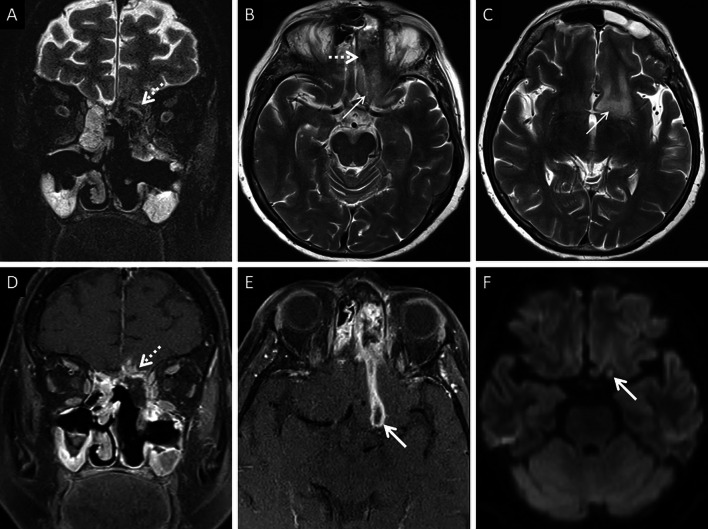
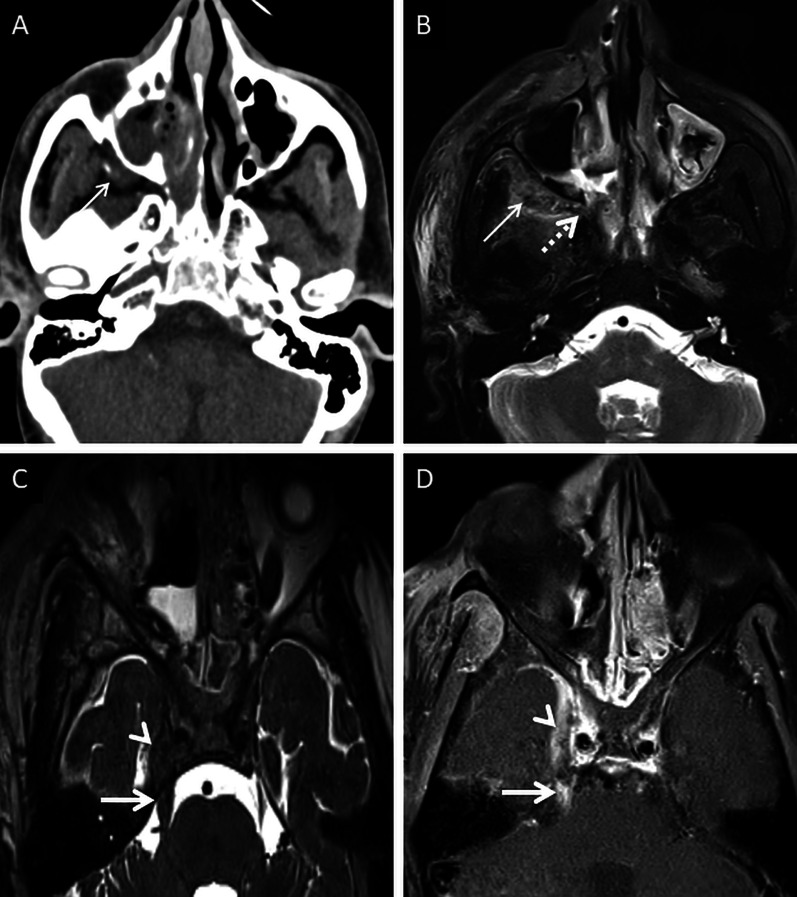
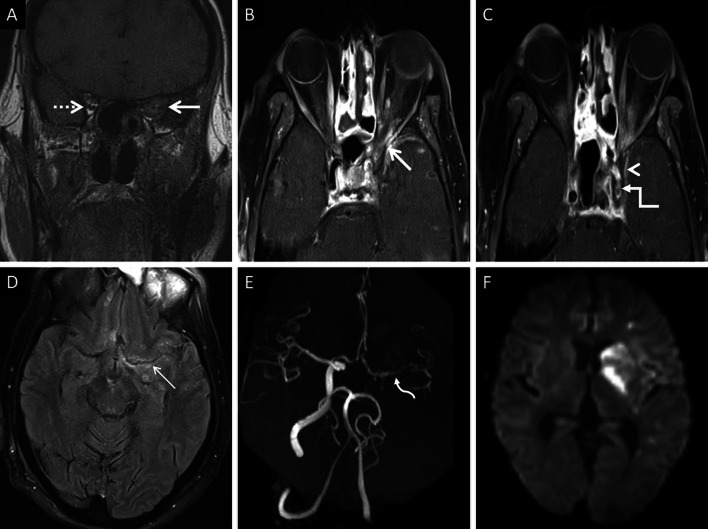
Mucormycosis (MCR) is a fulminant, potentially lethal, opportunistic fungal infection. Diabetes, immunocompromised states and elevated serum iron levels are the most important risk factors for contracting MCR infection. Recently, MCR co-infections have been observed in patients with COVID-19 disease owing to a complex interplay of metabolic factors and corticosteroid therapy. Rhino-orbito-cerebral mucormycosis (ROCM) is the most common clinical form of MCR infection and refers to infection of the nasal cavities, paranasal sinuses, neck spaces, orbits and intracranial structures. Sinonasal inoculation is typically the primary site of infection; the necrotising and angioinvasive properties of the fungus facilitate its spread into adjacent structures. In this review, we discuss the pertinent mycology and risk factors of MCR infection. The review also aims to acquaint the reader with the cross-sectional imaging appearances of ROCM and its complications. All the cases discussed in this pictorial essay are microbiologically and/or histopathologically proven cases of ROCM with concomitant COVID-19 infection.

Keywords: Invasive fungal sinusitis; Mucormycosis; Rhino-orbito-cerebral Mucormycosis.


Conflict of interest statement

Competing interests: Vivek Pai is member of the Insights into Imaging Editorial Board. He has not taken part in the review or selection process of this article. The remaining authors declare that they have no competing interests.

Figures

Fig. 1
Fig. 1
Lactophenol cotton blue (LCB) stained tissue mount (a) performed for the demonstration of sporangiophores, the early stage in the life cycle of MCR. High-power photomicrograph (b) of a single sporangiophore (thick arrow) with a bulbous, sac-like sporangium (dotted arrow) containing new fungal spores
Fig. 2
Fig. 2
High-power microscopy of a potassium hydroxide (KOH) mount demonstrates a broad, aseptate, branching (at 90◦) hypha of Mucorales
Fig. 3
Fig. 3
Histopathological examination of neck tissues following surgical debridement of 2 different patients with ROCM. Haematoxylin and Eosin (HE) staining (a) demonstrates broad, branching fungal hyphae (thick arrows) on the background of extensive tissue necrosis (*). Grocott-Gomori methamine silver staining (b) relies on oxidation of the polysaccharides within fungal cell walls. The result is black staining of hyphae (thick arrow in b) against a green counterstain
Fig. 4
Fig. 4
Obverse (a) and reverse (b) views of Sabouraud Dextrose Agar used for the selective cultivation of Mucorales species at 30◦ C. Note the greyish white, cotton-like appearance of the fungal colonies
Fig. 5
Fig. 5
Classic appearance of the “black turbinate” sign. Unenhanced coronal T1W image (a) reveals intermediate signal contents within the right nasal cavity (dotted arrow) and hypertrophy of the right inferior turbinate (thick arrow). Corresponding CE fat-suppressed (FS) coronal T1W image (b) reveals poor enhancement of the right middle (thin arrow) and inferior turbinates (thick arrow) due to necrosis, resulting in the “black turbinate” sign. Post-operative histopathology analysis (c), using HE staining, demonstrates necrosis of the turbinate (*) and branching, aseptate fungal hyphae (thick arrow) consistent with the diagnosis of MCR
Fig. 6
Fig. 6
Sinonasal involvement of ROCM. Unenhanced coronal T1W image (a) reveals diffuse, intermediate signal intensity, mucosal and mucoperiosteal thickening (thick arrows) in the nasal cavities and the maxillary sinuses, respectively. Note the slight asymmetric thickening of the right medial rectus muscle (thin arrow). Unenhanced axial T1W image (b) reveals mucoperiosteal thickening in the ethmoid and sphenoid sinuses with mild T1 shortening in the right sphenoid sinus (dotted arrow), consistent with fungal paramagnetic content. Axial T2W image (c) reveals non-specific, mixed signal intensity signals within the ethmoid and sphenoid sinuses. CE FS coronal T1W image (d) shows lack of enhancement in both middle turbinates and the right inferior turbinate (black turbinate sign—arrow heads), along with non-enhancing mucoperiosteal thickening in the maxillary sinuses (thick arrow). Note the asymmetric enhancement of the right medial rectus muscle (thin arrow) suggesting myositis. CE FS axial T1W image (e) confirms poor enhancement of the right ethmoid and sphenoid sinus mucoperiosteal thickening (thick arrows). Post-operative histopathology analysis (f), using HE staining, demonstrates shows few branching, aseptate fungal hyphae (thick arrow) consistent with the diagnosis of MCR along with neutrophilic and histiocytic inflammatory infiltrates (dotted arrow) and necrotic tissues (*)
Fig. 7
Fig. 7
Extra-sinus involvement without bone destruction. Axial CT scan (a) of the paranasal sinuses, obtained using the bone algorithm, reveals opacification of the ethmoid air cells, rarefaction of its trabeculae in addition to subtle swelling along the nasal bridge (thick arrow). No overt erosion of the nasal bones, nasolacrimal duct or the lamina papyracea is seen. Unenhanced axial T1W image (b) confirms the subcutaneous soft tissue (thick arrow) detected on the CT. CE FS axial T1W image (c) demonstrates heterogeneous enhancement of the nasal soft tissue (thick arrow). Post-debridement histopathology analysis (d), using HE staining, confirms branching, aseptate fungal hyphae (thick arrow), consistent with MCR, on the background of necrotic tissue (*)
Fig. 8
Fig. 8
Retro-antral fat involvement in a patient with histopathologically confirmed MCR. Axial T2W image of the brain (a) reveals right maxillary sinus disease (*). Note the slightly heterogeneous appearance of the right retro-antral fat (thick arrow) as compared to the contralateral side (dotted arrow). Sagittal T2-FS image (b), obtained for the evaluation of the neck and orbits, confirms stranding of right retro-antral fat (thick arrow). CE FS axial T1W image (c) demonstrates intense enhancement of the right retro-antral soft tissue (thick arrow)
Fig. 9
Fig. 9
PPF involvement in ROCM. Unenhanced axial CT scan of the brain (a) reveals soft tissue within the right PPF (thick arrow). Note the normal fat density and branches of the internal maxillary artery seen in the contralateral, uninvolved PPF (dotted arrow). Soft tissue is also noted in the right retro-antral fat (thin arrow) and the right anterior periantral fat (arrow head) as well. Based on the imaging signs, the possibility of ROCM was suggested and a prompt CE MRI of the neck was performed. Unenhanced axial T1W (b) and coronal T2-FS (c) images of the neck confirm the presence of soft tissue in the right PPF (thick arrows in b, c), right retro-antral fat (thin arrow in b) and right anterior periantral fat (arrow head in b). CE FS axial T1W image (d) reveals heterogeneous enhancement of the soft tissue in the right PPF (thick arrow) as well as in the right retro-antral fat (thin arrow) and right anterior periantral fat (arrow head)
Fig. 10
Fig. 10
PPF involvement with orbital spread of ROCM. Axial T2W image of the brain (a) reveals hypointense soft tissue within the right PPF (thick arrow). CE FS axial T1W image (b) demonstrates heterogeneous enhancement of the soft tissue (thick arrow). CE FS T1W image (c) reveals ipsilateral intraorbital extension (thin arrow) of the soft tissue, via the inferior orbital fissure (dotted arrow). Post-debridement histopathology analysis (d) confirms branching fungal hyphae (thick arrow) compatible with the diagnosis of MCR
Fig. 11
Fig. 11
SBO in ROCM. Axial T2W image of the brain (a) reveals bilateral sphenoid sinusitis (thin arrows). Coronal T2-FS image of the neck (b) demonstrates abnormal hyperintense marrow signals along the base of the sphenoid sinus and the greater wings of the sphenoid bone (thick arrows). Axial T2-FS image (c) shows oedematous swelling of the muscles of mastication (dotted arrows). CE FS coronal T1W image (d) demonstrates subtle abnormal marrow enhancement within the sphenoid bones (thick arrows) along with intense enhancement of the muscles of mastication (dotted arrows). Coronal CT image (e), using bone algorithm, confirms rarefaction of the sphenoid bones (thick arrow). Post-operative histopathology analysis (f), using HE staining, confirms Mucorales hyphae (thick arrow) with bone devitalisation and necrosis of the sphenoid bone (*)
Fig. 12
Fig. 12
Perineural spread of ROCM detected on post-operative follow-up imaging. Axial CT image (a), obtained using bone algorithm, reveals slight widening of the right PPF (thin arrow). Unenhanced axial T1W image (b) of the same patient confirms soft tissue (thin arrow) within the right PPF. Note the loss of normal fat signal within the right vidian nerve canal (thick arrow), compared to the contralateral side (dotted arrow). CE FS axial T1W image (c) reveals abnormal enhancement of the soft tissue within the right vidian nerve canal (thick arrow). The diagnosis of perineural invasion of MCR was suggested. There was no obvious enhancement along the greater superior petrosal nerve detected at the time of scanning
Fig. 13
Fig. 13
Orbital spread in a patient with histopathologically and microbiologically confirmed ROCM. Coronal CT image of the paranasal sinuses (a), obtained using the bone algorithm, reveals right ethmoid sinusitis (thin arrow). Note the subtle extra-conal fat stranding (thick arrow) and mild displacement of the right inferior rectus (dotted arrow). Based on the clinical suspicion of ROCM and CT findings a CE MRI was suggested. Coronal T2-FS image (b) confirms the soft tissue within the right extra-conal space (thick arrow), detected previously on the CT. CE FS coronal T1W image (c) demonstrates heterogeneous enhancement of the soft tissue (thick arrow). The patient underwent surgical debridement along with right turbinectomy and removal of the right lamina papyracae, followed by a post-operative CE MRI (df) follow-up. Coronal T2-FS (d) reveals worsening of the disease with a confluent soft tissue (thick arrow) involving the orbital fat and the extra-ocular muscles. CE FS coronal T1W image (e) reveals intense enhancement of the right orbital soft tissue (thick arrow). CE FS axial T1W image (f) reveals focal fungal invasion of the right optic nerve (stepped arrow)
Fig. 14
Fig. 14
ROCM-related ONI and endophthalmitis. Coronal CT image of the paranasal sinuses (a), obtained using the bone algorithm, reveals opacification of the maxillary sinuses, worse on the right. Axial CT image (b), using the soft tissue algorithm, demonstrates subtle right orbital fat stranding (dotted arrow) and mild right proptosis (arrow head). Axial T2-FS image (c) confirms the right orbital stranding (dotted arrow) and right proptosis (arrow head). Note the subtle tenting of the posterior aspect of the right globe (thin arrow) and thickening of the right optic nerve (thick arrow). Axial diffusion weighted (d) and apparent diffusion coefficient (e) images reveal restricted diffusion within the right optic nerve in keeping with an optic nerve infarction. Overall, findings of orbital compartment syndrome with endophthalmitis and optic nerve infarction was suggested. The patient underwent urgent surgery, with removal of the right lamina papyracae, for relief of the compartment syndrome. CE FS axial T1W image (f) reveals interim worsening of the right endophthalmitis (thin arrow)
Fig. 15
Fig. 15
Cerebritis and parenchymal abscess formation in ROCM. Pre-operative imaging workup was performed at another institution. Post-operative MRI, performed at our institution, is presented. Coronal T2-FS image (a) demonstrates ill defined, hypointense soft tissue in the left ethmoid air cells, invading into the left anterior cranial / left olfactory fossa (dotted arrow). Axial T2W images of the brain (b, c) demonstrates the hypointense soft tissue (dotted arrow in B) along with vasogenic oedema in the left basifrotnal white matter (thin arrows in b, c). CE FS coronal T1W image (d) shows abnormal parenchymal enhancement (dotted arrow) of the left gyrus rectus suggesting cerebritis, due to fungal invasion. CE FS axial T1W image (e) shows a peripherally enhancing lesion (thick arrow) along the posterior portion of the left gyrus rectus. Axial diffusion weighted image (f) shows restricted diffusion within the peripherally enhancing lesion (thick arrow), suggesting abscess formation
Fig. 16
Fig. 16
Post-operative follow-up demonstrating intracranial involvement in a case of ROCM. Axial CT image (a) of the neck reveals mild soft tissue in the right retro-antral (thin arrow). Axial T2-FS image (b) confirms the soft tissue occupying the right retro-antral fat (thin arrow) and PPF (dotted arrow). Axial constructive interference in steady state (CISS) sequence (c) obtained for the evaluation of the cranial nerves demonstrates thickening of the right trigeminal nerve (thick arrow). Note the lateral convexity of the right cavernous sinus (arrow head). CE FS T1W image (d) reveals dural thickening and non-enhancement of the right cavernous sinus in keeping with thrombosis (arrow head). Enhancement of the cisternal portion of the right trigeminal nerve (thick arrow in d) is also seen, suggestive of intracranial perineural spread
Fig. 17
Fig. 17
Intracranial spread of ROCM in a patient with bilateral ethmoid sinus disease (not shown). Coronal T1W image (a) reveals abnormal soft tissue within the left orbital apex (thick arrow). Note the normal fat signals in the contralateral orbital apex (dotted arrow). CE FS axial T1W images (b, c) demonstrate the soft tissue in the left orbital apex (thick arrow in b), non-enhancement of the left cavernous sinus (arrow head in c) suggesting thrombosis, and loss of flow void along the left carotid siphon (stepped arrow in c) representing occlusion. Axial CE FLAIR image (d) reveals leptomeningeal enhancement along the left middle cerebral artery sulcus (thin arrow). 3-D reconstruction of a Time-of-Flight MR angiogram (e) confirms the occlusion of the left internal carotid artery along with attenuated, irregular flow signals within the M1 segment of the middle cerebral artery (curved arrow), reformed via the circle of Willis, and reduced distal cortical arborisation. Diffusion weighted image (f) demonstrates scattered acute infarcts in the left middle cerebral artery territory. In summary, the diagnosis of ROCM with orbital apex involvement and intracranial spread (cavernous sinus thrombosis, leptomeningeal disease and MCR-related vasculitis) was suggested

References

    1. Chung JH, Godwin JD, Chien JW, Pipavath SJ. Case 160: pulmonary mucormycosis. Radiology. 2010;256(2):667–670. - PubMed
    1. Therakathu J, Prabhu S, Irodi A, Sudhakar SV, Yadav VK, Rupa V. Imaging features of rhinocerebral mucormycosis: a study of 43 patients. Egypt J Radiol Nucl Med. 2018;49(2):447–452.
    1. Agrawal R, Yeldandi A, Savas H, Parekh ND, Lombardi PJ, Hart EM. Pulmonary mucormycosis: risk factors, radiologic findings, and pathologic correlation. Radiographics. 2020;40(3):656–666. - PubMed
    1. Prakash H, Chakrabarti A. Global epidemiology of mucormycosis. J Fungi. 2019;5(1):26. - PMC - PubMed
    1. Ibrahim AS, Spellberg B, Walsh TJ, Kontoyiannis DP. Pathogenesis of mucormycosis. Clin Infect Dis. 2012;54(1):16–S22. - PMC - PubMed

LinkOut - more resources