

Morphological consequences of climate change for resident birds in intact Amazonian rainforest
- PMID: 34767440
- PMCID: PMC8589309
- DOI: 10.1126/sciadv.abk1743
Morphological consequences of climate change for resident birds in intact Amazonian rainforest
Abstract
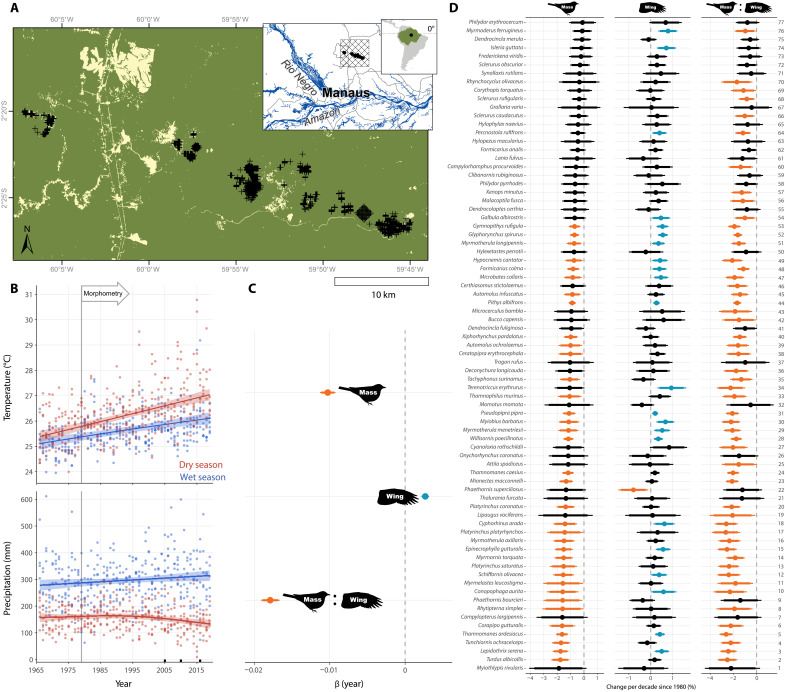
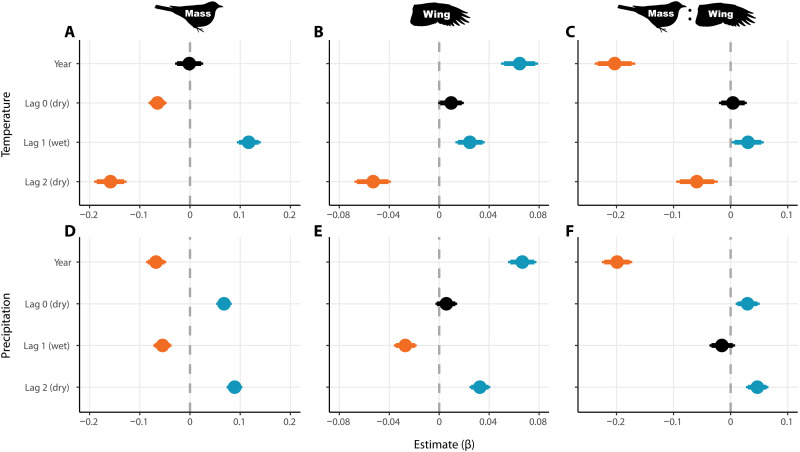
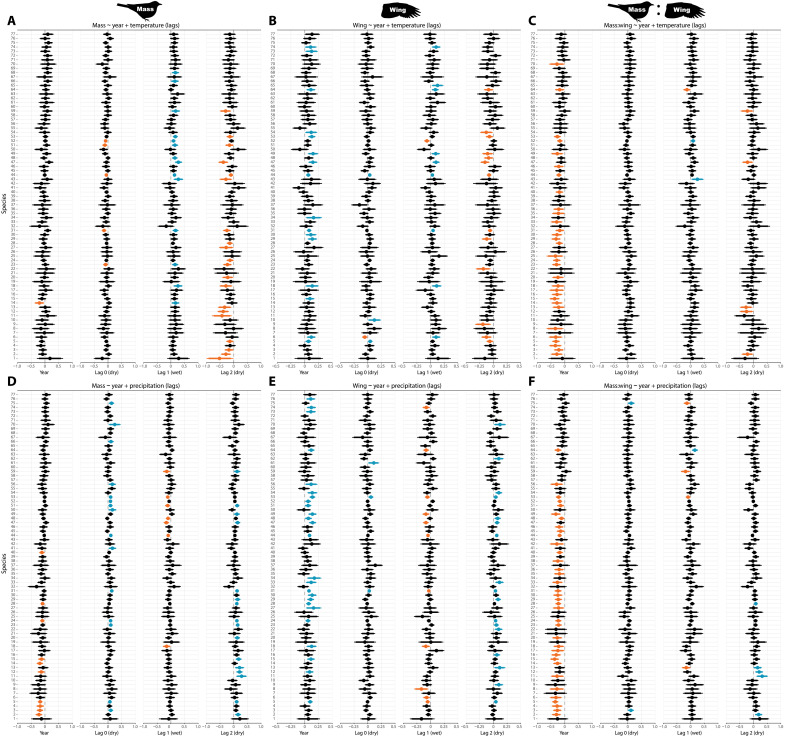
Warming from climate change is expected to reduce body size of endotherms, but studies from temperate systems have produced equivocal results. Over four decades, we collected morphometric data on a nonmigratory understory bird community within Amazonian primary rainforest that is experiencing increasingly extreme climate. All 77 species showed lower mean mass since the early 1980s—nearly half with 95% confidence. A third of species concomitantly increased wing length, driving a decrease in mass:wing ratio for 69% of species. Seasonal precipitation patterns were generally better than temperature at explaining morphological variation. Short-term climatic conditions affected all metrics, but time trends in wing and mass:wing remained robust even after controlling for annual seasonal conditions. We attribute these results to pressures to increase resource economy under warming. Both seasonal and long-term morphological shifts suggest response to climate change and highlight its pervasive consequences, even in the heart of the world’s largest rainforest.
Figures
References
-
- Hughes T. P., Barnes M. L., Bellwood D. R., Cinner J. E., Cumming G. S., Jackson J. B. C., Kleypas J., van de Leemput I. A., Lough J. M., Morrison T. H., Palumbi S. R., van Nes E. H., Scheffer M., Coral reefs in the Anthropocene. Nature 546, 82–90 (2017). - PubMed
-
- Allen C. D., Breshears D. D., McDowell N. G., On underestimation of global vulnerability to tree mortality and forest die-off from hotter drought in the Anthropocene. Ecosphere 6, 129 (2015).
-
- Jablonski D., Roy K., Valentine J. W., Out of the tropics: Evolutionary dynamics of the latitudinal diversity gradient. Science 314, 102–106 (2006). - PubMed
-
- Sullivan M. J. P., Lewis S. L., Affum-Baffoe K., Castilho C., Costa F., Sanchez A. C., Ewango C. E. N., Hubau W., Marimon B., Monteagudo-Mendoza A., Qie L., Sonké B., Martinez R. V., Baker T. R., Brienen R. J. W., Feldpausch T. R., Galbraith D., Gloor M., Malhi Y., Aiba S.-I., Alexiades M. N., Almeida E. C., de Oliveira E. A., Dávila E. Á., Loayza P. A., Andrade A., Vieira S. A., Aragão L. E. O. C., Araujo-Murakami A., Arets E. J. M. M., Arroyo L., Ashton P., Aymard C G., Baccaro F. B., Banin L. F., Baraloto C., Camargo P. B., Barlow J., Barroso J., Bastin J.-F., Batterman S. A., Beeckman H., Begne S. K., Bennett A. C., Berenguer E., Berry N., Blanc L., Boeckx P., Bogaert J., Bonal D., Bongers F., Bradford M., Brearley F. Q., Brncic T., Brown F., Burban B., Camargo J. L., Castro W., Céron C., Ribeiro S. C., Moscoso V. C., Chave J., Chezeaux E., Clark C. J., de Souza F. C., Collins M., Comiskey J. A., Valverde F. C., Medina M. C., da Costa L., Dančák M., Dargie G. C., Davies S., Cardozo N. D., de Haulleville T., de Medeiros M. B., Del Aguila Pasquel J., Derroire G., Fiore A. D., Doucet J.-L., Dourdain A., Droissart V., Duque L. F., Ekoungoulou R., Elias F., Erwin T., Esquivel-Muelbert A., Fauset S., Ferreira J., Llampazo G. F., Foli E., Ford A., Gilpin M., Hall J. S., Hamer K. C., Hamilton A. C., Harris D. J., Hart T. B., Hédl R., Herault B., Herrera R., Higuchi N., Hladik A., Coronado E. H., Huamantupa-Chuquimaco I., Huasco W. H., Jeffery K. J., Jimenez-Rojas E., Kalamandeen M., Djuikouo M. N. K., Kearsley E., Umetsu R. K., Kho L. K., Killeen T., Kitayama K., Klitgaard B., Koch A., Labrière N., Laurance W., Laurance S., Leal M. E., Levesley A., Lima A. J. N., Lisingo J., Lopes A. P., Lopez-Gonzalez G., Lovejoy T., Lovett J. C., Lowe R., Magnusson W. E., Malumbres-Olarte J., Manzatto Â. G., Marimon B. H., Marshall A. R., Marthews T., de Almeida Reis S. M., Maycock C., Melgaço K., Mendoza C., Metali F., Mihindou V., Milliken W., Mitchard E. T. A., Morandi P. S., Mossman H. L., Nagy L., Nascimento H., Neill D., Nilus R., Vargas P. N., Palacios W., Camacho N. P., Peacock J., Pendry C., Mora M. C. P., Pickavance G. C., Pipoly J., Pitman N., Playfair M., Poorter L., Poulsen J. R., Poulsen A. D., Preziosi R., Prieto A., Primack R. B., Ramírez-Angulo H., Reitsma J., Réjou-Méchain M., Correa Z. R., de Sousa T. R., Bayona L. R., Roopsind A., Rudas A., Rutishauser E., Salim K. A., Salomão R. P., Schietti J., Sheil D., Silva R. C., Espejo J. S., Valeria C. S., Silveira M., Simo-Droissart M., Simon M. F., Singh J., Shareva Y. C. S., Stahl C., Stropp J., Sukri R., Sunderland T., Svátek M., Swaine M. D., Swamy V., Taedoumg H., Talbot J., Taplin J., Taylor D., ter Steege H., Terborgh J., Thomas R., Thomas S. C., Torres-Lezama A., Umunay P., Gamarra L. V., van der Heijden G., van der Hout P., van der Meer P., van Nieuwstadt M., Verbeeck H., Vernimmen R., Vicentini A., Vieira I. C. G., Torre E. V., Vleminckx J., Vos V., Wang O., White L. J. T., Willcock S., Woods J. T., Wortel V., Young K., Zagt R., Zemagho L., Zuidema P. A., Zwerts J. A., Phillips O. L., Long-term thermal sensitivity of Earth’s tropical forests. Science 368, 869–874 (2020). - PubMed
LinkOut - more resources
Full Text Sources
