. 2021 Nov 12;7(46):eabi8602.
doi: 10.1126/sciadv.abi8602. Epub 2021 Nov 12.

Lactate supports a metabolic-epigenetic link in macrophage polarization

Affiliations

Lactate supports a metabolic-epigenetic link in macrophage polarization

Jordan T Noe et al. Sci Adv. .

Abstract

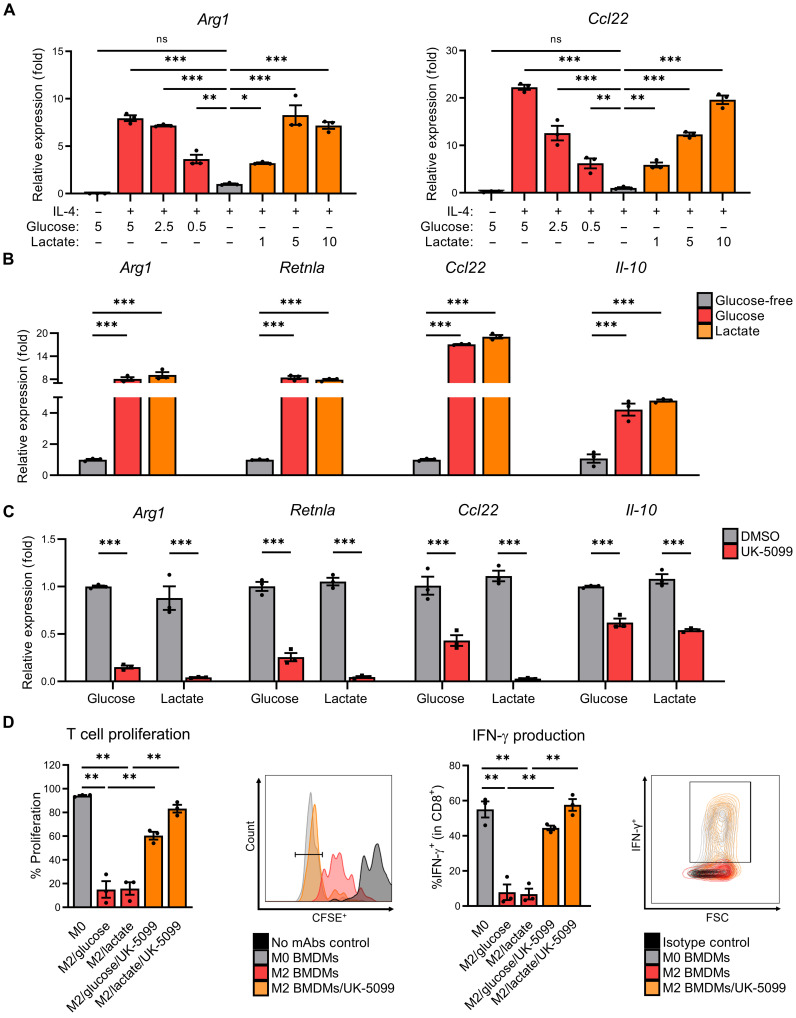
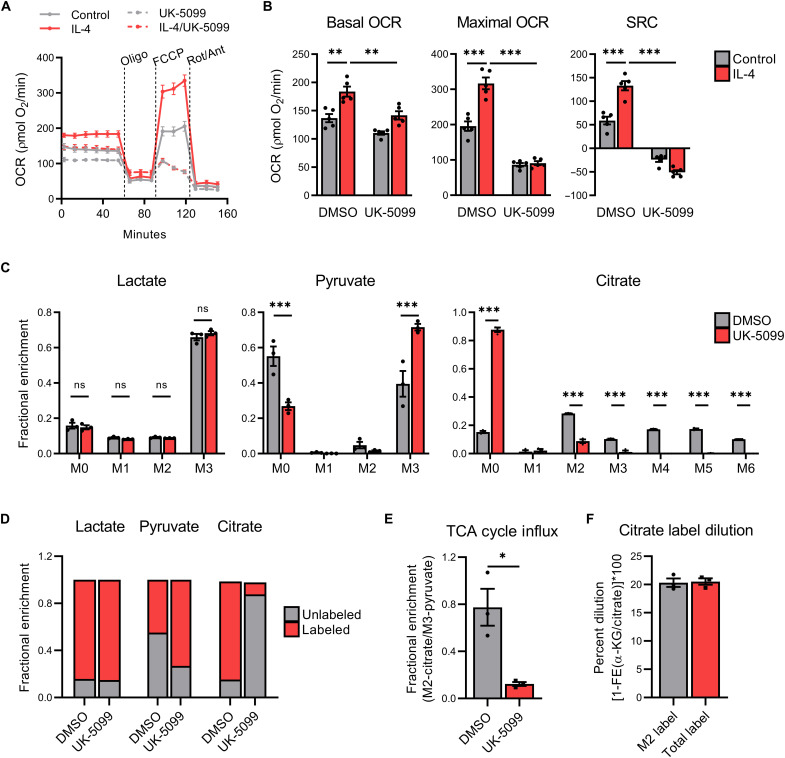
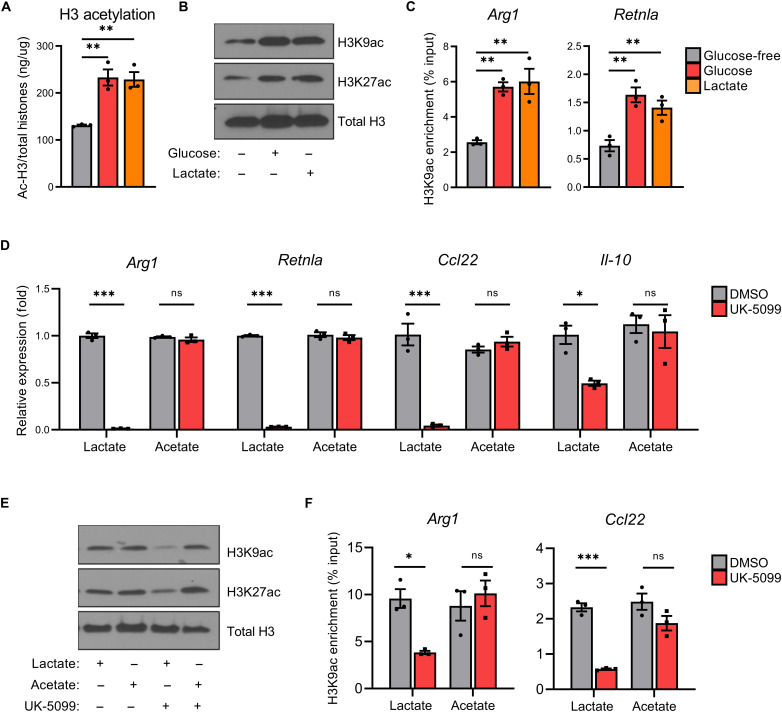
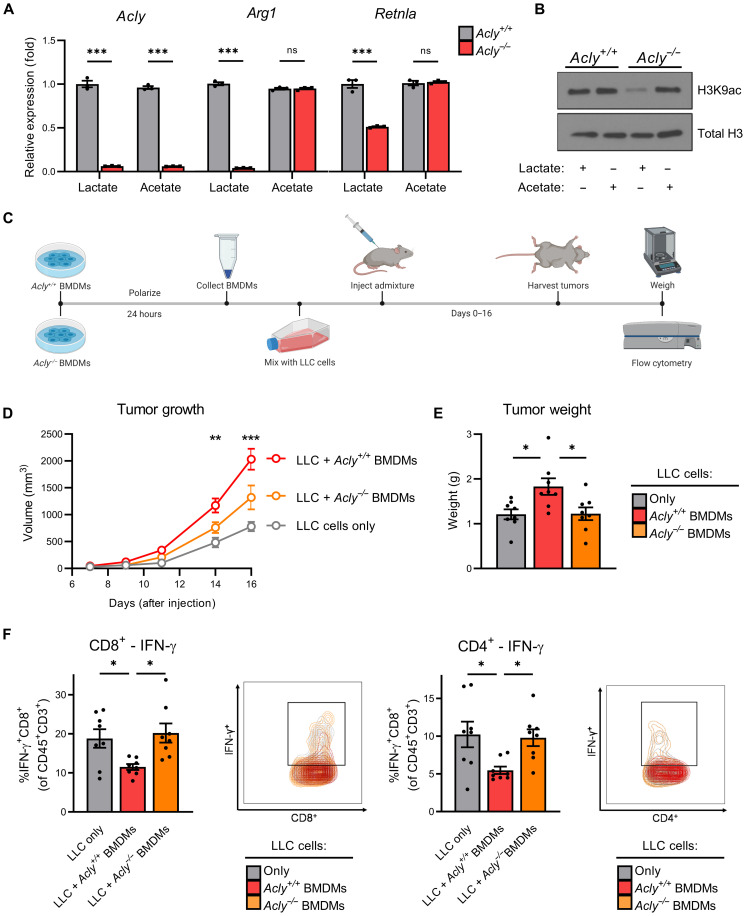
Lactate accumulation is a hallmark of solid cancers and is linked to the immune suppressive phenotypes of tumor-infiltrating immune cells. We report herein that interleukin-4 (IL-4)–induced M0 → M2 macrophage polarization is accompanied by interchangeable glucose- or lactate-dependent tricarboxylic acid (TCA) cycle metabolism that directly drives histone acetylation, M2 gene transcription, and functional immune suppression. Lactate-dependent M0 → M2 polarization requires both mitochondrial pyruvate uptake and adenosine triphosphate–citrate lyase (ACLY) enzymatic activity. Notably, exogenous acetate rescues defective M2 polarization and histone acetylation following mitochondrial pyruvate carrier 1 (MPC1) inhibition or ACLY deficiency. Lastly, M2 macrophage–dependent tumor progression is impaired by conditional macrophage ACLY deficiency, further supporting a dominant role for glucose/lactate mitochondrial metabolism and histone acetylation in driving immune evasion. This work adds to our understanding of how mitochondrial metabolism affects macrophage functional phenotypes and identifies a unique tumor microenvironment (TME)–driven metabolic-epigenetic link in M2 macrophages.


Figures

Fig. 1.
Fig. 1.. Macrophages maintain M2 polarization in TME-like conditions through mitochondrial pyruvate/lactate metabolism.
(A) Arg1 and Ccl22 expression of BMDMs starved in glucose-free (GF) media + 10% dialyzed fetal bovine serum (dFBS) (4 hours) before supplementation with glucose or lactate (as indicated), and then polarization with IL-4 (20 ng/ml) for 48 hours. ns, not significant. (B) M2-associated gene expression of BMDMs starved in GF media + 10% dFBS (4 hours) before supplementation with glucose (5 mM) or lactate (10 mM) and polarization with IL-4 (20 ng/ml) for 48 hours. (C) M2-associated gene expression of BMDMs starved in GF media + 10% dFBS (4 hours) before pretreatment ± UK-5099 (25 μM), supplementation with glucose (5 mM) or lactate (10 mM), and polarization with IL-4 (20 ng/ml) for 48 hours. DMSO, dimethyl sulfoxide; mAbs, monoclonal antibodies. (D) Proliferation (left) and interferon-γ (IFN-γ) production (right), with representative images, of CD8+ T cells from splenocytes cocultured for 3 days with BMDMs that were pretreated ± UK-5099 (25 μM) and polarized with IL-4 (20 ng/ml) or vehicle control [phosphate-buffered saline (PBS)] for 24 hours. Data are presented as means ± SEM and represent at least three independent experiments. *P ≤ 0.05, **P ≤ 0.01, ***P ≤ 0.001 by one-way analysis of variance (ANOVA) (A, B, and D) or two-way ANOVA (C) with Tukey’s post-test. CFSE+, carboxyfluorescein diacetate succinimidyl ester–positive.
Fig. 2.
Fig. 2.. M2 macrophages actively metabolize lactate within the mitochondrial TCA cycle.
(A) Trace, (B) (left) basal OCR, (middle) maximal OCR, and (right) SRC of BMDMs pretreated ± UK-5099 (25 μM) and then polarized with IL-4 (20 ng/ml) or vehicle control (PBS) for 24 hours before extracellular flux analysis with oligomycin (oligo), carbonyl cyanide p-trifluoromethoxyphenylhydrazone (FCCP), and rotenone plus antimycin A (Rot/Ant). Fractional enrichment of (C) lactate (left), pyruvate (middle), and citrate (right) in BMDMs starved in GF media + 10% dFBS (4 hours) before pretreatment with UK-5099 (25 μM), supplementation with 13C-lactate (10 mM), and then polarization with IL-4 (20 ng/ml) for 6 hours. (D) Cumulative comparison of unlabeled (M0) versus labeled lactate (M1 to M2), pyruvate (M1 to M2), and citrate (M1 to M6). (E) Metabolic influx of lactate derived carbons into the TCA cycle and (F) percent dilution of M2- and total- (M2 to M6) citrate labeling into α-ketoglutarate (α-KG), as determined by 1–fractional enrichment (FE) of α-KG/citrate, in BMDMs treated as previously indicated. Data are presented as means ± SEM of four (A and B) or three (C to F) replicates. *P ≤ 0.05, **P ≤ 0.01, ***P ≤ 0.001 by two-way ANOVA (A to C) or Student’s t test (E).
Fig. 3.
Fig. 3.. Mitochondrial lactate metabolism supports M2 polarization through ACLY-dependent histone acetylation.
(A) Total acetylated histone H3 enzyme-linked immunosorbent assay, (B) lysine residue–specific acetylation immunoblot, and (C) H3K9ac ChIP of BMDMs starved in GF media + 10% dFBS (4 hours) before supplementation with glucose (5 mM) or lactate (10 mM) and polarization with IL-4 (20 ng/ml) for 6 hours. (D) M2 gene expression, (E) lysine residue–specific acetylation, and (F) H3K9ac ChIP of BMDMs starved in GF media + 10% dFBS (4 hours) before pretreatment ± UK-5099 (25 μM), supplementation with lactate (10 mM) or acetate (10 mM), and polarization with IL-4 (20 ng/ml) for 48 (D) or 6 hours (E and F). Data are presented as means ± SEM and represent at least three experiments. *P ≤ 0.05, **P ≤ 0.01, ***P ≤ 0.001 by one-way ANOVA (A and C) or two-way ANOVA (D and F) with Tukey’s post-test.
Fig. 4.
Fig. 4.. ACLY is required for maximal M2 macrophage polarization and tumor progression.
(A) M2 gene expression and (B) lysine residue–specific acetylation of Acly+/+ and Acly−/− BMDMs starved in GF media + 10% dFBS (4 hours) before supplementation with lactate (10 mM) or acetate (10 mM) and polarization with IL-4 (20 ng/ml) for 48 (A) or 6 hours (B). (C) Schematic works flow of in vivo tumor admixture model. (D) Growth and (E) weight of tumors consisting of LLC cells only, LLC cells + M2-polarized Acly+/+ BMDMs, or LLC cells + M2-polarized Acly−/− BMDMs. (F) IFN-γ production in CD8+ cytotoxic T cells (left) and CD4+ helper T cells (right) in the respective tumors. Data are presented as means ± SEM of three (A and B) or eight (D to F) replicates. *P ≤ 0.05, **P ≤ 0.01, ***P ≤ 0.001 by two-way ANOVA (B) or one-way ANOVA (D to F) with Tukey’s post-test.

References

    1. Warburg O., On the origin of cancer cells. Science 123, 309–314 (1956). - PubMed
    1. Warburg O., On respiratory impairment in cancer cells. Science 124, 269–270 (1956). - PubMed
    1. Certo M., Tsai C.-H., Pucino V., Ho P.-C., Mauro C., Lactate modulation of immune responses in inflammatory versus tumour microenvironments. Nat. Rev. Immunol. 21, 151–161 (2021). - PubMed
    1. Angelin A., Gil-de-Gómez L., Dahiya S., Jiao J., Guo L., Levine M. H., Wang Z., Quinn W. J. III, Kopinski P. K., Wang L., Akimova T., Liu Y., Bhatti T. R., Han R., Laskin B. L., Baur J. A., Blair I. A., Wallace D. C., Hancock W. W., Beier U. H., Foxp3 reprograms T cell metabolism to function in low-glucose, high-lactate environments. Cell Metab. 25, 1282–1293.e7 (2017). - PMC - PubMed
    1. Zhang D., Tang Z., Huang H., Zhou G., Cui C., Weng Y., Liu W., Kim S., Lee S., Perez-Neut M., Ding J., Czyz D., Hu R., Ye Z., He M., Zheng Y. G., Shuman H. A., Dai L., Ren B., Roeder R. G., Becker L., Zhao Y., Metabolic regulation of gene expression by histone lactylation. Nature 574, 575–580 (2019). - PMC - PubMed

LinkOut - more resources