. 2021 Nov 12;7(46):eabk0271.
doi: 10.1126/sciadv.abk0271. Epub 2021 Nov 12.

Cell size is a determinant of stem cell potential during aging

Affiliations

Cell size is a determinant of stem cell potential during aging

Jette Lengefeld et al. Sci Adv. .

Abstract

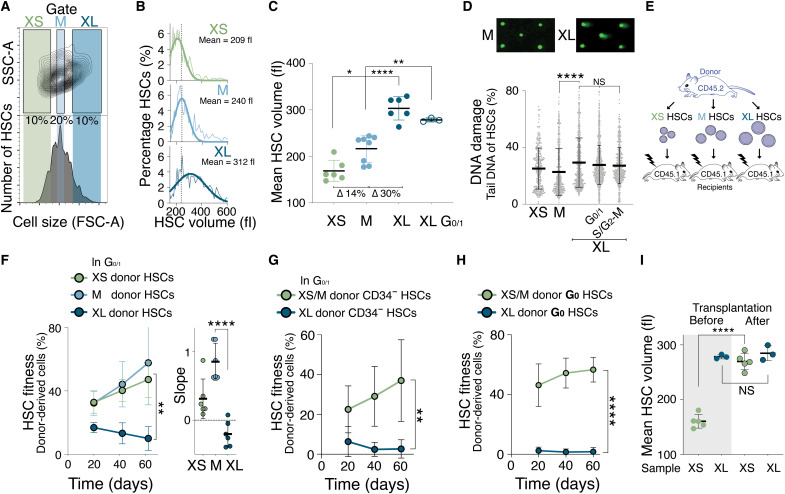
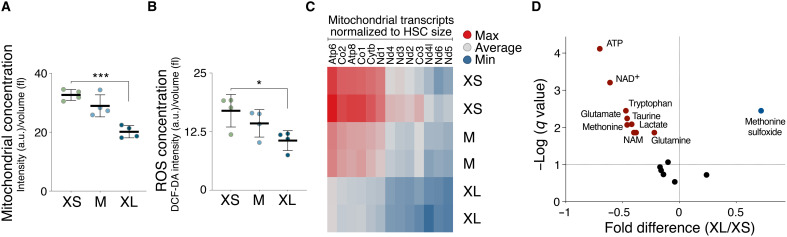
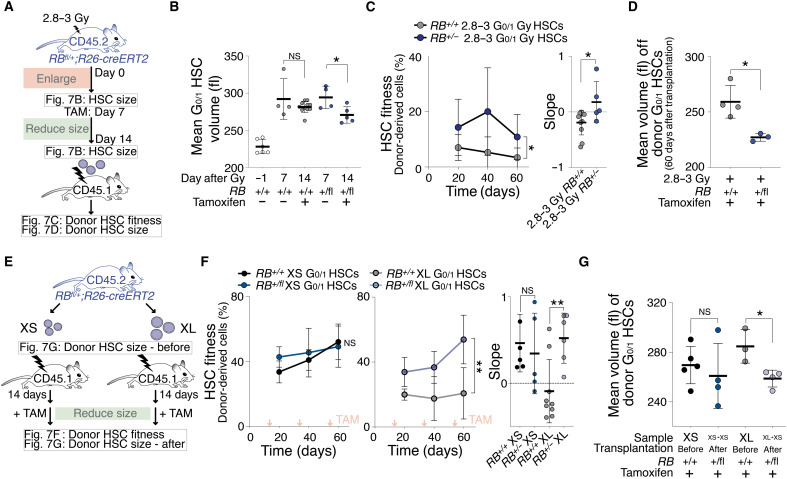
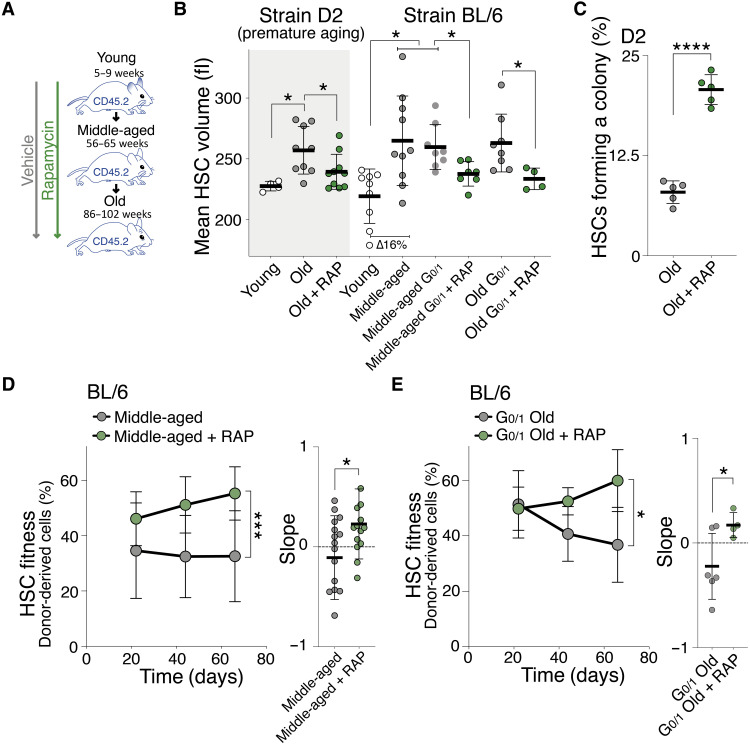
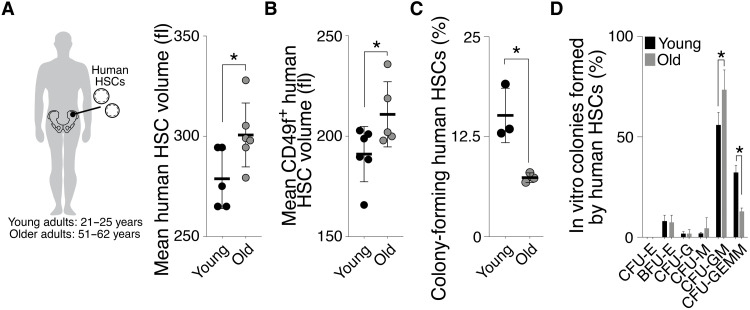
Stem cells are remarkably small. Whether small size is important for stem cell function is unknown. We find that hematopoietic stem cells (HSCs) enlarge under conditions known to decrease stem cell function. This decreased fitness of large HSCs is due to reduced proliferation and was accompanied by altered metabolism. Preventing HSC enlargement or reducing large HSCs in size averts the loss of stem cell potential under conditions causing stem cell exhaustion. Last, we show that murine and human HSCs enlarge during aging. Preventing this age-dependent enlargement improves HSC function. We conclude that small cell size is important for stem cell function in vivo and propose that stem cell enlargement contributes to their functional decline during aging.


Figures

Fig. 1.
Fig. 1.. Cellular enlargement contributes to DNA damage–induced fitness decline in HSCs.
(A) Mean volume (fl) of HSCs obtained from vehicle (n = 6), sublethally irradiated (3 Gy, n = 4), G0/1 2.8 to 3 Gy (n = 11), rapamycin-treated (RAP, n = 4), and RAP + 3 Gy–treated (n = 7) mice 2 weeks after irradiation (∆ = difference). (B) Measurement of DNA damage using CometChip: percentage tail DNA of HSCs (%) isolated from mice 2 weeks after treatment with vehicle, 3 Gy, RAP, or 3 Gy + RAP (n ≥ 166). (C) Reconstitution assay: Donor (CD45.2) mice were pretreated with RAP or vehicle for 2 weeks, sublethally irradiated (3 Gy), and treated with RAP (n; donors = 12, recipients = 8) or vehicle (n; donors = 12, recipients = 15) for another 2 weeks before 1000 CD45.2 HSCs were isolated and transplanted into lethally irradiated recipient mice. Control donor HSCs were not treated (control, n; donors = 6, recipients = 9) or treated with RAP without irradiation (control, n; donors = 3, recipients = 5). Recipient mice were not treated with RAP after reconstitution. Percentage of donor-derived white blood cells in recipients and slope of reconstitution kinetics over time were determined.
Fig. 2.
Fig. 2.. The Cdk4/6 inhibitor PD enlarges HSCs, causing their decline in reconstitution potential.
(A) Mean volume (fl) of HSCs isolated from mice treated with vehicle (n = 6), Cdk4/6 inhibitor (PD, n = 10), RAP (n = 4), or Cdk4/6 inhibitor + RAP (n = 5) for 85 days (∆ = difference). Same control as in Fig. 1A. (B) DNA damage in CometChip: percentage tail DNA of HSCs (%) isolated from mice treated with vehicle, Cdk4/6 inhibitor (PD), RAP, or Cdk4/6 inhibitor + RAP (n ≥ 552). (C) Reconstitution assay: CD45.2 mice were treated with vehicle (n; donors = 5, recipients = 8), Cdk4/6 inhibitor (PD, n; donors = 5, recipients = 7), RAP (n; donors = 5, recipients = 8), or Cdk4/6 inhibitor + RAP (n; donors = 5, recipients = 5) for 85 days before their HSCs were isolated for transplantation into lethally irradiated CD45.1 recipient mice. No drug treatment was performed after the reconstitution. Percentage (%) of donor-derived white blood cells in recipient and slope of reconstitution kinetics were determined over time. (D) Experimental strategy to determine the role of cell size for HSC fitness: If size determinates fitness, then similarly sized HSCs are expected to exhibit a similar reconstitution potential, irrespective of whether HSCs were treated with vehicle or Cdk4/6 inhibitor (PD). (E) Reconstitution assay: 600 M- or XL-sized HSCs of CD45.2 donor mice treated with vehicle (n; donors = 6, recipients ≥7) or Cdk4/6 inhibitor (PD, n; donors = 9, recipients M = 12, XL = 9) were transplanted into lethally irradiated recipient mice (CD45.1), which were not treated with drugs after the reconstitution. Percentage (%) of donor-derived white blood cells in recipients and slope of reconstitution kinetics were determined over time.
Fig. 3.
Fig. 3.. mTOR hyperactivation enlarge HSCs, contributing to their fitness decline.
(A) Mean volume (fl) of TSC1+/+ (n = 6), TSC1−/− (n = 5), and G0/1 TSC1−/− HSCs (n = 3) 60 days after vehicle or tamoxifen treatment. Same control as in Fig. 1A. (B) CometChip assay to measure DNA damage: Percentage tail DNA of HSCs (%) from TSC1+/+ (n = 769) or TSC1−/− (n = 838) mice. (C) A total of 800 HSCs from TSC1fl/fl;R26-creERT2 mice were transplanted into lethally irradiated recipient mice and were allowed to home to the bone. The recipients were then treated with vehicle or tamoxifen to induce TSC1 excision 3 and 14 days after transplantation. (D) Reconstitution assay described in (C): Percentage (%) of TSC1+/+ (n; donors = 7, recipients = 11) and TSC1−/− (n; donors = 7, recipients = 7) donor HSC–derived white blood cells in recipients and slope of reconstitution kinetics were determined over time. Red arrows indicate recipient treatment with tamoxifen (TAM) or vehicle.
Fig. 4.
Fig. 4.. High cell division frequency enlarges HSCs, contributing to their fitness decline.
(A) Mean volume (fl) of G0/1 HSCs from age-matched virgin (n = 3) and breeding (n = 5) mice. (B) Reconstitution assay: A total of 600 G0/1 HSCs from age-matched virgin (n; donors = 6, recipients = 9) or breeding (n; donors = 5, recipients = 6) donor (CD45.2) mice were transplanted into lethally irradiated recipients. Donor-derived white blood cells (%) in recipients and slope of reconstitution kinetics are shown. (C) Transplantation experiment. (D and E) Following transplantation, recipients were treated with RAP or vehicle. HSC volume was analyzed before transplantation and 80 days after the 1° and 2° transplantation. BM from 1° transplant was used for 2° transplant. (D) Mean volume (fl) of donor HSCs before transplantation (n = 9) and after recipient treatment with vehicle (n = 9), vehicle G0/1 (n = 3), or RAP (n = 8) treatment during 1° or 2° transplantation (n = 4). (E) Reconstitution assay: Donor HSCs were transplanted into lethally irradiated recipients, which were then treated with vehicle (n; donors = 10, recipients = 11) or RAP (n; donors = 10, recipients = 14). Donor-derived white blood cells (%) in recipients and slope of reconstitution kinetics were determined. (F) Experimental overview: rtTa;tetO-H2B-GFP mice (“before pulse”) were treated to induce H2B-GFP (“pulse”). Afterward, HSCs were transplanted into recipients, which were treated with vehicle (“chase-vehicle”) or RAP (“chase-RAP”). Control HSCs from donor rtTa;tetO-H2B-GFP animals were analyzed after the pulse (“chase-control”). (G) Experiment as in (F): GFP intensity (a.u., arbitrary unit) of G0/1 HSCs from before pulse (n = 3), pulse (n = 3), chase-control (n = 3), chase-vehicle (n = 5), and chase-RAP (n = 3) mice. (H) Experiment as in (F): Mean volume (fl) of G0/1 HSCs from before pulse (n = 3), pulse (n = 3), chase-control (n = 3), chase-vehicle (n = 3), and chase-RAP (n = 3) mice.
Fig. 5.
Fig. 5.. Naturally large HSCs are impaired in reconstituting the hematopoietic compartment.
(A) Size distribution of HSCs as determined by forward scatter (FSC-A). Gates used to isolate small (XS), medium (M), and large (XL) HSCs are indicated. SSC-A, side scatter. (B) HSCs (%) per volume (fl) isolated using the XS, M, or XL gates shown in (A). Gaussian fit was used to determine mean cell volume. Dotted line marks the mean of M-sized HSCs. (C) Mean volume (fl) of HSCs isolated using the XS (n = 6), M (n = 8), XL (n = 6), or G0/1 XL (n = 3) gates (∆ = difference). (D) CometChip assay to measure DNA damage: Percentage tail DNA of XS-, M- and XL-, G0/1 XL- and S/G2-M XL-sized HSCs (n > 323 cells measured per condition). (E) Schematic of reconstitution experiments in (F) to (H): A total of 600 differently sized donor-derived HSCs were transplanted into lethally irradiated recipients. (F) Reconstitution assay: Donor-derived (CD45.2) white blood cells (%) in recipients after transplantation of XS (n; donors = 5, recipients = 6), M (n; donors = 5, recipients = 6), or XL (n; donors = 5, recipients n = 6) G0/1 Hoechst-labeled donor HSCs. Slope of reconstitution kinetics is shown. (G) Reconstitution assay: Donor-derived (CD45.2) white blood cells (%) in recipients after transplantation of XS HSCs (n = 6) or XL donor G0/1 CD34 HSCs (n = 6). (H) Reconstitution assay: Donor-derived (CD45.2) white blood cells (%) in recipients after transplantation of XS/M (n; donors = 5, recipients = 5) or XL G0 donor HSCs (n; donors = 5, recipients = 5) from Ki67-RFP mice. (I) Mean volume (fl) of XS- or G0/1 XL-sized CD45.2 HSCs before transplantation and their volume at 80 days after transplantation (n ≥ 3). Before data as in (C) and after as in Fig. 7G.
Fig. 6.
Fig. 6.. Large HSCs exhibit altered metabolism.
(A) Mitochondrial concentration [intensity (a.u.)/volume (fl) in XS, M, and XL HSCs (n = 4)]. (B) ROS concentration dichlorodihydrofluorescein diacetate (DCF-DA) intensity (a.u.)/volume (fl) in XS, M, and XL HSCs (n = 4). (C) Heatmap of expression levels of mitochondrial genes in differently sized G0/1 HSCs (n = 2). (D) Metabolites were analyzed using liquid chromatography–tandem mass spectrometry: Volcano plots of metabolite changes induced by in G0/1 XL HSCs compared to G0/1 XS HSCs. Red/blue circles show metabolites significantly depressed/elevated, and symbols in black show unchanged metabolites (n = 7). NAD+, nicotinamide adenine dinucleotide. NAM, Nicotinamide.
Fig. 7.
Fig. 7.. Reducing cellular size restores HSC fitness.
(A) RB+/+;R26-cre or RBfl/+;R26-cre mice were DNA-damaged (2.8 to 3 Gy) to measure HSC volume (B) and treated with tamoxifen reducing HSC size. Afterward, HSC volume was measured (B) and 700 G0/1 donor HSCs were transplanted into lethally irradiated recipients to measure their fitness (C) and volume (D) in recipients. (B) Mean volume (fl) of G0/1 HSCs from RB+/+;R26-cre or RBfl/+;R26-cre mice after 2.8 to 3 Gy (n = 4) and tamoxifen treatment (n = 5 to 11) as described in (A). Day −1 = before irradiation. Same control and 2.8- to 3-Gy sample as in Fig. 1A. (C) Reconstitution assay: White blood cells (%) derived from donor RB+/+;R26-cre (n; donors = 6, recipients = 11) or RBfl/+;R26-cre (n; donors = 5, recipients = 5) 2.8- to 3-Gy G0/1 HSCs that were treated before transplantation with tamoxifen as described in (A). Slope of reconstitution kinetics was determined. (D) Mean volume (fl) of recipient-derived donor RB+/+;R26-cre (n = 4) or RBfl/+;R26-cre (n = 3) 2.8- to 3-Gy G0/1 HSCs that were treated before transplantation with tamoxifen as described in (A). (E) Experiment schematic: A total of 600 XS- or XL-sized G0/1 HSCs from RB+/+;R26-cre or RBfl/+;R26-cre mice were transplanted into lethally irradiated recipients. Afterward, recipients were treated with tamoxifen to reduce HSC size and to measure fitness (F) and volume (G) of donor G0/1 HSCs in recipients. (F) Reconstitution assay: Percentage (%) of donor-derived white blood cells in recipients and slope of reconstitution as described in (E) (n; donors = 4, recipients XL-RB fl/+ = 6, XS-RB fl/+ = 5, XL-WT = 9, XS-WT = 5). Red arrows indicate tamoxifen treatment. (G) Mean volume (fl) of donor G0/1 HSCs after treatment with tamoxifen from recipients that were reconstituted with XS- or XL-sized G0/1 donor HSCs from RB+/+;R26-cre or RBfl/+;R26-cre mice (n ≥ 3).
Fig. 8.
Fig. 8.. Enlargement of HSCs contributes to fitness decline during aging.
(A) Mice were treated with vehicle or RAP during aging (from week 8 onward), and HSCs were analyzed at 32 weeks (D2 mice) for volume (B) and in vitro colony formation (C) or at 56 to 65 weeks (middle aged, BL/6) and 86 to 102 (old, BL/6) weeks for reconstitution capacity (D and E). (B) Mean volume (fl) of HSCs from 7-week-old (young, n = 4), 32-week-old (old, n = 9), or old + RAP (n = 10) early-aging D2 mice and from 5- to 9-week-old (young, n = 9), 56- to 65-week (middle-aged, n = 10), middle-aged G0/1 (n = 8), middle-aged + RAP (n = 7), 86- to 102-week-old (old, n = 8), or old + RAP (n = 4) BL/6 mice. RAP treatment started at 8 weeks. Same WT BL/6 control as in Fig. 4D. (C) Colony-forming efficiency in vitro: HSCs from D2 mice treated with vehicle or rapamycin during aging were analyzed for colony-forming potential in vitro (%, n = 5). (D) Reconstitution assay: A total of 800 donor-derived HSCs from middle-aged (56 to 65 weeks) BL/6 mice treated with vehicle (n; donors = 12, recipients = 16) or rapamycin (n; donors = 12, recipients = 14) during their life were transplanted into lethally irradiated recipients. Percentage (%) of donor-derived white blood cells in recipients and slope of the reconstitution kinetics were measured over time. (E) Reconstitution assay: A total of 1000 donor-derived G0/1 HSCs from old (86 to 102 weeks) BL/6 mice treated with vehicle (n; donors = 6, recipients = 6) or rapamycin (n; donors = 4, recipients = 4) during their life were transplanted into lethally irradiated recipients. Percentage (%) of donor-derived white blood cells in recipients and slope of the reconstitution kinetics were measured.
Fig. 9.
Fig. 9.. HSCs are larger in aged humans.
(A and B) Mean volume (fl) of human HSCs (Lin, CD34+, CD90+, CD38, CD45RA with and without CD49f+) from young (21 to 25 years, n ≥ 5) or old (51 to 62 years, n ≥ 5) individuals. (C) Colony-forming efficiency in vitro: Human HSCs from young (21 to 25 years) or old (51 to 62 years) individuals were plated onto methylcellulose, and the percentage of HSCs forming a colony was quantified after 21 days (n = 3). (D) Differentiation assay in vitro: Percentages of human GEMM, GM, or single lineages (G, M, and E) colonies per plate were counted after 21 days (n = 3). CFU, colony-forming units; BFU, burst-forming unit; GEMM, = granulocyte, erythroid, macrophage, megakaryocyte; G, granulocytes; M, macrophages. E, erythroid.

Comment in

  • Big cells, small potential.
    Strzyz P. Strzyz P. Nat Rev Mol Cell Biol. 2022 Feb;23(2):91. doi: 10.1038/s41580-021-00439-6. Nat Rev Mol Cell Biol. 2022. PMID: 34824454 No abstract available.

References

    1. Yamamoto R., Wilkinson A. C., Ooehara J., Lan X., Lai C. Y., Nakauchi Y., Pritchard J. K., Nakauchi H., Large-scale clonal analysis resolves aging of the mouse hematopoietic stem cell compartment. Cell Stem Cell 22, 600–607.e4 (2018). - PMC - PubMed
    1. Saxton R. A., Sabatini D. M., mTOR signaling in growth, metabolism, and disease. Cell 168, 960–976 (2017). - PMC - PubMed
    1. Pietras E. M., Warr M. R., Passegue E., Cell cycle regulation in hematopoietic stem cells. J. Cell Biol. 195, 709–720 (2011). - PMC - PubMed
    1. Kamminga L. M., van Os R., Ausema A., Noach E. J., Weersing E., Dontje B., Vellenga E., de Haan G., Impaired hematopoietic stem cell functioning after serial transplantation and during normal aging. Stem Cells 23, 82–92 (2005). - PubMed
    1. Campisi J., Aging, cellular senescence, and cancer. Annu. Rev. Physiol. 75, 685–705 (2013). - PMC - PubMed