. 2021 Nov 12;7(46):eabj0722.
doi: 10.1126/sciadv.abj0722. Epub 2021 Nov 12.

Global ubiquitylation analysis of mitochondria in primary neurons identifies endogenous Parkin targets following activation of PINK1

Affiliations

Global ubiquitylation analysis of mitochondria in primary neurons identifies endogenous Parkin targets following activation of PINK1

Odetta Antico et al. Sci Adv. .

Abstract

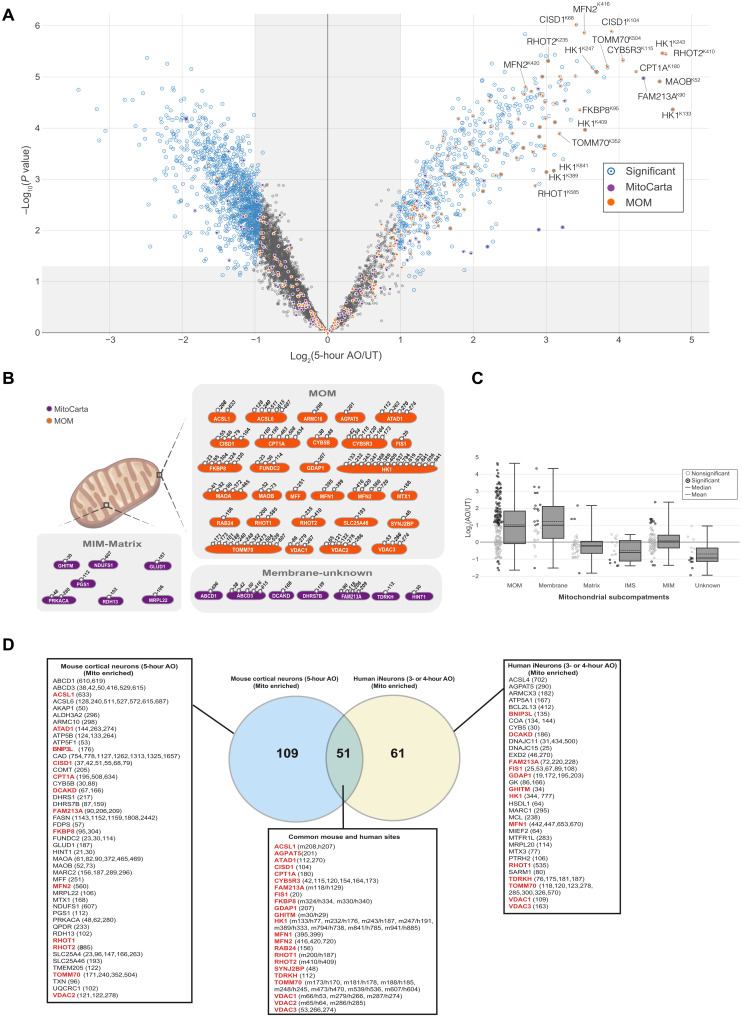
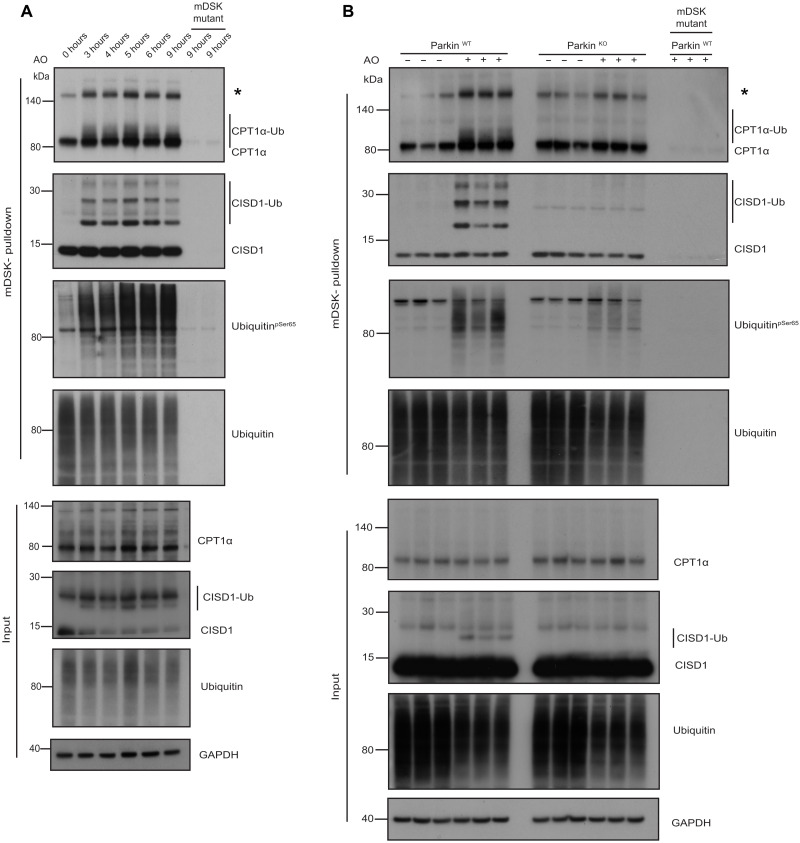
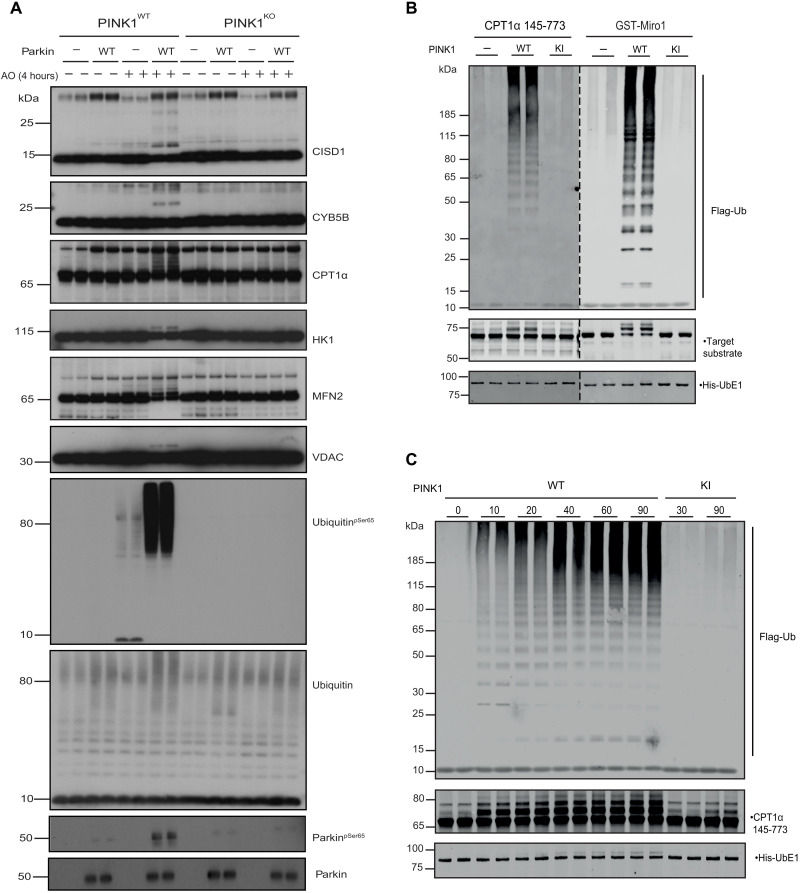
How activation of PINK1 and Parkin leads to elimination of damaged mitochondria by mitophagy is largely based on cell lines with few studies in neurons. Here, we have undertaken proteomic analysis of mitochondria from mouse neurons to identify ubiquitylated substrates of endogenous Parkin. Comparative analysis with human iNeuron datasets revealed a subset of 49 PINK1 activation–dependent diGLY sites in 22 proteins conserved across mouse and human systems. We use reconstitution assays to demonstrate direct ubiquitylation by Parkin in vitro. We also identified a subset of cytoplasmic proteins recruited to mitochondria that undergo PINK1 and Parkin independent ubiquitylation, indicating the presence of alternate ubiquitin E3 ligase pathways that are activated by mitochondrial depolarization in neurons. Last, we have developed an online resource to search for ubiquitin sites and enzymes in mitochondria of neurons, MitoNUb. These findings will aid future studies to understand Parkin activation in neuronal subtypes.


Figures

Fig. 1.
Fig. 1.. PINK1 signaling in mouse cortical neurons.
(A) Experimental workflow in primary mouse neurons. E16.5 cortical neurons were cultured for 21 DIV, and membrane enrichment was performed after mitochondrial depolarization induced with 10 μM antimycin A combined with 1 μM oligomycin for 5 hours. DMSO, dimethyl sulfoxide; m/z, mass/charge ratio. (B) Copy number: Rank abundance plot depicting the protein copy number abundance of cortical neurons. The x axis denotes copy number abundance rank, and the y axis denotes log-transformed copy number intensity. PD-linked genes, neuronal markers, and PINK1-Parkin pathway components are highlighted in red, blue, and green colored circles and text, respectively. (C) Immunoblots showing comparative analysis of phospho-Ser65 ubiquitin levels in primary cortical neuron cultures from wild-type (WT) and PINK1 KO mice. Cultures were stimulated with antimycin A and oligomycin for 5 hours before membrane enrichment. Phospho-Ser65 ubiquitin was detected by immunoblotting after ubiquitin enrichment by incubating with ubiquitin-binding resin derived from Halo-multiDSK (mDSK). Affinity captured lysates were also subjected to immunoblotting with total ubiquitin antibody. Immunoprecipitation (IP) showed PINK1 protein stabilization after mitochondrial depolarization. Phospho-Ser111 Rab8A and phospho-Ser65 Parkin were detected by immunoblotting. GAPDH, glyceraldehyde-3-phosphate dehydrogenase. Lysates were also subjected to immunoblotting with indicated antibodies for loading and protein expression controls. IB, immunoblot. (D and E) C57BL/6J mouse cortical neurons (DIV 21) were depolarized with AO for 5 hours, and whole-cell lysates were subjected to Pt-PRM (parallel reaction monitoring) quantification. Abundance (fmol) for individual ubiquitin chain linkage types. Untreated (UT) (D) and percentage of phospho-Ser65 ubiquitin (C) is plotted. Error bars represent SEMs (n = 3). n.d., not determined.
Fig. 2.
Fig. 2.. Global ubiquitylation analysis of mitochondria in neurons upon mitochondrial depolarization.
(A) C57BL/6J primary cortical neurons were depolarized with AO (5 hours), and membrane-enriched lysates were subjected to diGLY capture proteomics. Fold increase for individual ubiquitylated targets is shown in the volcano plot. The x axis specifies the fold changes, and the y axis specifies the negative logarithm to the base 10 of the t test P values. Dots (1606) reflect the significant hits [Welch’s t test (S0 = 2), corrected for multiple comparison by permutation-based false discovery rate (FDR; 1%)]. Five hundred fifty-nine and 1047 dots represent ubiquitylated targets up-regulated or down-regulated after mitochondrial depolarization, respectively. diGLY peptide of proteins associated with mitochondria (MitoCarta 3.0) or MOM localization are indicated. (B) Schematic showing sites of ubiquitylation in mouse cortical neurons according to MitoCarta 3.0. Residue numbers for diGLY-modified Lys residues are shown. (C) Distribution of changes in diGLY peptides for proteins that localize in the mitochondrial subcompartments: matrix, MIM, MOM, IMS, membrane, and unknown (MitoCarta 3.0). (D) Venn diagram of overlapping diGLY sites observed in site observed for mitochondrial enriched mouse cortical neurons (5 hours after depolarization) and sites observed from mitochondrial enriched human iNeurons (3 or 4 hours after depolarization) (18). All peptides used were increased by at least twofold (log2 ratio > 1.0), with P < 0.05. diGLY sites or proteins common to mouse and human datasets are marked in red bold.
Fig. 3.
Fig. 3.. Global ubiquitylation analysis of mitochondria in neurons of PINK1 wild-type and KO neurons.
(A) Total protein abundance of membrane-enriched lysates in PINK1+/+ or PINK1−/− neurons. Fold increase for individual protein is shown in the volcano plot. The x axis specifies the fold changes, and the y axis specifies the negative logarithm to the base 10 of the t test P values [Welch’s t test (S0 = 0.585), corrected for multiple comparison by permutation-based FDR (5%)]. Proteins associated with mitochondria (MitoCarta 3.0) or MOM are indicated. (B) Abundance for phospho-Ser65 (top) or phospho-Ser57 (bottom) of ubiquitin (Ub) was quantified and plotted as fold change to untreated wild-type samples. Error bars represent SEMs (n = 3). Error bars represent SEMs (n = 3, 3, 3, and 2). (C and D) The same as (A) but diGLY-containing peptides derived from (C) PINK1+/+ or (D) PINK1−/− cells. (C) One hundred eighty-seven and 11 sites or (D) 26 and 0 sites, respectively, represent statistically significant ubiquitylated targets up-regulated or down-regulated after mitochondrial depolarization. [Welch’s t test (S0 = 1), corrected for multiple comparison by permutation-based FDR (1%)]. diGLY peptides associated with mitochondria (MitoCarta 3.0) or MOM are indicated. Square-shaped dots indicate diGLY peptides not normalized to its protein abundance (not determined).
Fig. 4.
Fig. 4.. Validation of Parkin-dependent substrates in cell-based studies.
(A) Time course analysis of CPT1α and CISD1 ubiquitylation following AO stimulation in C57BL/6J cortical neurons. Halo-multiDSK (mDSK) pulldown immunoprecipitated and inputs were subjected to immunoblot with anti-CPT1α, anti-CISD1, anti–phospho-Ser65 ubiquitin, and anti-ubiquitin antibodies. Asterisk (*) indicates high molecular weight CPT1α reactive species. (B) CPT1α and CISD1 ubiquitylation is abrogated in Parkin KO neurons. Membrane lysates of Parkin wild-type and KO cortical neurons after 5 hours of AO stimulation were subjected to ubiquitylated-protein capture by Halo-multiDSK (mDSK), before immunoblot with anti-CPT1α, anti-CISD1, anti–phospho-Ser65 ubiquitin and anti-ubiquitin antibodies. Relative inputs are shown at the bottom. Asterisk (*) indicates high molecular weight CPT1α reactive species.
Fig. 5.
Fig. 5.. Validation of Parkin-dependent substrates in in vitro studies.
(A) MEF PINK1 wild-type and KO were depolarized with AO for 4 hours; mitochondria were isolated and incubated with recombinant Parkin for in vitro ubiquitylation assay against endogenous mitochondrial substrates. Ubiquitylated proteins were detected with the indicated antibodies. (B and C) Parkin ubiquitylates CPT1α in vitro. (B) Recombinant CPT1α protein was assessed for ubiquitylation assay by Parkin with full-length PINK1 (WT), Kinase-inactive (KI), and water (-) as negative control. Miro1 recombinant protein was used as positive control. (C) Time course for CPT1α showed ubiquitylation mediated by Parkin in a time-dependent manner.

References

    1. Vafai S. B., Mootha V. K., Mitochondrial disorders as windows into an ancient organelle. Nature 491, 374–383 (2012). - PubMed
    1. Youle R. J., Mitochondria—Striking a balance between host and endosymbiont. Science 365, eaaw9855 (2019). - PubMed
    1. McFarland R., Taylor R. W., Turnbull D. M., A neurological perspective on mitochondrial disease. Lancet Neurol. 9, 829–840 (2010). - PubMed
    1. Johri A., Beal M. F., Mitochondrial dysfunction in neurodegenerative diseases. J. Pharmacol. Exp. Ther. 342, 619–630 (2012). - PMC - PubMed
    1. Montava-Garriga L., Ganley I. G., Outstanding questions in mitophagy: What we do and do not know. J. Mol. Biol. 432, 206–230 (2020). - PubMed