. 2021 Nov 12;6(65):eabl5053.
doi: 10.1126/sciimmunol.abl5053. Epub 2021 Nov 12.

Single-cell multiomics defines tolerogenic extrathymic Aire-expressing populations with unique homology to thymic epithelium

Affiliations

Single-cell multiomics defines tolerogenic extrathymic Aire-expressing populations with unique homology to thymic epithelium

Jiaxi Wang et al. Sci Immunol. .

Abstract

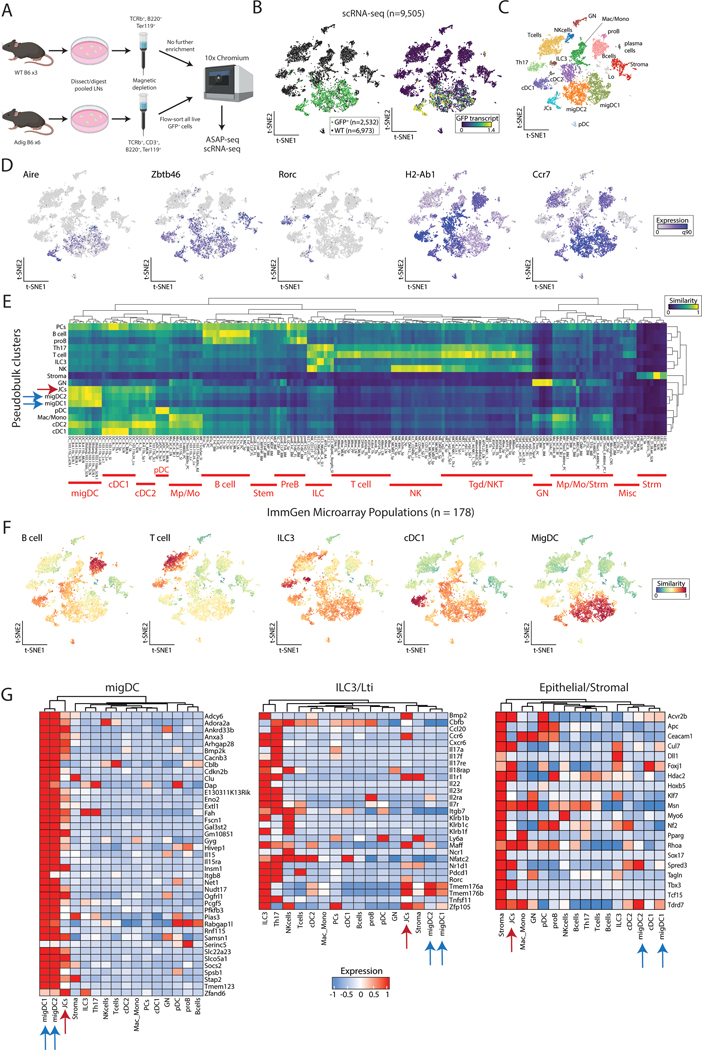
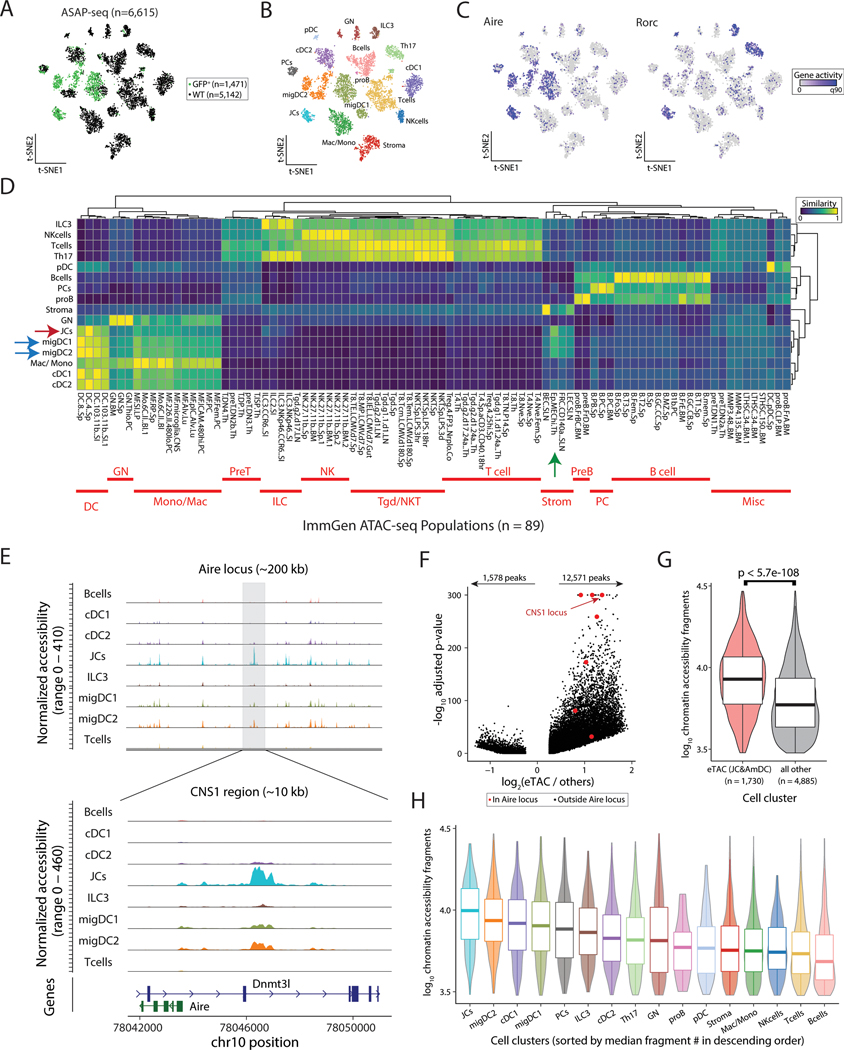
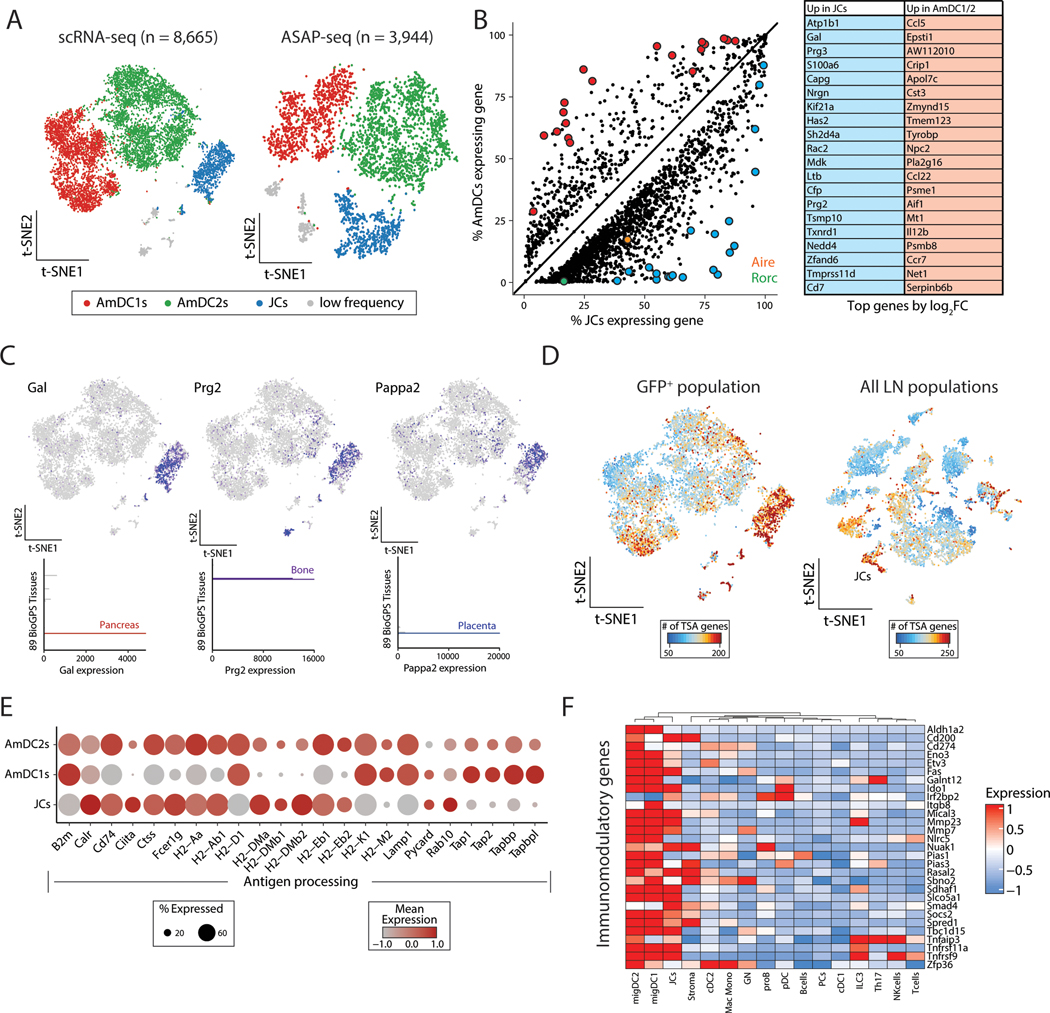
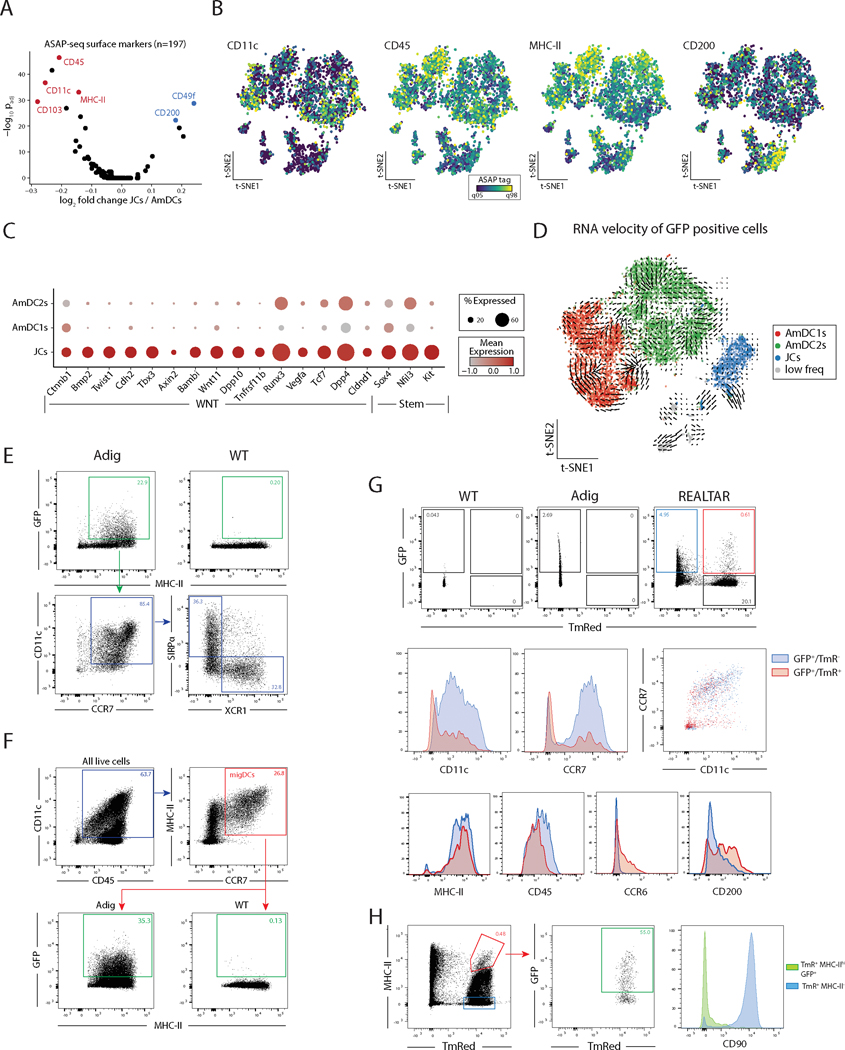
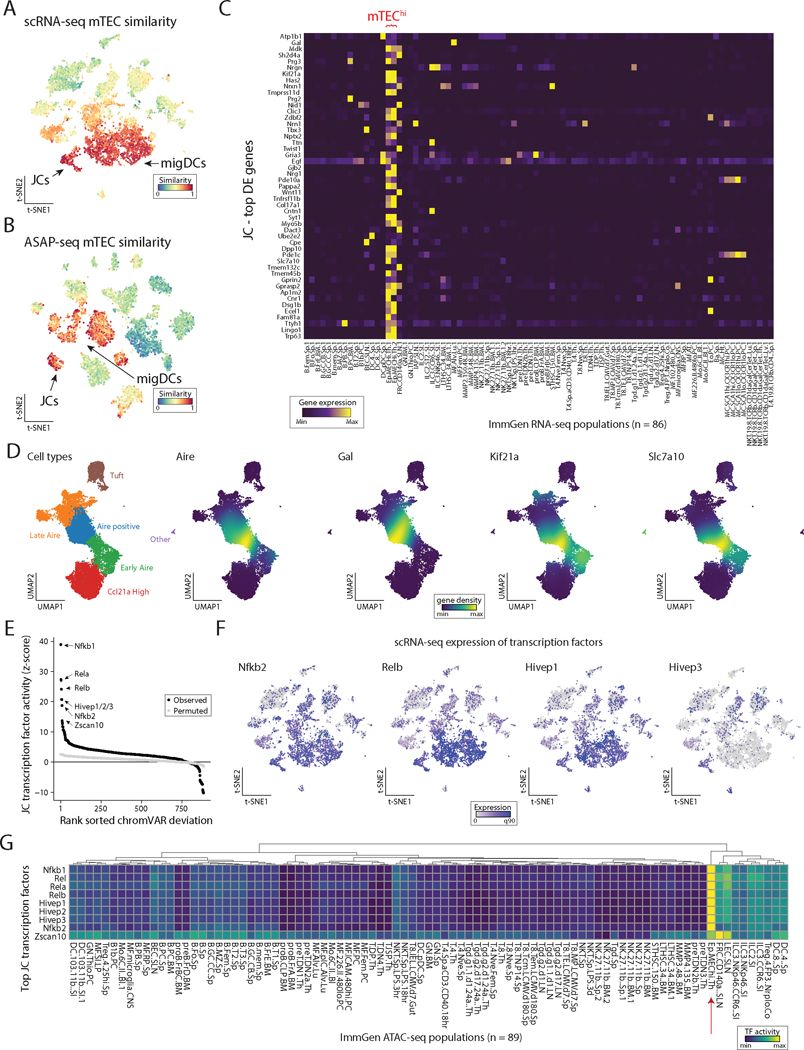
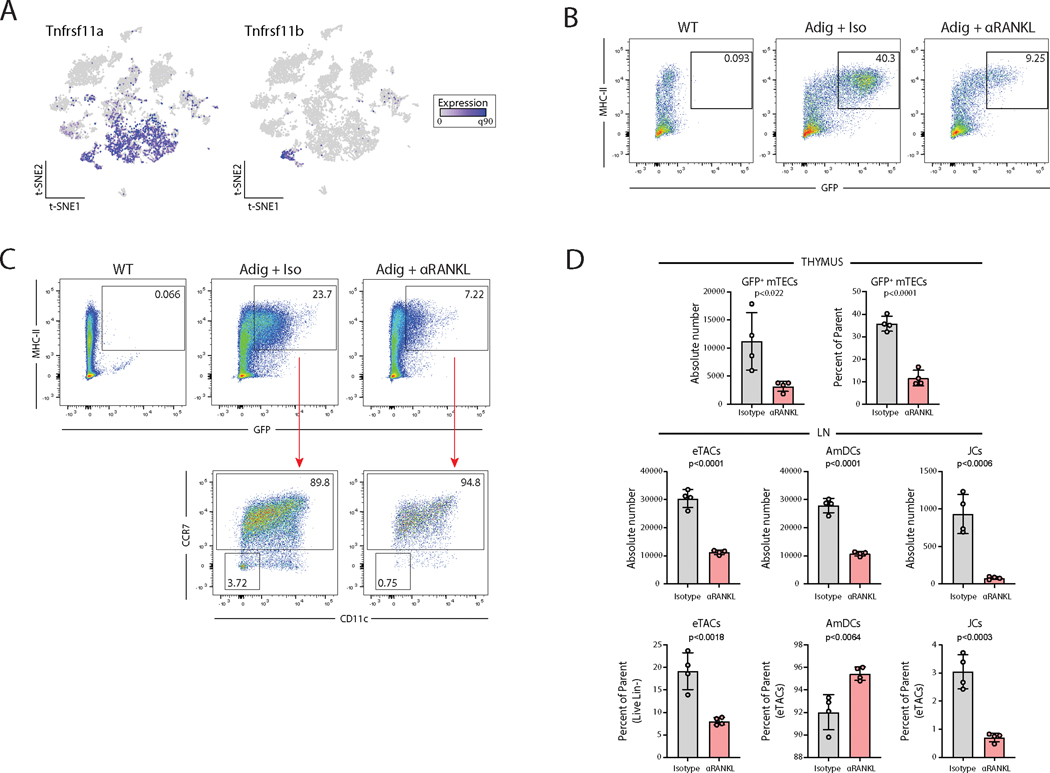
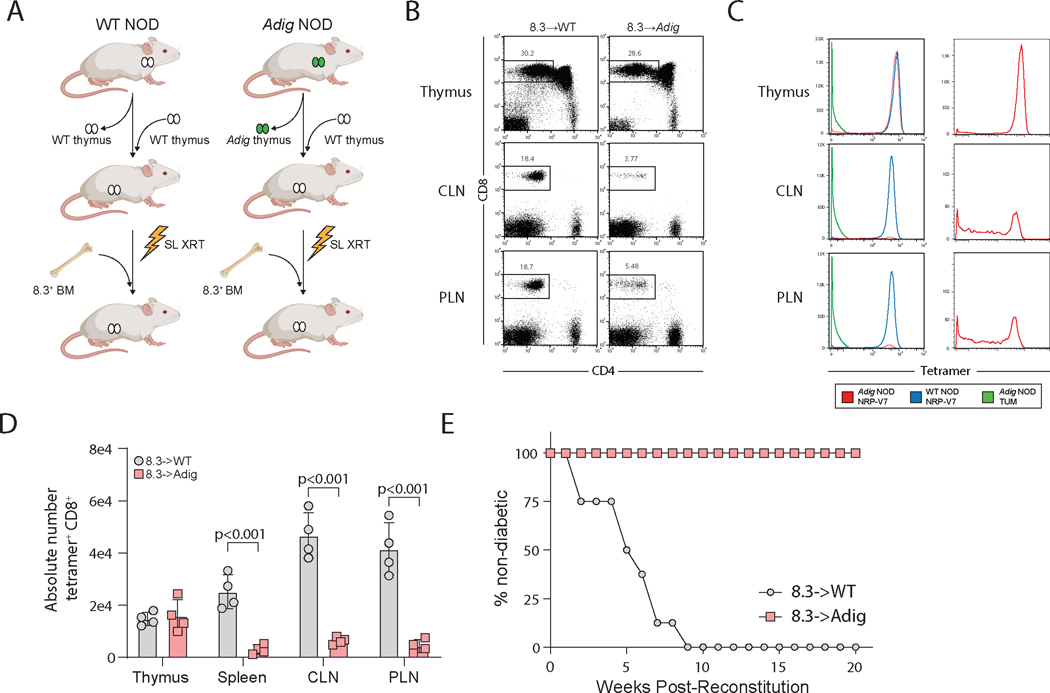
The autoimmune regulator (Aire), a well-defined transcriptional regulator in the thymus, is also found in extrathymic Aire-expressing cells (eTACs) in the secondary lymphoid organs. eTACs are hematopoietic antigen-presenting cells and inducers of immune tolerance, but their precise identity has remained unclear. Here, we use single-cell multiomics, transgenic murine models, and functional approaches to define eTACs at the transcriptional, genomic, and proteomic level. We find that eTACs consist of two similar cell types: CCR7+ Aire-expressing migratory dendritic cells (AmDCs) and an Airehi population coexpressing Aire and retinoic acid receptor–related orphan receptor γt (RORγt) that we term Janus cells (JCs). Both JCs and AmDCs have the highest transcriptional and genomic homology to CCR7+ migratory dendritic cells. eTACs, particularly JCs, have highly accessible chromatin and broad gene expression, including a range of tissue-specific antigens, as well as remarkable homology to medullary thymic epithelium and RANK-dependent Aire expression. Transgenic self-antigen expression by eTACs is sufficient to induce negative selection and prevent autoimmune diabetes. This transcriptional, genomic, and functional symmetry between eTACs (both JCs and AmDCs) and medullary thymic epithelium—the other principal Aire-expressing population and a key regulator of central tolerance—identifies a core program that may influence self-representation and tolerance across the spectrum of immune development.


Figures

Figure 1.
Figure 1.. Extrathymic Aire-expressing cells consist of distinct populations of migratory DC-like cells.
(A) Schematic of cell isolation and enrichment for scRNA-seq and ASAP-seq. (B) Reduced dimensionality representation of scRNA-seq data, indicating the GFP+ population and GFP transcript. (C) Annotated cell clusters of populations in scRNA-seq data. (D) Gene expression of selected transcripts used to define populations, including Aire and Rorc. (E) Hierarchical clustering of pseudobulk scRNA-seq clusters by all ImmGen microarray data using a scaled cosine similarity metric. Rows min-max normalized. ImmGen populations cluster identities annotated in red text as indicated. Aire-expressing populations are indicated with blue (migDC1/2) and red (JC) arrows. (F) Single-cell cosine similarity scores for scRNA-seq data using indicated ImmGen populations. (G) Gene expression heatmaps for selected gene sets, z-score-normalized per row. Aire-expressing populations are indicated with blue (migDC1/2) and red (JC) arrows.
Figure 2.
Figure 2.. Single-cell-chromatin accessibility supports the genomic identity of eTACs as myeloid populations with uniquely accessible chromatin.
(A) Reduced dimensionality representation of ASAP-seq data, indicating the GFP and WT sample origins. (B) Annotated cell clusters of populations in ASAP-seq data. (C) Gene activity scores of Aire and Rorc across ASAP t-SNE. (D) Hierarchical clustering of pseudobulk ASAP-seq clusters by all ImmGen ATAC-seq data using a scaled cosine similarity metric. Rows min-max normalized. ImmGen populations cluster identities annotated in red as indicated. Aire-expressing populations are indicated with blue (migDC1/2) and red (JC) arrows, and mTECs from the ImmGen database with a green arrow. (E) Accessible chromatin landscape near the Aire locus, including the previously described CNS1 region (bottom). (F) Volcano plot of differential accessibility peaks, indicating the number of peaks with greater (n=12,571) or less (n=1,578) accessibility in Aire expressing populations. Aire locus peaks in large red dots; CNS1 locus as indicated. (G) Comparison of number of accessible chromatin fragments between eTACs and non-eTAC populations in the LN by box/violin overlay. Statistical test: Mann-Whitney test. (H) Per-cluster abundance of accessible chromatin fragments/cluster, box/violin overlay, noting highest accessibility in JCs. Boxplots: center line, median; box limits, first and third quartiles; whiskers, 1.5× interquartile range.
Figure 3.
Figure 3.. Focused multiomic analysis of eTAC populations identifies broad transcriptional upregulation and antigen presentation in all eTACs with uniquely high TSA expression in JCs.
(A) Reduced dimensionality representation for all GFP+ scRNA-seq and ASAP-seq data. (B) Differential gene expression analyses of JCs (x-axis) and AmDCs (y-axis), with Aire (orange) and Rorc (green) highlighted. Top 20 genes are shown in the table on the right. (C) Expression of three tissue-specific antigen genes, Gal, Prg2, and Pappa2, differentially upregulated in JCs. The top represents expression in the GFP+ scRNA-seq data and the bottom bar graphs represent tissue-restricted expression as indicated from GeneAtlas tissue populations. (D) Number of tissue-specific antigen (TSA) genes for the GFP+ only (left) and all lymph node (right) populations, noting the relative abundance in JCs. (E) Dot plot of antigen processing and presentation gene set showing expression in GFP+ populations. (F) Heatmap of immunomodulatory genes across all lymph node populations from scRNA-seq data, z-score normalized per row.
Figure 4.
Figure 4.. Surface-marker multiomics combined with functional flow cytometry and lineage-tracing allows for identification and characterization of eTACs and their lineage relationships.
(A) Volcano plot of surface markers measured by ASAP-seq comparing JCs to AmDCs. (B) Per-cell visualization of selected surface markers indicated in panel A. (C) Dot plot summarizing expression of WNT and Stem-like genes over-expressed in JCs compared to Aire-expressing migratory DCs. (D) RNA velocity analysis of GFP+ populations. (E) Flow cytometry from WT and Adig lymph nodes, pre-gated on single, live, and dump (TCRβ, CD19, SiglecF, F4/80, NK1.1, Ly6C)-negative cells. (F) Flow cytometry from WT and Adig lymph nodes, pre-gated on single and live cells. (G) Flow cytometry from WT, Adig, and REALTAR mice lymph nodes, pre-gated on single, live, and dump (TCRβ, CD19, SiglecF, F4/80, NK1.1, Ly6C)-negative cells. (H) Flow cytometry from REALTAR mouse lymph nodes, pre-gated on single and live cells.
Figure 5.
Figure 5.. eTACs are defined by transcriptional and genomic homology to thymic medullary epithelium.
(A) ImmGen similarity scores for scRNA-seq and (B) ASAP-seq data for mTEC populations. JCs and migratory DCs clusters for each embedding are noted by arrow. (C) Heatmap of ImmGen bulk RNA-seq data for genes most overexpressed in JCs relative to all other lymph node populations. mTEChi populations indicated in red text on top. (D) UMAP of aggregated published scRNA data from thymic epithelium showing annotated TEC subsets (left) and gene-density expression for Aire and genes enriched in JCs (right). (E) Rank-ordering of transcription factor motifs enriched in JCs compared to other populations. (F) Expression of transcription factors from panel E in scRNA-seq data. (G) ImmGen bulk ATAC-seq chromVAR deviation scores for all 89 populations, highlighting the mTEC population with red arrow. Rows represent top transcription factors identified from JCs and are min-max normalized.
Figure 6.
Figure 6.. RANK-RANKL signaling is required for Aire expression in eTACs.
(A) Gene expression of RANK (Tnfrsf11a) and OPG (Tnfrsf11b) from scRNA-seq data. (B) Flow cytometry of Percoll-enriched thymic epithelial cells from WT and Adig mice treated with isotype or αRANKL, pre-gated on single, live, CD11c, CD45, EpCAM+ cells. (C) Flow cytometry of lymph nodes from WT and Adig mice treated with isotype or αRANKL treatment, pre-gated on single, live, and dump (TCRβ, CD19, SiglecF, F4/80, NK1.1, Ly6C)-negative cells. (D) Quantitation of percentage and absolute cell numbers from B and C, unpaired t-test.
Figure 7.
Figure 7.. Pancreatic self-antigen expression in eTACs is sufficient to induce deletion of T cells escaping thymic selection, and to prevent autoimmune diabetes.
(A) Experimental design for thymic swap and BM chimerism in NOD and Adig NOD mice. SL XRT: sublethal irradiation. BM: bone marrow. (B) Flow cytometry showing lymphocyte populations from indicated tissues. CLN: cervical lymph node. PLN: pancreatic lymph node. (C) Flow cytometry tetramer staining of lymphocyte populations from indicated tissues; panels on right show Adig NOD NRP-V7 staining alone to show distribution of avidity in the periphery, given small number of surviving cells. (D) Quantitation of absolute cell numbers from B, unpaired t-test. (E) Kaplan-Meier curves, diabetes-free survival after bone-marrow reconstitution with 8.3+ BM.

References

    1. Anderson MS, Venanzi ES, Klein L, Chen Z, Berzins SP, Turley SJ, et al. Projection of an immunological self shadow within the thymus by the aire protein. Science (80- ). 2002; - PubMed
    1. Anderson MS, Venanzi ES, Chen Z, Berzins SP, Benoist C, Mathis D. The cellular mechanism of Aire control of T cell tolerance. Immunity. 2005;23(2):227–39. - PubMed
    1. Ramsey C, Hässler S, Marits P, Kämpe O, Surh CD, Peltonen L, et al. Increased antigen presenting cell-mediated T cell activation in mice and patients without the autoimmune regulator. Eur J Immunol. 2006;36(2):305–17. - PubMed
    1. Poliani PL, Kisand K, Marrella V, Ravanini M, Notarangelo LD, Villa A, et al. Human peripheral lymphoid tissues contain autoimmune regulator-expressing dendritic cells. Am J Pathol. 2010;176(3):1104–12. - PMC - PubMed
    1. Gardner JM, DeVoss JJ, Friedman RS, Wong DJ, Tan YX, Zhou X, et al. Deletional Tolerance Mediated by Extrathymic Aire-Expressing Cells. Science (80- ) [Internet]. 2008. Aug 8;321(5890):843–7. Available from: 10.1126/science.1159407 - DOI - PMC - PubMed

Publication types

Substances