

Cross-validation of SARS-CoV-2 responses in kidney organoids and clinical populations
- PMID: 34767537
- PMCID: PMC8783682
- DOI: 10.1172/jci.insight.154882
Cross-validation of SARS-CoV-2 responses in kidney organoids and clinical populations
Abstract
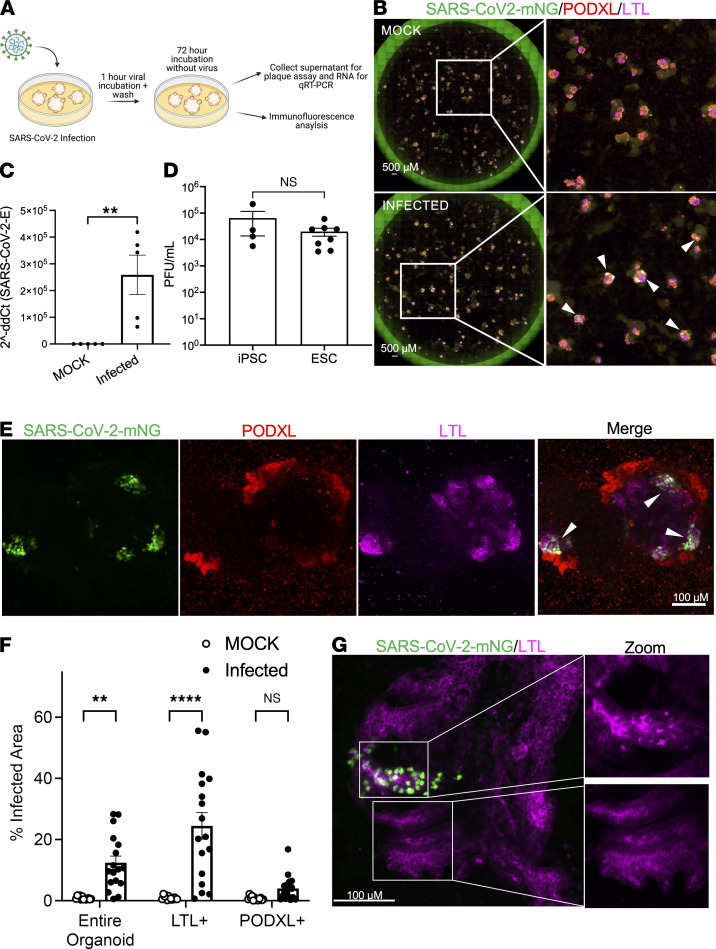
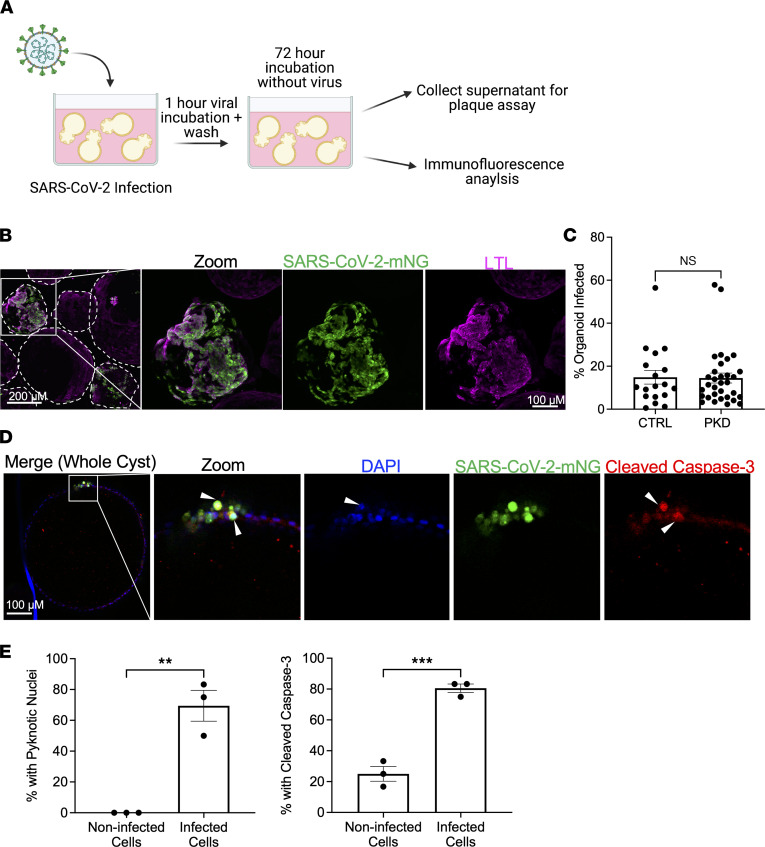
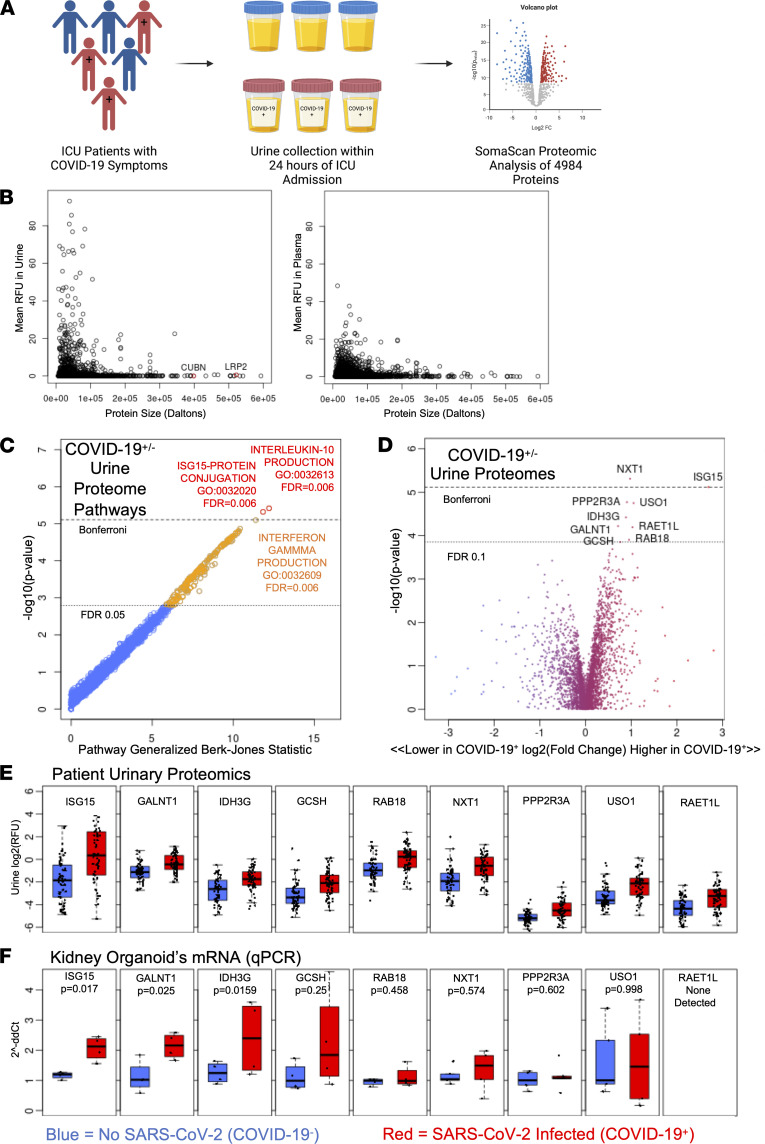
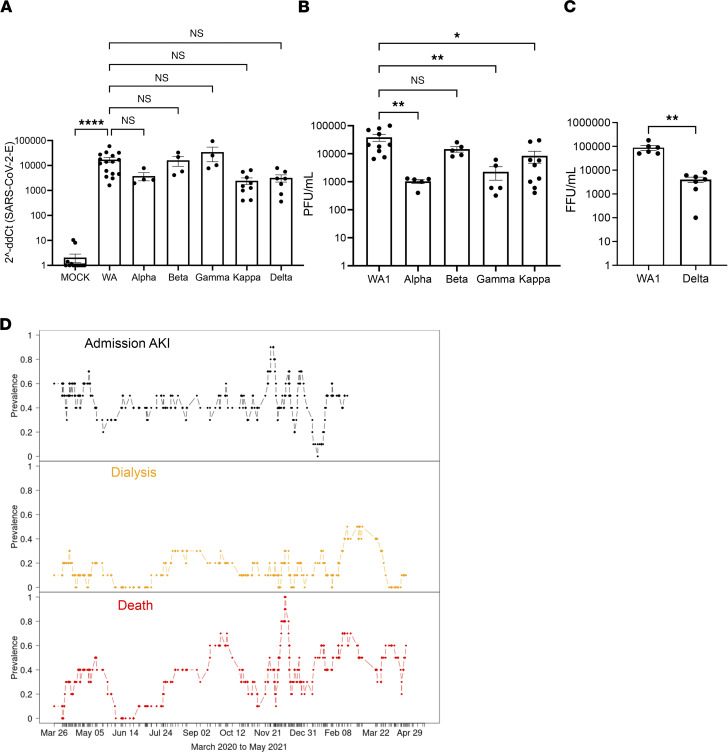
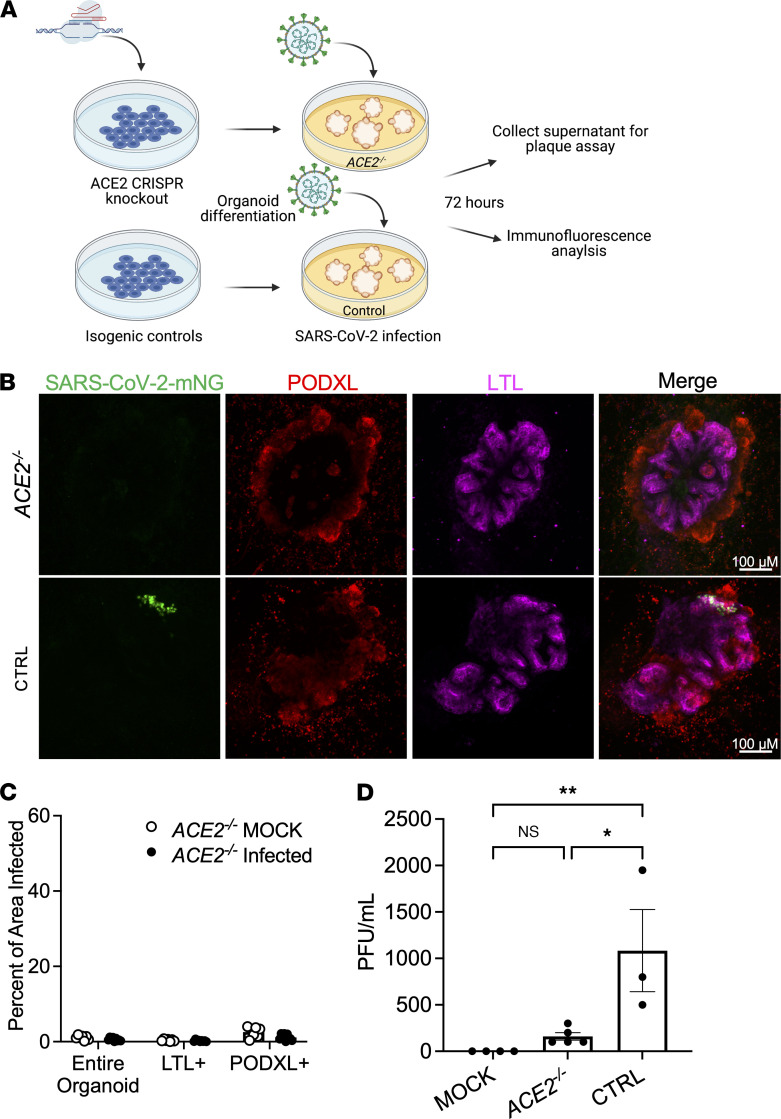
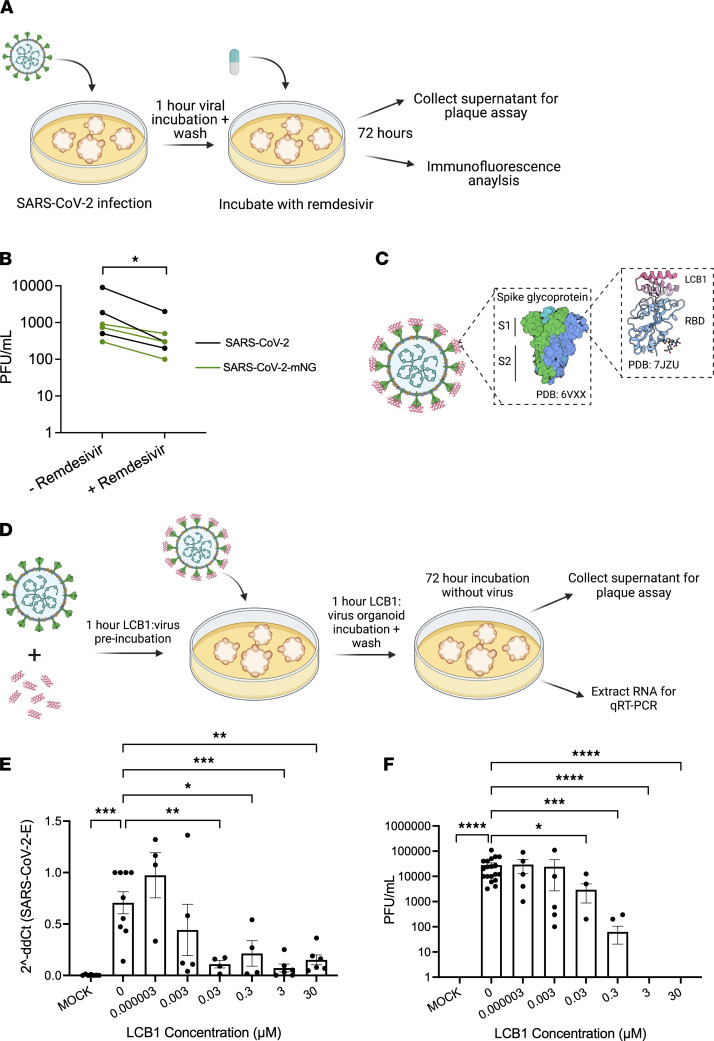
Kidneys are critical target organs of COVID-19, but susceptibility and responses to infection remain poorly understood. Here, we combine SARS-CoV-2 variants with genome-edited kidney organoids and clinical data to investigate tropism, mechanism, and therapeutics. SARS-CoV-2 specifically infects organoid proximal tubules among diverse cell types. Infections produce replicating virus, apoptosis, and disrupted cell morphology, features of which are revealed in the context of polycystic kidney disease. Cross-validation of gene expression patterns in organoids reflects proteomic signatures of COVID-19 in the urine of critically ill patients indicating interferon pathway upregulation. SARS-CoV-2 viral variants alpha, beta, gamma, kappa, and delta exhibit comparable levels of infection in organoids. Infection is ameliorated in ACE2-/- organoids and blocked via treatment with de novo-designed spike binder peptides. Collectively, these studies clarify the impact of kidney infection in COVID-19 as reflected in organoids and clinical populations, enabling assessment of viral fitness and emerging therapies.
Keywords: COVID-19; Genetic diseases; Molecular pathology; Nephrology; iPS cells.
Conflict of interest statement
Figures
Similar articles
-
Kidney organoids reveal redundancy in viral entry pathways during ACE2-dependent SARS-CoV-2 infection.J Virol. 2024 Mar 19;98(3):e0180223. doi: 10.1128/jvi.01802-23. Epub 2024 Feb 9. J Virol. 2024. PMID: 38334329 Free PMC article.
-
Androgen Signaling Regulates SARS-CoV-2 Receptor Levels and Is Associated with Severe COVID-19 Symptoms in Men.Cell Stem Cell. 2020 Dec 3;27(6):876-889.e12. doi: 10.1016/j.stem.2020.11.009. Epub 2020 Nov 17. Cell Stem Cell. 2020. PMID: 33232663 Free PMC article.
-
High SARS-CoV-2 Viral Load in Urine Sediment Correlates with Acute Kidney Injury and Poor COVID-19 Outcome.J Am Soc Nephrol. 2021 Oct;32(10):2517-2528. doi: 10.1681/ASN.2021010059. Epub 2021 Jun 4. J Am Soc Nephrol. 2021. PMID: 34088853 Free PMC article.
-
Review of studies of severe acute respiratory syndrome related coronavirus-2 pathogenesis in human organoid models.Rev Med Virol. 2021 Nov;31(6):e2227. doi: 10.1002/rmv.2227. Epub 2021 Mar 25. Rev Med Virol. 2021. PMID: 33763936 Free PMC article. Review.
-
Experimental Models for SARS-CoV-2 Infection.Mol Cells. 2021 Jun 30;44(6):377-383. doi: 10.14348/molcells.2021.0094. Mol Cells. 2021. PMID: 34187969 Free PMC article. Review.
Cited by
-
3D Lung Tissue Models for Studies on SARS-CoV-2 Pathophysiology and Therapeutics.Int J Mol Sci. 2022 Sep 3;23(17):10071. doi: 10.3390/ijms231710071. Int J Mol Sci. 2022. PMID: 36077471 Free PMC article. Review.
-
Infecting kidney organoids with a cDNA reporter clone of SARS-CoV-2.STAR Protoc. 2022 Jul 21;3(3):101617. doi: 10.1016/j.xpro.2022.101617. eCollection 2022 Sep 16. STAR Protoc. 2022. PMID: 35990736 Free PMC article.
-
Organoids to Remodel SARS-CoV-2 Research: Updates, Limitations and Perspectives.Aging Dis. 2023 Oct 1;14(5):1677-1699. doi: 10.14336/AD.2023.0209. Aging Dis. 2023. PMID: 37196111 Free PMC article. Review.
-
ACE2 knockout hinders SARS-CoV-2 propagation in iPS cell-derived airway and alveolar epithelial cells.Front Cell Dev Biol. 2023 Dec 8;11:1290876. doi: 10.3389/fcell.2023.1290876. eCollection 2023. Front Cell Dev Biol. 2023. PMID: 38149046 Free PMC article.
-
Analytical Considerations of Large-Scale Aptamer-Based Datasets for Translational Applications.Cancers (Basel). 2022 Apr 29;14(9):2227. doi: 10.3390/cancers14092227. Cancers (Basel). 2022. PMID: 35565358 Free PMC article. Review.
References
-
- Rabaan AA, et al. SARS-CoV-2, SARS-CoV, and MERS-COV: a comparative overview. Infez Med. 2020;28(2):174–184. - PubMed
Publication types
MeSH terms
Substances
Supplementary concepts
Grants and funding
- R21 AI158788/AI/NIAID NIH HHS/United States
- P51 OD010425/OD/NIH HHS/United States
- K23 DK116967/DK/NIDDK NIH HHS/United States
- UH3 TR002158/TR/NCATS NIH HHS/United States
- UH3 TR003288/TR/NCATS NIH HHS/United States
- T90 DE021984/DE/NIDCR NIH HHS/United States
- R24 HD000836/HD/NICHD NIH HHS/United States
- F31 DK130550/DK/NIDDK NIH HHS/United States
- P30 DK020572/DK/NIDDK NIH HHS/United States
- U01 AI151698/AI/NIAID NIH HHS/United States
- TL1 TR002318/TR/NCATS NIH HHS/United States
- UC2 DK126006/DK/NIDDK NIH HHS/United States
- UG3 TR003288/TR/NCATS NIH HHS/United States
- UG3 TR002158/TR/NCATS NIH HHS/United States
- K23 HL144916/HL/NHLBI NIH HHS/United States
- R01 DK117914/DK/NIDDK NIH HHS/United States
- R01 DK130386/DK/NIDDK NIH HHS/United States
- U24 DK114886/DK/NIDDK NIH HHS/United States
- R01 DK124063/DK/NIDDK NIH HHS/United States
- U01 DK127553/DK/NIDDK NIH HHS/United States
LinkOut - more resources
Full Text Sources
Medical
Research Materials
Miscellaneous
