. 2021 Nov 12;19(11):e3001450.
doi: 10.1371/journal.pbio.3001450. eCollection 2021 Nov.

A shared transcriptional code orchestrates temporal patterning of the central nervous system

Affiliations

A shared transcriptional code orchestrates temporal patterning of the central nervous system

Andreas Sagner et al. PLoS Biol. .

Abstract

The molecular mechanisms that produce the full array of neuronal subtypes in the vertebrate nervous system are incompletely understood. Here, we provide evidence of a global temporal patterning program comprising sets of transcription factors that stratifies neurons based on the developmental time at which they are generated. This transcriptional code acts throughout the central nervous system, in parallel to spatial patterning, thereby increasing the diversity of neurons generated along the neuraxis. We further demonstrate that this temporal program operates in stem cell-derived neurons and is under the control of the TGFβ signaling pathway. Targeted perturbation of components of the temporal program, Nfia and Nfib, reveals their functional requirement for the generation of late-born neuronal subtypes. Together, our results provide evidence for the existence of a previously unappreciated global temporal transcriptional program of neuronal subtype identity and suggest that the integration of spatial and temporal patterning mechanisms diversifies and organizes neuronal subtypes in the vertebrate nervous system.


Conflict of interest statement

The authors have declared that no competing interests exist.

Figures

Fig 1
Fig 1. Distinct birthdates of neurons expressing different temporal TFs (see also S1 and S2 Figs).
(A) Distinct cohorts of TFs are induced at different developmental stages in neurons from all dorsal–ventral domains in the spinal cord. (B) Scheme depicting EdU birthdating of neurons. (C) Dams were injected with EdU at e9.5, e10.5, e11.5, or e12.5 and embryos collected at e13.5. Colocalization between EdU and temporal TFs was then assessed in spinal cord cryosections. (D) Zfhx3-positive neurons are labeled by EdU, when EdU is administered at e9.5, but not at e12.5. (E) EdU labels Nfib-positive neurons when administered at e12.5, but not at e9.5. (F) Neurod2-postive neurons are labeled when EdU is administered at e11.5, but not when EdU is administered at e9.5. (G) Percentage of EdU-positive neurons labeled by Zfhx3, Nfib, and Neurod2 in the spinal cord. Underlying data are provided in S1 Data. Scale bars in D, E, and F = 200 μm. TF, transcription factor.
Fig 2
Fig 2. The temporal TF code is conserved at different rostral–caudal levels of the nervous system (see also S3–S9 Figs).
(A) Expression of temporal TFs in scRNAseq data [9] from the developing forebrain, midbrain, and hindbrain suggests conservation of temporal patterning in these parts of the nervous system. (B-D) Conservation of temporal patterning in the hindbrain. (B) Onecut2, but not Pou2f2, is expressed in hindbrain neurons at e9.5, while both TFs label distinct populations of neurons at e10.5. (C) Zfhx3, but not Nfib, labels neurons at e11.5. These TFs label distinct populations of neurons at e13.5. (D) Zfhx3 and Nfib label distinct subsets of Phox2b-positive neurons in the hindbrain at e13.5. (E-H) Conservation of temporal patterning in the midbrain. (F, H) show higher magnification images of the regions outlined in (E, G), respectively. (E, F) Onecut2, but not Pou2f2, labels neurons in the midbrain at e10.5. Both TFs label distinct subsets of neurons at e11.5. (G, H) Zfhx3 labels neurons at e11.5, while Nfib expression is restricted to neural progenitors. At e13.5, Zfhx3 and Nfib label distinct subsets of neurons in the midbrain at e13.5. (I-K) Percentage of EdU-positive neurons labeled by Zfhx3 and Nfib in the hindbrain (I), entire midbrain (J), and ventral and intermediate midbrain only (K). Underlying data are provided in S2 Data. Scale bars = 100 μm (B), 200 μm (C, E, G), or 25 μm (D, F, H). scRNAseq, single-cell RNA sequencing; TF, transcription factor.
Fig 3
Fig 3. Midbrain dopaminergic neurons are a temporal population of neurons derived from the midbrain floor plate (see also S10 Fig).
(A) Coexpression of Zfhx3 and Lmx1b in neurons derived from the midbrain floor plate at e11.5. (B) Nfib is restricted to Sox2-positive neural progenitors in the ventral midbrain at e11.5. (C) Mutually exclusive expression of Zfhx3 and Nfib in Lmx1b-positive neurons at e13.5. (D) Nfib labels Lmx1b-positive neurons directly adjacent to Sox2-positive progenitors at e13.5. (E) Colocalization between Zfhx3 and Zfhx4 in Lmx1b-positive neurons at e13.5. (F) Zfhx4 labels Lmx1b-positive neurons expressing high levels of TH at e13.5. Scale bars = 100 μm. TH, Tyrosine hydroxylase.
Fig 4
Fig 4. Conservation of the temporal TF code in stem cell–derived neurons with different axial and dorsal–ventral identities (see also S11 Fig).
(A) Schematics of the differentiation protocols for the generation of progenitors and neurons with different axial and dorsal–ventral identities. (B) Flow cytometry analysis of temporal TF expression indicates that neurons with different axial and dorsal–ventral identities display the same temporal progression in vitro as in vivo. (C) Flow cytometry analysis of Nkx2.2 and Pax3 expression in neural progenitors in dorsal and ventral spinal cord differentiations. (D) Percentage of neural progenitors expressing Pax3 and Nkx2.2 in ventral and dorsal spinal cord differentiations between days 7–11. Underlying data are provided in S3 Data. FGF, fibroblast growth factor; RA, retinoic acid; SAG, Shh pathway agonist; TF, transcription factor.
Fig 5
Fig 5. Conserved temporal patterning of neural progenitors throughout the developing central nervous system (see also S12 and S13 Figs).
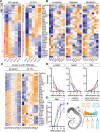
(A) Differential gene expression analysis using scRNAseq from spinal cord neural progenitors [33] identifies 542 genes (left) including 33 TFs (right) that are differentially expressed during the neurogenic period. Heatmap shows log-scaled and z-scored gene expression values for each gene. (B) Characterization of the expression dynamics of the same 33 TFs in scRNAseq from the developing forebrain, midbrain, and hindbrain [9]. (C) Expression dynamics of the 542 genes (left) and 33 TFs (right) in RNAseq data from ventral spinal cord differentiations [69]. Heatmap shows log-scaled and z-scored gene expression values for each gene. Order of the genes in both heatmaps is the same as in (A). (D) RT-qPCR analysis of Lin28a, Nr6a1, and Nfia from days 5–11 in in vitro differentiations with different axial identities reveals conserved expression dynamics of these markers in the in vitro differentiations. See S13D Fig for quantification of further markers. Underlying data are included in S4 Data. (E) Quantification of Nfia induction in in vitro generated neural progenitors with different axial identities by flow cytometry. For underlying data, see S3 Data. (F) Conserved temporal patterning of neural progenitors throughout the developing nervous system. Early neural progenitors express markers such as Lin28a, Lin28b, Nr6a1, Hmga1, Hmga2, and Dnajc2 (orange), while late progenitors are characterized by the expression of Nfia, Nfib, Npas3, Thra, Tcf4, and Zbtb20 (light blue). HB, hindbrain; MB, midbrain; RT-qPCR, real-time quantitative polymerase chain reaction; SC, spinal cord; scRNAseq, single-cell RNA sequencing; TF, transcription factor.
Fig 6
Fig 6. TGFβ signaling influences the timing of temporal TF expression in neurons and progenitors.
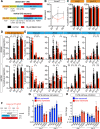
(A) Schematics of the differentiation protocols for TGFβ pathway inhibition in dorsal and ventral spinal cord conditions. (B) Inhibition of TGFβ signaling in dorsal spinal cord conditions causes down-regulation of the TGFβ pathway target gene Smad7. (C) TGFβ pathway inhibition does not alter the proportion of progenitors expressing Pax3 in dorsal (left) or Nkx2.2 in ventral (right) conditions. (D) Inhibition of TGFβ signaling delays the induction of Nfia in dorsal and ventral spinal cord neural progenitors. (E) Percentage of neurons expressing the different temporal TFs in the presence and absence of TGFβ pathway inhibition. TGFβ pathway inhibition causes a delay in the induction of the late neuronal markers Zfhx3, Nfia, and Neurod2 in neurons. (F) Scheme outlining the differentiation protocol to assess the role of TGFβ pathway activation and inhibition on the temporal patterning of neural progenitors. (G) TGFβ pathway activation causes an earlier induction of the late markers Sox9, Nfia, Nfib, and Nfix and earlier down-regulation of Lin28a and Lin28b by RT-qPCR. (H) TGFβ pathway inhibition has the opposite effect on the expression of these markers. Underlying flow cytometry data are provided in S3 Data, qPCR data in S4 Data. FGF, fibroblast growth factor; RA, retinoic acid; RT-qPCR, real-time quantitative polymerase chain reaction; SAG, Shh pathway agonist; TF, transcription factor.
Fig 7
Fig 7. Nfia and Nfib are required for the efficient generation of late-born Neurod2 neurons (see also S14 Fig).
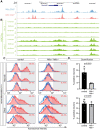
(A) Analysis of Nfia and Nfib ChIP-Seq data from the mouse cerebellum [77] confirms binding of Nfia and Nfib to genomic regions in the vicinity of the Neurod2 gene. (B) Analysis of ChIP-seq data from the ENCODE project [78] reveals accumulation of H3K27ac at the same sites between e11.5 and e13.5 in the different regions of the nervous system. (C) Neurod2 (top) and Zfhx3 (bottom) intensity histograms in control (left) and Nfia; Nfib double mutant (right) neurons (red) and progenitors (blue) at D11 in ventral conditions. Shading indicates the applied thresholds above which cells were counted as Neurod2 or Zfhx3-positive. (D) Percentage of Neurod2 (top) and Zfhx3-positive neurons (bottom) at D11 in control and Nfia; Nfib double mutants differentiated in ventral conditions (n = 6 for control and n = 3 for Nfia; Nfib double mutants). Significance was assessed by unpaired t-test with Welch’s correction. Underlying flow cytometry data are provided in S3 Data. H3K27ac, Histone-3-Lysine-27-acetylation.

Similar articles

Cited by

References

    1. Zeng H, Sanes JR. Neuronal cell-type classification: Challenges, opportunities and the path forward. Nat Rev Neurosci. 2017;18:530–46. doi: 10.1038/nrn.2017.85 - DOI - PubMed
    1. Jessell TM. Neuronal specification in the spinal cord: inductive signals and transcriptional codes. Nat Rev Genet. 2000;1:20–9. doi: 10.1038/35049541 - DOI - PubMed
    1. Philippidou P, Dasen JS. Hox Genes: Choreographers in Neural Development, Architects of Circuit Organization. Neuron. 2013;80:12–34. doi: 10.1016/j.neuron.2013.09.020 - DOI - PMC - PubMed
    1. Bikoff JB, Gabitto MI, Rivard AF, Drobac E, Machado TA, Miri A, et al.. Spinal Inhibitory Interneuron Diversity Delineates Variant Motor Microcircuits. Cell. 2016;165:207–19. doi: 10.1016/j.cell.2016.01.027 - DOI - PMC - PubMed
    1. Gabitto MI, Pakman A, Bikoff JB, Abbott LF, Jessell TM, Paninski L. Bayesian Sparse Regression Analysis Documents the Diversity of Spinal Inhibitory Interneurons. Cell. 2016;165:220–33. doi: 10.1016/j.cell.2016.01.026 - DOI - PMC - PubMed

Publication types

Substances

LinkOut - more resources