. 2021 Nov 12;17(11):e1009603.
doi: 10.1371/journal.pcbi.1009603. eCollection 2021 Nov.

Binding free energy decomposition and multiple unbinding paths of buried ligands in a PreQ1 riboswitch

Affiliations

Binding free energy decomposition and multiple unbinding paths of buried ligands in a PreQ1 riboswitch

Guodong Hu et al. PLoS Comput Biol. .

Abstract

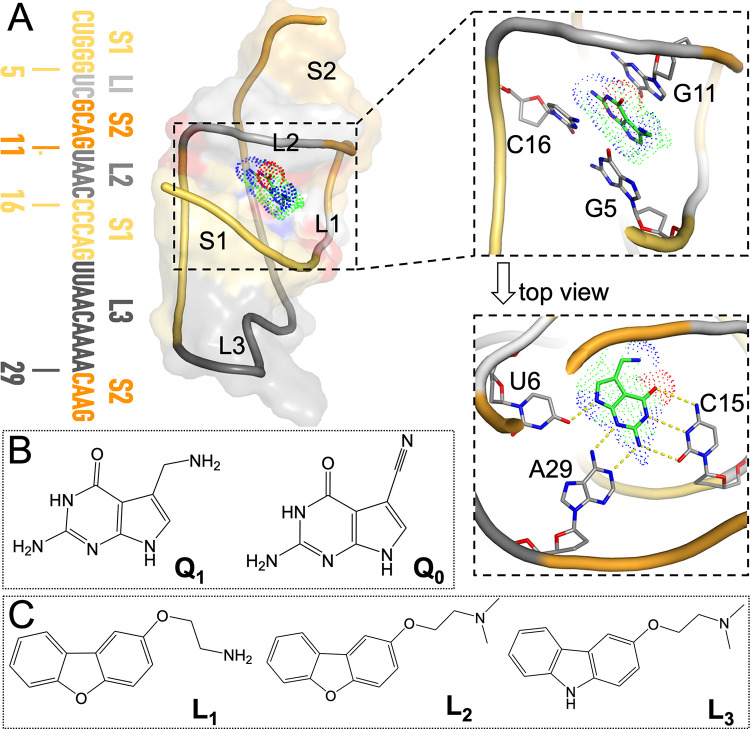
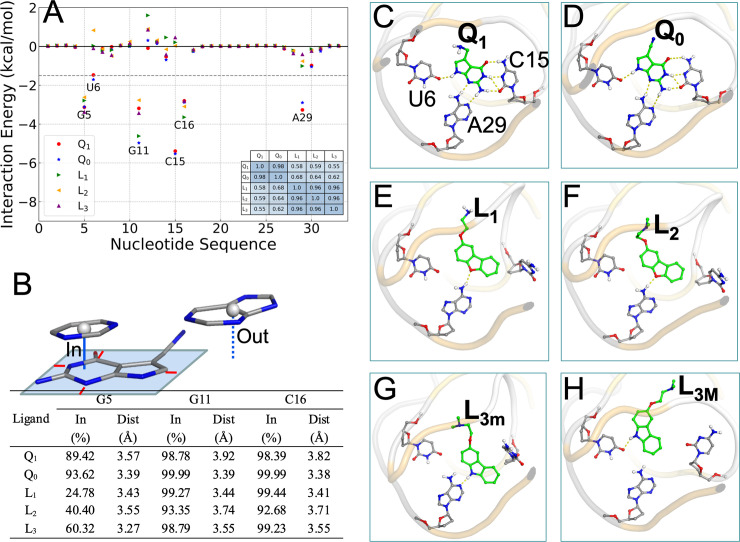
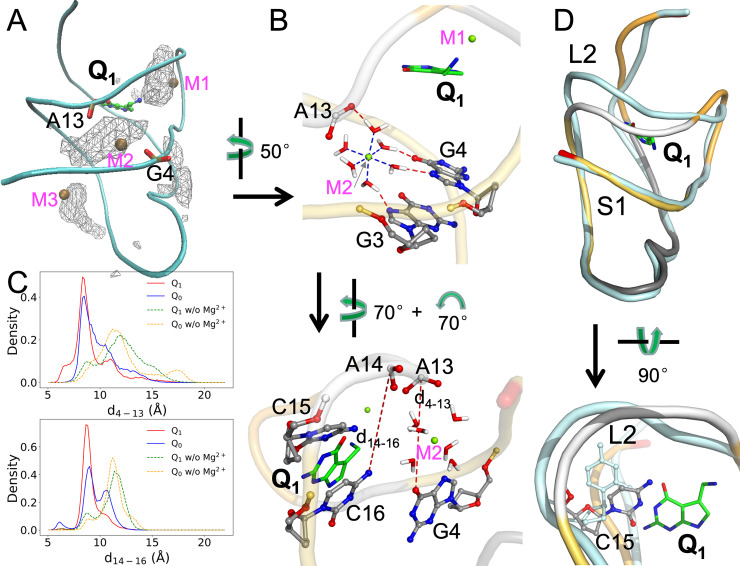
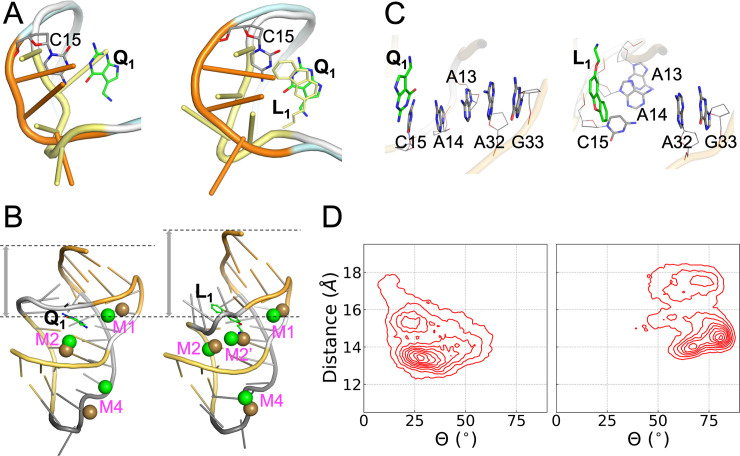
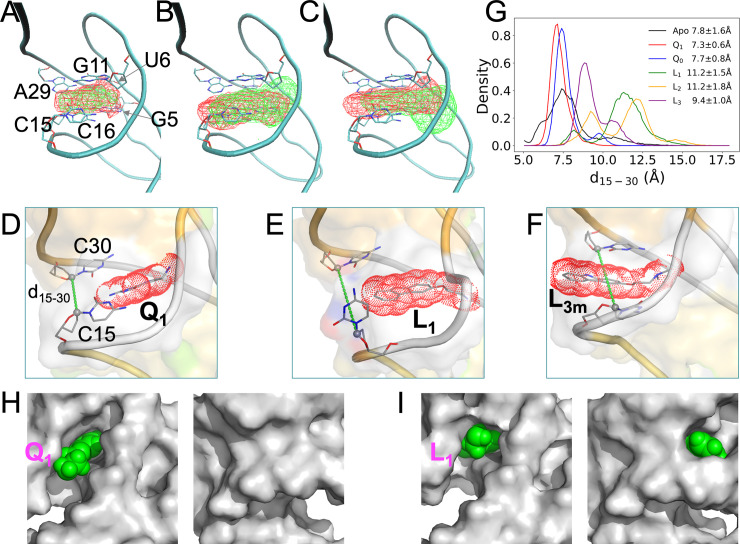
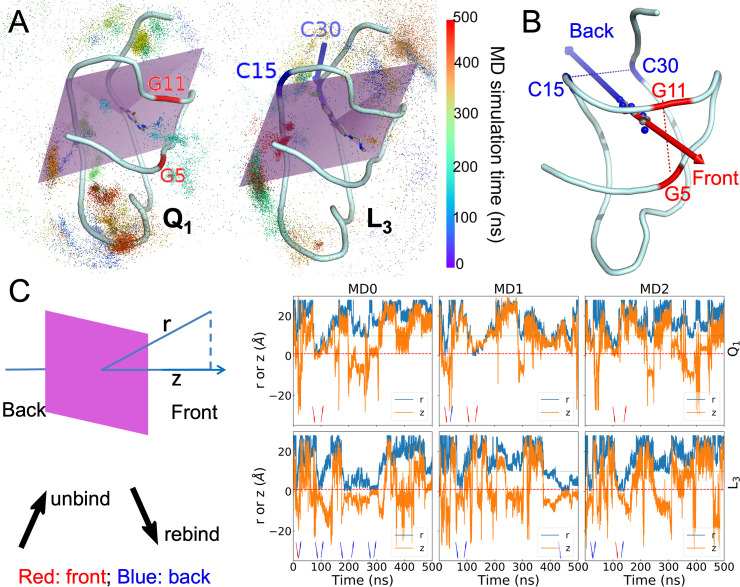
Riboswitches are naturally occurring RNA elements that control bacterial gene expression by binding to specific small molecules. They serve as important models for RNA-small molecule recognition and have also become a novel class of targets for developing antibiotics. Here, we carried out conventional and enhanced-sampling molecular dynamics (MD) simulations, totaling 153.5 μs, to characterize the determinants of binding free energies and unbinding paths for the cognate and synthetic ligands of a PreQ1 riboswitch. Binding free energy analysis showed that two triplets of nucleotides, U6-C15-A29 and G5-G11-C16, contribute the most to the binding of the cognate ligands, by hydrogen bonding and by base stacking, respectively. Mg2+ ions are essential in stabilizing the binding pocket. For the synthetic ligands, the hydrogen-bonding contributions of the U6-C15-A29 triplet are significantly compromised, and the bound state resembles the apo state in several respects, including the disengagement of the C15-A14-A13 and A32-G33 base stacks. The bulkier synthetic ligands lead to significantly loosening of the binding pocket, including extrusion of the C15 nucleobase and a widening of the C15-C30 groove. Enhanced-sampling simulations further revealed that the cognate and synthetic ligands unbind in almost opposite directions. Our work offers new insight for designing riboswitch ligands.


Conflict of interest statement

The authors have declared that no competing interests exist.

Figures

Fig 1
Fig 1. Structures of the PreQ1-bound aptamer domain from the Tte PreQ1 riboswitch and of the cognate and synthetic ligands.
(A) Left: sequence and secondary structure of the aptamer; middle: three-dimensional structure of the PreQ1-aptamer complex, with the aptamer shown in both cartoon and surface representations. Nucleotides in the sequence and in the structure are color-matched. Top right: zoomed version showing PreQ1 in an oblique view to highlight the base stacking with G11 above and with G5 and C16 below. Bottom right: top view highlighting the in-plane hydrogen bonding with U6, C15, and A29. This structure was prepared using coordinates from the PDB entry 6E1W [23], with missing nucleotides copied from PDB entry 3Q50 [24]. (B) Chemical structures of PreQ1 and PreQ0. (C) Chemical structures of three synthetic ligands, L1 to L3.
Fig 2
Fig 2. Interactions of cognate and synthetic ligands with the PreQ1 aptamer in cMD simulations with Mg2+.
(A) Contributions of individual nucleotides to the binding free energies. A dashed horizontal line is drawn at -1.5 kcal/mol, which separates the pocket-lining nucleotides from the rest of the sequence. Inset: a table listing the correlation coefficients between the individual contributions of any two complexes. (B) Ligand-nucleotide base stacking statistics. Top: illustration of when a nucleobase is (“in”) or is not (“out”) in a stacking position with the ligand. A rectangle is drawn around the ligand rings atoms, with a minimum of 0.5 Å separation (shown by red lines). A cytosine is in an “in” position, with vertical distance drawn as a solid line, as the projection of its center is inside the rectangle; a guanine is in an “out” position, with vertical distance drawn as a dashed line, as the projection of its center is outside the rectangle. Bottom: in-fractions of three nucleobases and their average vertical distances from the ligand rings. (C)-(H) In-plane hydrogen bonds between ligands and nucleobases, shown as dashed lines, in representative structures from cMD simulations.
Fig 3
Fig 3. Distributions and effects of Mg2+.
(A) Density contours of Mg2+ ions in the Q1-bound complex, shown as wireframe. Three Mn2+ ions in PDB entry 6VUI are shown as ochre spheres; the corresponding Mg2+ sites are labeled as M1, M2, and M3. Phosphate groups in G4 and A13 are shown in stick representation, to highlight the bridging role of M2. (B) Two views showing the coordination of the Mg2+ ion at the M2 site. Top: coordination of Mg2+ by six water molecules and the latter’s hydrogen bonding with the G3 and G4 nucleobases and A14 phosphate. Bottom: two distances, d4-13 (between G4 O6 and A13 OP1) and d14-16 (between A14 P and C16 N4), introduced to characterize the effects of the Mg2+ ion. (C) Probability densities of d4-13 and d14-16, in cMD simulations with and without Mg2+ ions. (D) Effect of Mg2+ ions on the separation of the L2 loop from the S1 helix in the Q1-bound form. Two representative structures are superimposed, with the aptamer in the presence of Mg2+ shown in the same multi-color scheme as in Fig 1A and the aptamer in the absence of Mg2+ shown in a uniform cyan color. In the bottom view, the C15 nucleotides in the two structures are shown in a stick representation.
Fig 4
Fig 4. Contrast between Q1- and L1-bound complexes.
(A) Conformations of the L2 loop (U12-A13-A14-C15). Left: conformations adopted in the apo (yellow) and Q1-bound (orange) forms, from PDB entries 6VUH and 3Q50, respectively. Right: conformations in representative structures of the L1-bound (yellow) and Q1-bound (orange) forms from cMD simulations. (B) Comparison between representative Mg2+ sites from cMD simulations and Mn2+ positions from crystal structures (PDB entries 6VUI and 6VUH). Left: similarity between cMD Mg2+ (green) and crystal Mn2+ (ochre) positions in the Q1-bound form. Right: similarity between cMD Mg2+ (green) positions in the L1-bound from and crystal Mn2+ (ochre) positions in the apo form. The L1-bound structure has a larger separation between the ligand and the 3’ end. (C) The orthogonal orientations of the C15-A14-A13 nucleobases in the Q1- and L1-bound forms in cMD simulations, leading to one stack or two separate stacks, respectively, with the A32-G33 nucleobases. (D) Density maps in the space of two collective variables: the distance from the center of the binding pocket to the center of the A32 and G33 nucleobases, and the average angle (Θ) between the A13, A14, and C15 nucleobases and the A32 and G33 nucleobases.
Fig 5
Fig 5. Loosening in the back of the binding pocket when bound with synthetic ligands, in cMD simulations with Mg2+.
(A)-(C) Density contours of ligands, shown as wireframe in reference to a representative Q1-bound structure, with the six pocket-lining nucleotides displayed in stick representation. Panel (A) shows contours in red for Q1 and in green for Q0; panel (B) shows contours in red for L1 and in green for L2; and panel (C) shows contours in red for L3m and in green for L3M. The L3m and L3M contours were calculated only from snapshots where hydrogen bonding with A29 or U6 was present. (D)-(F) Representative conformations of the Q1-, L1-, and L3m-bound forms, respectively. Ligands are shown in both stick representation and as dot surface. The C1’ atoms of C15 and C30 are connected to define the distance d15-30 and to illustrate the back door. (G) The probability densities of d15-30 in the apo form and the five liganded forms. (H) Two views into Q1 in the binding pocket. The aptamer is shown as gray surface while the ligand is shown as green spheres. Left: front view showing Q1 exposure; right: back view showing buried Q1. (I) Corresponding presentation for L1, except that this ligand is exposed both on the front and on the back.
Fig 6
Fig 6. Unbinding and rebinding pathways of ligands.
(A) The trajectories of ligand centers shown as dots colored according to the MD simulation time. The aptamer and bound ligands are shown in cartoon and stick representations, respectively. Left: Q1; right: L3. A plane in purple bisects the binding pocket into the front half and the back half. Two nucleotides defining the front door in the Q1-bound complex are labeled in red; two nucleotides defining the back door in the L3-bound complex are labeled in blue. (B) The front and back unbinding paths. (C) The center-to-center distance r between the ligand and the binding pocket and the z coordinate of the ligand center along the normal of the pocket-bisecting plane. The left-most panel illustrates r and z, and presents interpretations of arrow directions and colors that appear in the right three panels, which show time traces of r and z in three metadynamics simulations. Red dashed and green dotted horizontal lines are drawn at r = 1 and 9 Å, respectively, to indicate the times of entrance to and exit from the binding pocket.

Similar articles

Cited by

References

    1. Thomas JR, Hergenrother PJ. Targeting RNA with small molecules. Chem Rev. 2008;108(4):1171–224. Epub 2008/03/26. doi: 10.1021/cr0681546 . - DOI - PubMed
    1. Cech TR, Steitz JA. The noncoding RNA revolution-trashing old rules to forge new ones. Cell. 2014;157(1):77–94. doi: 10.1016/j.cell.2014.03.008 . - DOI - PubMed
    1. Guan L, Disney MD. Recent advances in developing small molecules targeting RNA. ACS Chem Biol. 2012;7(1):73–86. doi: 10.1021/cb200447r . - DOI - PubMed
    1. Connelly CM, Moon MH, Schneekloth JS Jr. The Emerging Role of RNA as a Therapeutic Target for Small Molecules. Cell Chem Biol. 2016;23(9):1077–90. doi: 10.1016/j.chembiol.2016.05.021 ; PubMed Central PMCID: PMC5064864. - DOI - PMC - PubMed
    1. Sponer J, Bussi G, Krepl M, Banas P, Bottaro S, Cunha RA, et al.. RNA Structural Dynamics As Captured by Molecular Simulations: A Comprehensive Overview. Chem Rev. 2018;118(8):4177–338. doi: 10.1021/acs.chemrev.7b00427 . - DOI - PMC - PubMed

Publication types