

Multi-Site Concordance of Diffusion-Weighted Imaging Quantification for Assessing Prostate Cancer Aggressiveness
- PMID: 34767682
- PMCID: PMC9095769
- DOI: 10.1002/jmri.27983
Multi-Site Concordance of Diffusion-Weighted Imaging Quantification for Assessing Prostate Cancer Aggressiveness
Abstract
Background: Diffusion-weighted imaging (DWI) is commonly used to detect prostate cancer, and a major clinical challenge is differentiating aggressive from indolent disease.
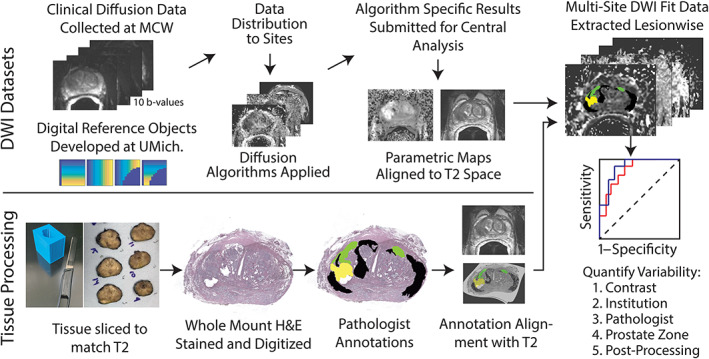
Purpose: To compare 14 site-specific parametric fitting implementations applied to the same dataset of whole-mount pathologically validated DWI to test the hypothesis that cancer differentiation varies with different fitting algorithms.
Study type: Prospective.
Population: Thirty-three patients prospectively imaged prior to prostatectomy.
Field strength/sequence: 3 T, field-of-view optimized and constrained undistorted single-shot DWI sequence.
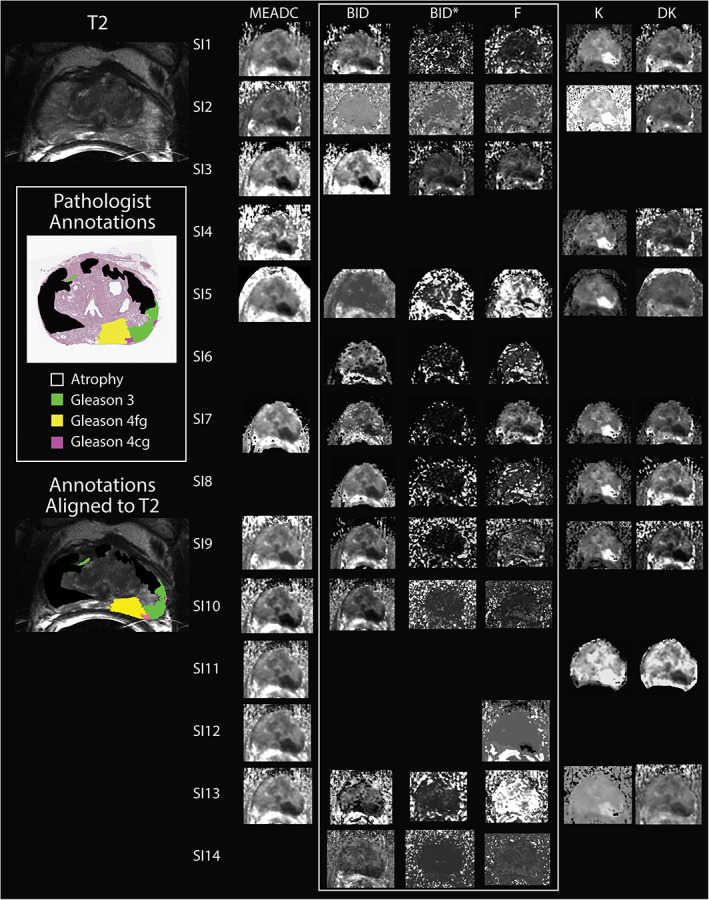
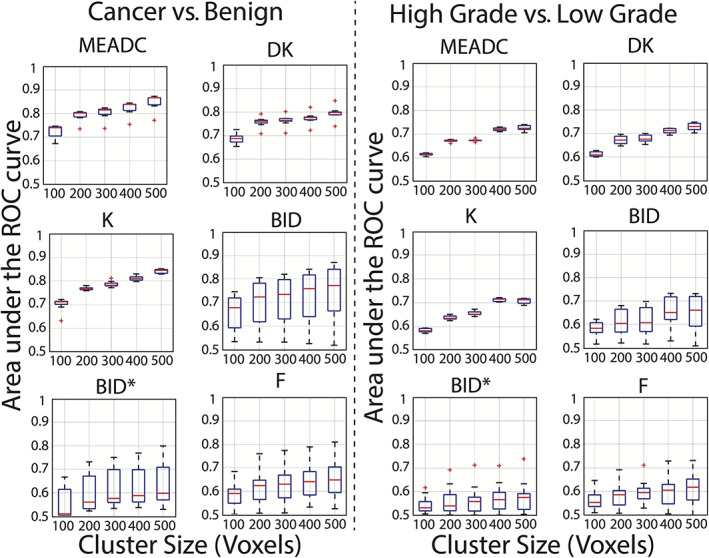
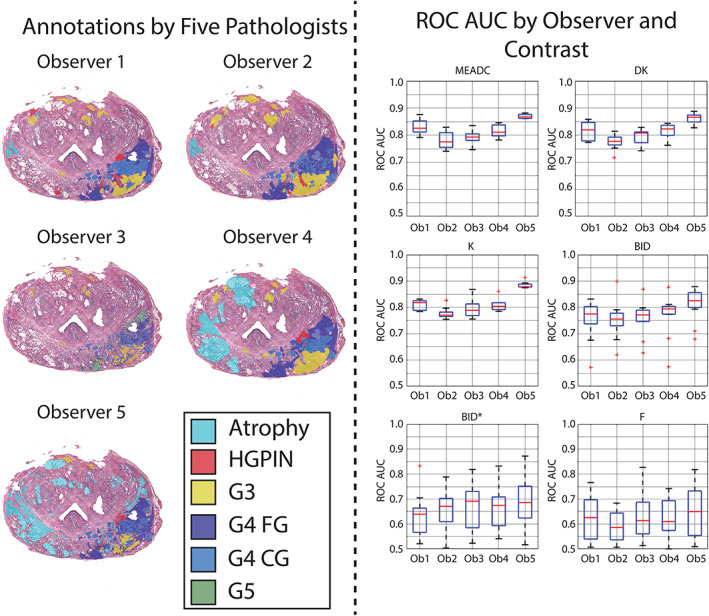
Assessment: Datasets, including a noise-free digital reference object (DRO), were distributed to the 14 teams, where locally implemented DWI parameter maps were calculated, including mono-exponential apparent diffusion coefficient (MEADC), kurtosis (K), diffusion kurtosis (DK), bi-exponential diffusion (BID), pseudo-diffusion (BID*), and perfusion fraction (F). The resulting parametric maps were centrally analyzed, where differentiation of benign from cancerous tissue was compared between DWI parameters and the fitting algorithms with a receiver operating characteristic area under the curve (ROC AUC).
Statistical test: Levene's test, P < 0.05 corrected for multiple comparisons was considered statistically significant.
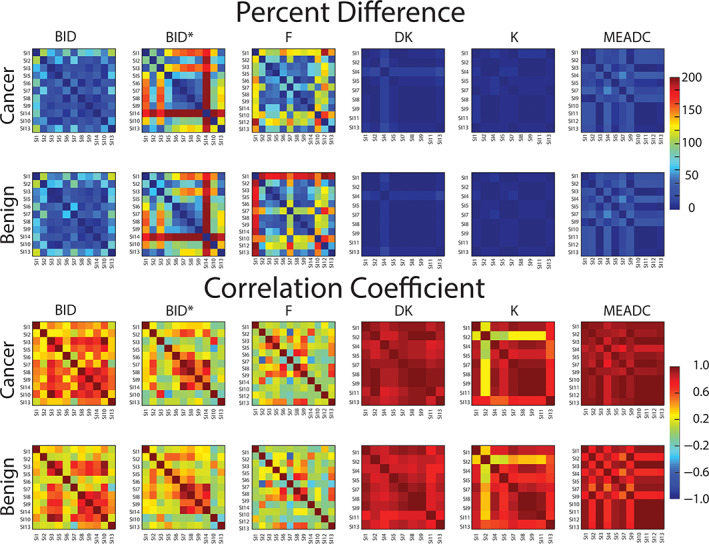
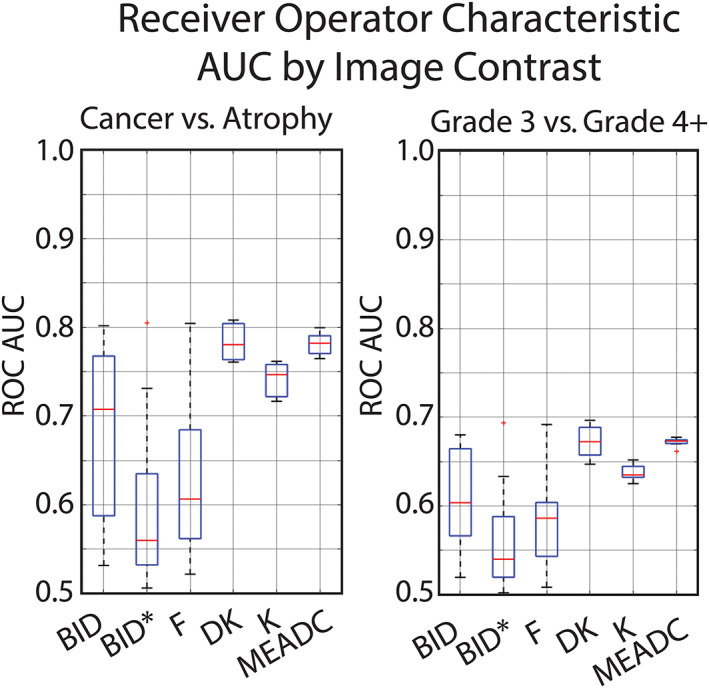
Results: The DRO results indicated minimal discordance between sites. Comparison across sites indicated that K, DK, and MEADC had significantly higher prostate cancer detection capability (AUC range = 0.72-0.76, 0.76-0.81, and 0.76-0.80 respectively) as compared to bi-exponential parameters (BID, BID*, F) which had lower AUC and greater between site variation (AUC range = 0.53-0.80, 0.51-0.81, and 0.52-0.80 respectively). Post-processing parameters also affected the resulting AUC, moving from, for example, 0.75 to 0.87 for MEADC varying cluster size.
Data conclusion: We found that conventional diffusion models had consistent performance at differentiating prostate cancer from benign tissue. Our results also indicated that post-processing decisions on DWI data can affect sensitivity and specificity when applied to radiological-pathological studies in prostate cancer.
Level of evidence: 1 TECHNICAL EFFICACY: Stage 3.
Keywords: MRI; cancer; diffusion; multisite |modelling; prostate.
© 2021 The Authors. Journal of Magnetic Resonance Imaging published by Wiley Periodicals LLC on behalf of International Society for Magnetic Resonance in Medicine.
Conflict of interest statement
Author KMS has ownership interest in IQ‐AI and financial interest in Imaging Biometrics LLC.
Figures
Comment in
-
Editorial for "Multi-site concordance of diffusion weighted imaging quantification for assessing prostate cancer aggressiveness".J Magn Reson Imaging. 2022 Jun;55(6):1759-1760. doi: 10.1002/jmri.27994. Epub 2021 Nov 12. J Magn Reson Imaging. 2022. PMID: 34767691 No abstract available.
References
-
- Siegel RL, Miller KD, Jemal A. Cancer statistics, 2020. CA Cancer J Clin 2020;70(1):7‐30. - PubMed
-
- Turkbey B, Rosenkrantz AB, Haider MA, et al. Prostate imaging reporting and data system version 2.1: 2019 update of prostate imaging reporting and data system version 2. Eur Urol 2019;76(3):340‐351. - PubMed
-
- Vargas HA, Hotker AM, Goldman DA, et al. Updated prostate imaging reporting and data system (PIRADS v2) recommendations for the detection of clinically significant prostate cancer using multiparametric MRI: Critical evaluation using whole‐mount pathology as standard of reference. Eur Radiol 2016;26(6):1606‐1612. - PMC - PubMed
Publication types
MeSH terms
Supplementary concepts
Grants and funding
- U24 CA180918/CA/NCI NIH HHS/United States
- R01 CA158079/CA/NCI NIH HHS/United States
- R01 CA241817/CA/NCI NIH HHS/United States
- TL1 TR001437/TR/NCATS NIH HHS/United States
- U01 CA183848/CA/NCI NIH HHS/United States
- R50 CA211270/CA/NCI NIH HHS/United States
- R01 CA228036/CA/NCI NIH HHS/United States
- U01 CA151261/CA/NCI NIH HHS/United States
- R01 CA160902/CA/NCI NIH HHS/United States
- R21 CA231892/CA/NCI NIH HHS/United States
- UL1 TR001436/TR/NCATS NIH HHS/United States
- R01 CA218144/CA/NCI NIH HHS/United States
- P01 CA085878/CA/NCI NIH HHS/United States
- R01 CA249882/CA/NCI NIH HHS/United States
- R01 CA190299/CA/NCI NIH HHS/United States
- U01 CA142565/CA/NCI NIH HHS/United States
- R01 CA207290/CA/NCI NIH HHS/United States
- P30 CA006973/CA/NCI NIH HHS/United States
- UG3 CA247606/CA/NCI NIH HHS/United States
- U01 CA140204/CA/NCI NIH HHS/United States
- P41 EB015898/EB/NIBIB NIH HHS/United States
- P30 CA008748/CA/NCI NIH HHS/United States
- U01 CA166104/CA/NCI NIH HHS/United States
- U01 CA172320/CA/NCI NIH HHS/United States
- U01 CA154602/CA/NCI NIH HHS/United States
- R01 CA221938/CA/NCI NIH HHS/United States
- R01 CA248192/CA/NCI NIH HHS/United States
- U01 CA176110/CA/NCI NIH HHS/United States
- P41 EB028741/EB/NIBIB NIH HHS/United States
- U01 CA207091/CA/NCI NIH HHS/United States
- U01 CA211205/CA/NCI NIH HHS/United States
