. 2022 Jan 11;55(1):65-81.e9.
doi: 10.1016/j.immuni.2021.10.011. Epub 2021 Nov 11.

MTHFD2 is a metabolic checkpoint controlling effector and regulatory T cell fate and function

Affiliations

MTHFD2 is a metabolic checkpoint controlling effector and regulatory T cell fate and function

Ayaka Sugiura et al. Immunity. .

Abstract

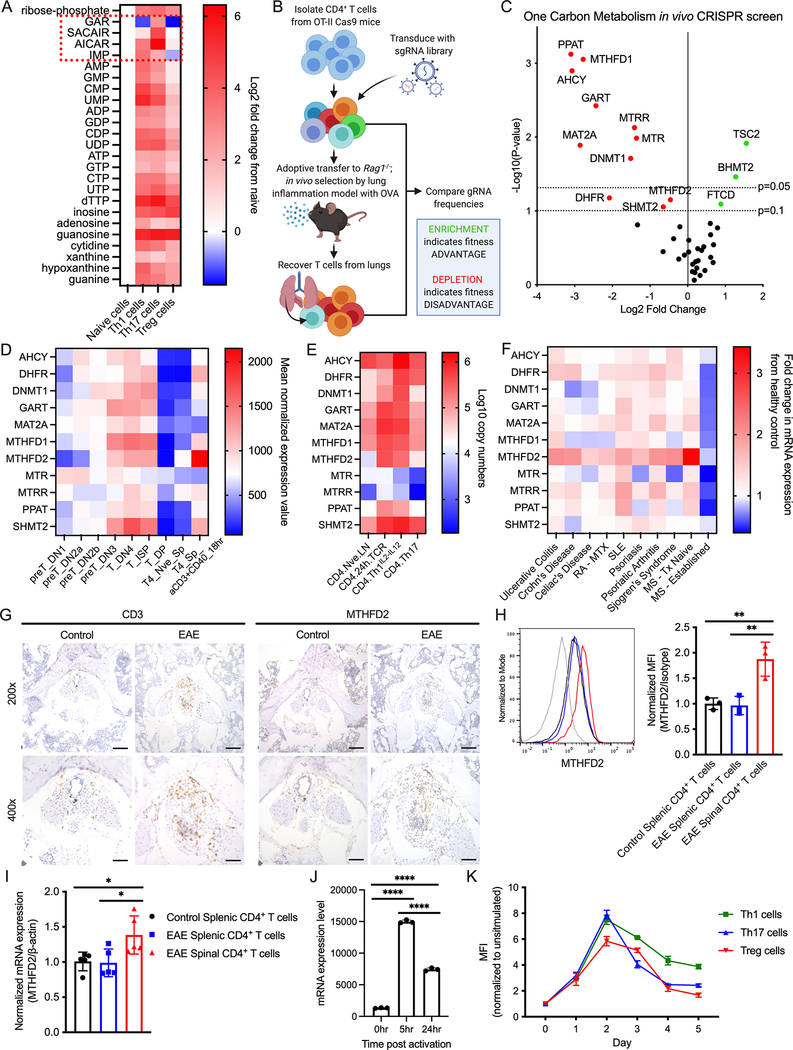
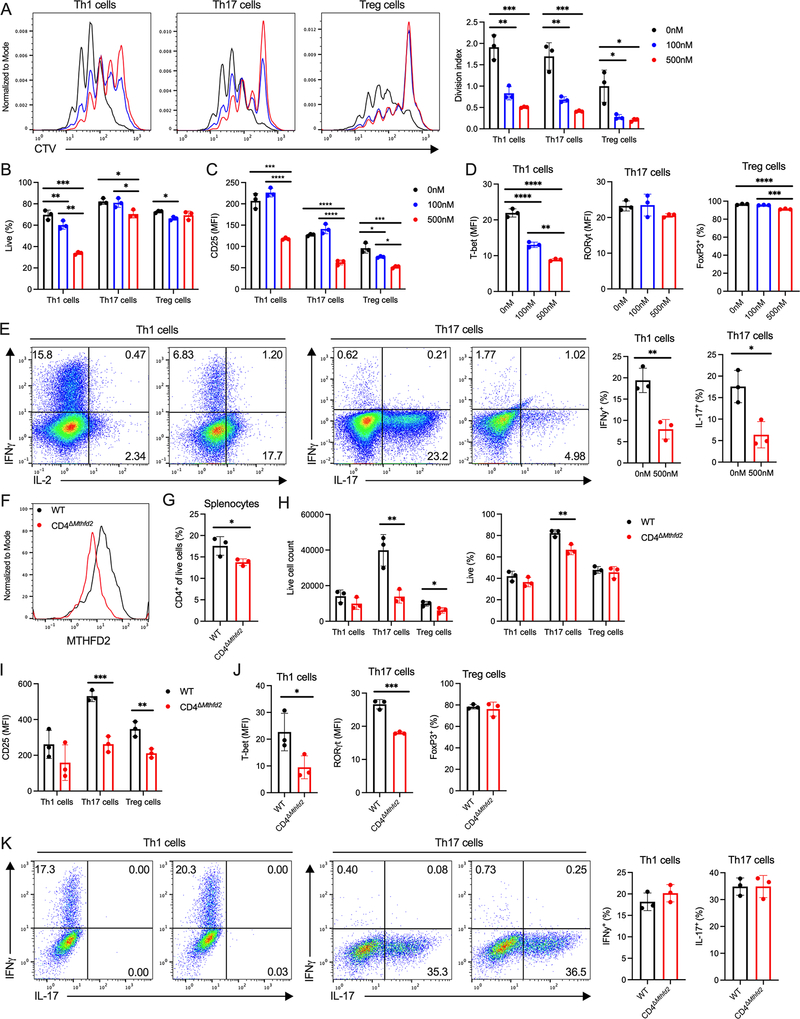
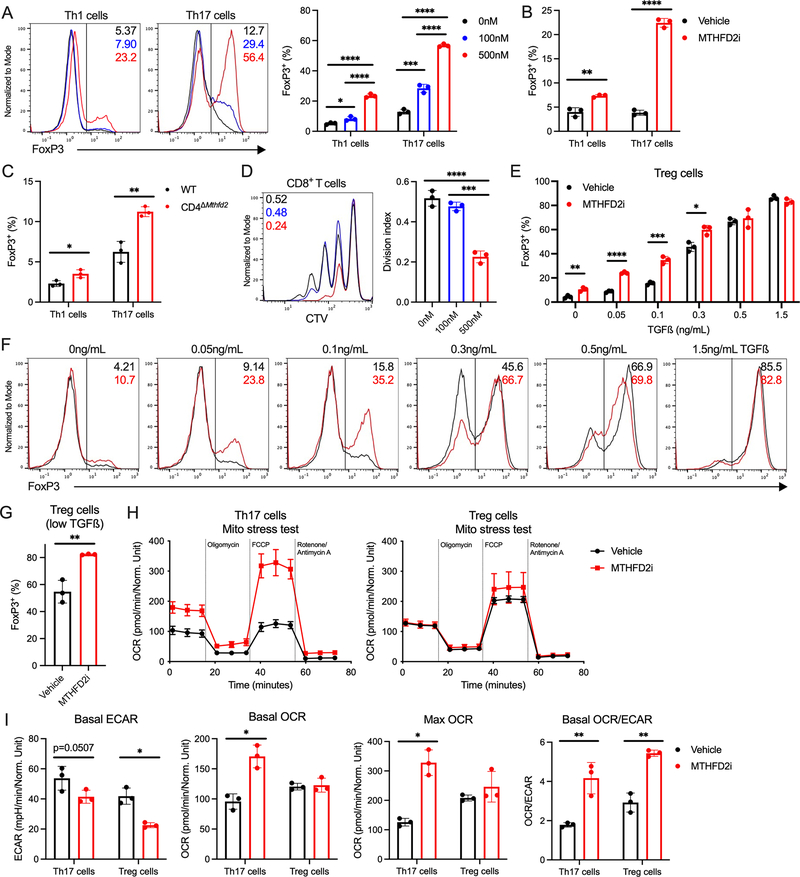
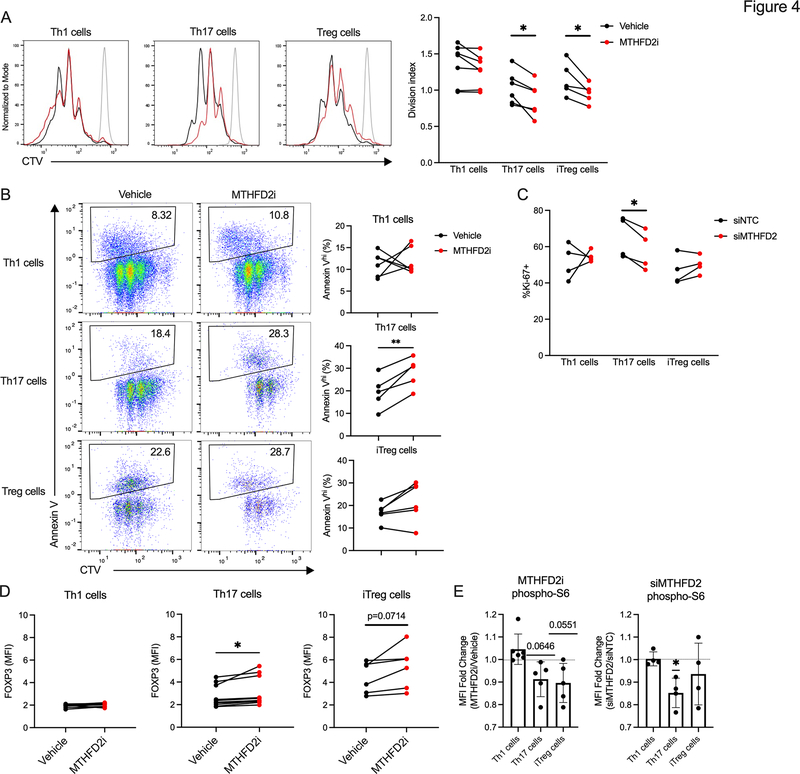
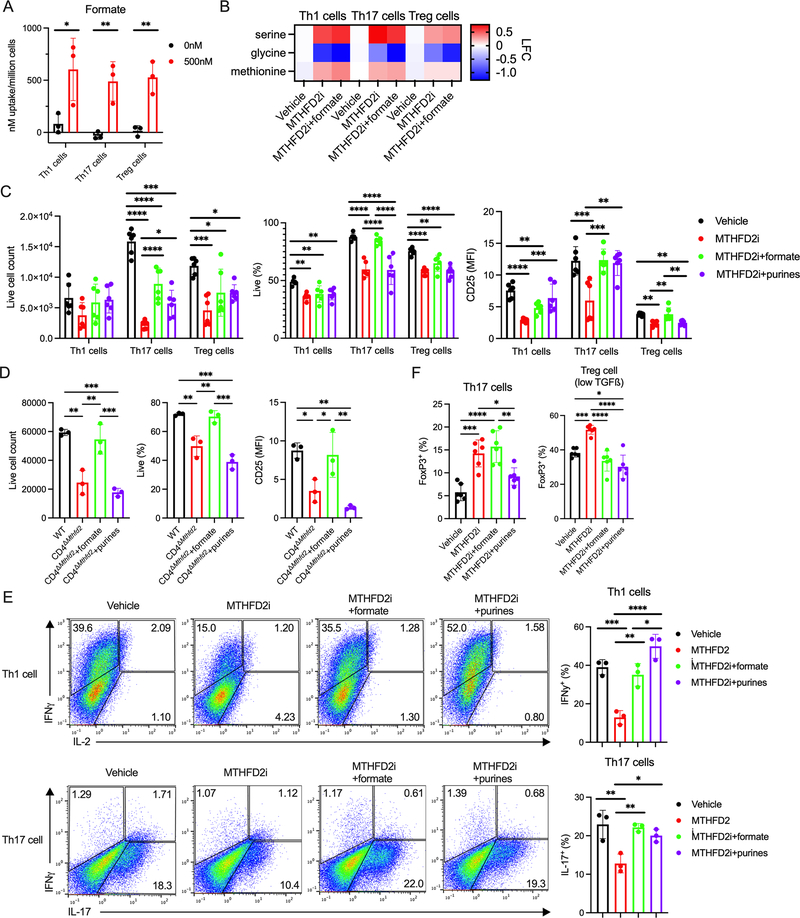
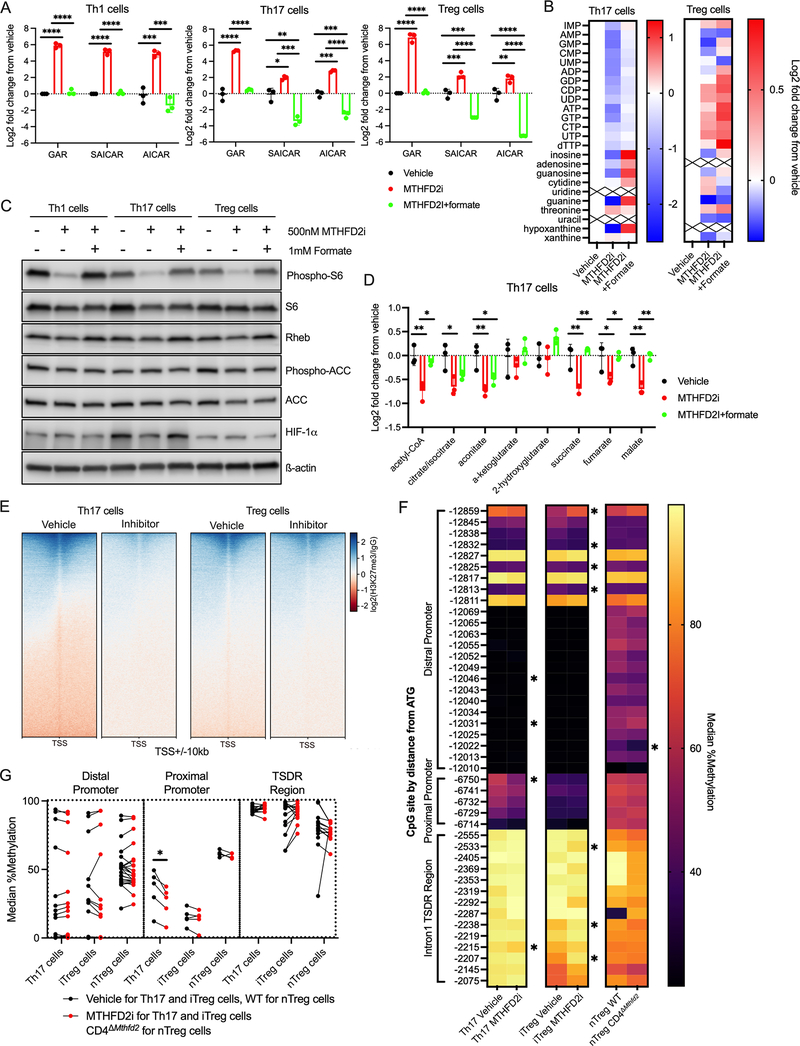
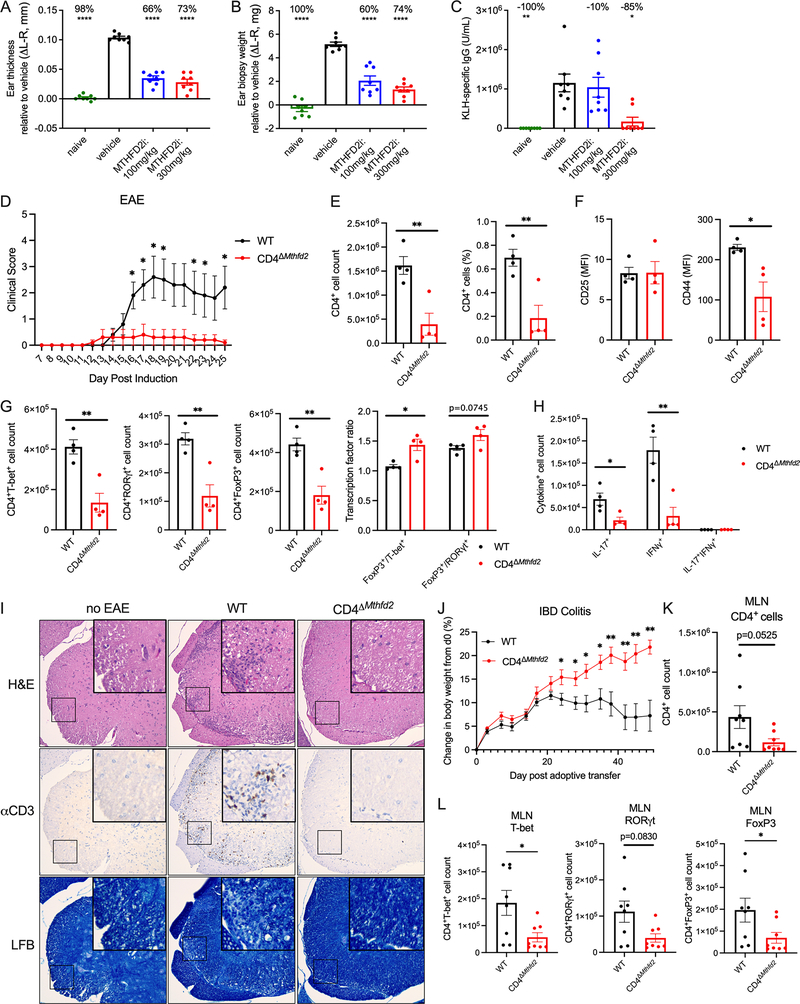
Antigenic stimulation promotes T cell metabolic reprogramming to meet increased biosynthetic, bioenergetic, and signaling demands. We show that the one-carbon (1C) metabolism enzyme methylenetetrahydrofolate dehydrogenase 2 (MTHFD2) regulates de novo purine synthesis and signaling in activated T cells to promote proliferation and inflammatory cytokine production. In pathogenic T helper-17 (Th17) cells, MTHFD2 prevented aberrant upregulation of the transcription factor FoxP3 along with inappropriate gain of suppressive capacity. MTHFD2 deficiency also promoted regulatory T (Treg) cell differentiation. Mechanistically, MTHFD2 inhibition led to depletion of purine pools, accumulation of purine biosynthetic intermediates, and decreased nutrient sensor mTORC1 signaling. MTHFD2 was also critical to regulate DNA and histone methylation in Th17 cells. Importantly, MTHFD2 deficiency reduced disease severity in multiple in vivo inflammatory disease models. MTHFD2 is thus a metabolic checkpoint to integrate purine metabolism with pathogenic effector cell signaling and is a potential therapeutic target within 1C metabolism pathways.

Keywords: CD4(+) T cells; CRISPR screen; MTHFD2; T cell differentiation; inflammation; mTORC1; metabolic checkpoint; methylation; one carbon metabolism; purine metabolism.


Conflict of interest statement

Declaration of interests J.C.R. is a founder, scientific advisory board member, and stockholder of Sitryx Therapeutics; a scientific advisory board member and stockholder of Caribou Biosciences; a member of the scientific advisory board of Nirogy Therapeutics; has consulted for Merck, Pfizer, and Mitobridge within the past 3 years; and has received research support from Incyte Corp., Calithera Biosciences, and Tempest Therapeutics. J.D.R. is a co-founder and stockholder in Raze Therapeutics, Toran, Serien Therapeutics, and Farber Partners and an advisor and stockholder in Agios Pharmaceuticals, Kadmon Pharmaceuticals, Bantam Pharmaceuticals, Colorado Research Partners, Rafael Holdings, the Barer Institute, and L.E.A.F. Pharmaceuticals; he has received consulting fees and research funding from Pfizer and Rafael and is the inventor of patents held by Princeton University. A.M.C., P.F., and T.B. are employees of Sitryx Therapeutics.

Figures

Figure 1:
Figure 1:. 1C metabolism and MTHFD2 are upregulated in activated CD4+ T cells and in the context of EAE.
(A) Change in nucleotide metabolism species in in vitro differentiated CD4+ T cell subsets compared to naïve cells measured by mass spectrometry (n=3 biological replicates). (B) Workflow for targeted CRISPR screening in in vivo lung inflammation model. (C) Change in gRNA abundance from 1C metabolism-targeted in vivo CRISPR screening in primary CD4+ T cells (statistical analysis performed by MAGeCK, n=3 biological replicates). (D) mRNA expression of genes identified in (C) during T cell development and activation. Data from ImmGen RNA-seq databrowser. (E) Protein expression of genes identified in (C) in naïve and activated CD4+ T cells. Data from Immunological Proteome Resource (ImmPRes). (F) mRNA expression of genes identified in (C) in whole blood of patients with indicated inflammatory disorders relative to healthy control patients (Aune et al., 2017). (RA-MTX = RA under MTX treatment, SLE = systemic lupus erythematosus, MS-Tx Naïve = treatment-naïve MS at time of diagnosis, MS-Established = MS under treatment and in disease remission; n=3–8 patient donors). (G) IHC showing CD3 and MTHFD2 staining in the cauda equina segment of the spinal cord of mice with symptomatic EAE at 200x (top, scale bar = 100μm) and 400x (bottom, scale bar = 50μm) magnification (data representative of two independent experiments). (H-I) Relative (H) mean fluorescence intensity (MFI) and (I) mRNA expression of MTHFD2 in CD4+ T cells from spleen and spinal cord of mice with symptomatic EAE and spleen of control mice (one-way ANOVA, data representative of two independent experiments with n=6 total biological replicates). (J) MTHFD2 mRNA expression in undifferentiated CD4+ T cells at 0, 5, and 24 hours post activation with anti-CD3 and anti-CD28 antibodies (one-way ANOVA, n=3 biological replicates). (K) Relative MTHFD2 MFI over 5 days post activation in CD4+ T cell subsets, normalized to resting cells (n=3 biological replicates). See also Figure S1.
Figure 2:
Figure 2:. MTHFD2 deficiency impairs CD4+ T cell proliferation and function
(A-D) Proliferation measured by (A) CTV dilution, (B) viability, (C) CD25 expression, and (D) TF expression in CD4+ T cell subsets treated with MTHFD2i for 72hrs post activation (one-way ANOVA, data representative of three independent experiments with n=9 total biological replicates). (E) Cytokine expression in Th1 and Th17 cells treated with vehicle or 500nM MTHFD2i for 4 days and stimulated with PMA and ionomycin (unpaired t-test, data representative of three independent experiments with n=9 total biological replicates). (F) MTHFD2 expression in CD4+ T cells isolated from WT and CD4ΔMthfd2 littermates, activated with anti-CD3 and anti-CD28 antibodies, and cultured for 72hrs (data representative of n=3 biological replicates). (G) Frequency of CD4+ T cells in the spleen of treatment-naïve WT and CD4ΔMthfd2 littermates (unpaired t-test, n=3 biological replicates). (H-K) Live (H) cell count, (I) CD25 expression, (J) TF expression, and (K) cytokine expression in Th1 and Th17 cells from WT and CD4ΔMthfd2 littermates 4 days post activation (unpaired t-test, data representative of three independent experiments with n=9 biological replicates). See also Figure S2.
Figure 3:
Figure 3:. MTHFD2 deficiency induces FoxP3 expression and promotes a shift toward oxidative phosphorylation.
(A) FoxP3 expression in MTHFD2i-treated Th1 and Th17 cells 72hrs post activation (one-way ANOVA, data representative of three independent experiments with n=9 total biological replicates). (B) FoxP3 expression in Th1 and Th17 cells activated for 24hrs and then treated with vehicle or 500nM MTHFD2i for 48hrs (unpaired t-test, data representative of three independent experiments with n=9 total biological replicates). (C) FoxP3 expression in Th1 and Th17 cells from WT and CD4ΔMthfd2 littermates 72hrs post activation (unpaired t-test, data representative of three independent experiments with n=9 total biological replicates). (D) Suppression assay measuring aberrant suppressive capacity of MTHFD2i-treated Th17 cells. Pre-treated Th17 cells were co-cultured with CTV-stained CD8+ T cells to measure proliferation upon activation with anti-CD3 and anti-CD28 antibodies (one-way ANOVA, n=3 biological replicates). (E) FoxP3 expression in Treg cells differentiated with a range of TGFß concentrations treated with MTHFD2i (unpaired t-test, data representative of three independent experiments with n=9 total biological replicates). (F) Flow cytometric plots for data tabulated in (E). (G) FoxP3 expression in Treg cells activated and differentiated with low concentrations of TGFß for 24hrs and then treated with MTHFD2i for 48hrs (unpaired t-test, data representative of three independent experiments with n=9 total biological replicates). (H) Seahorse XF Cell Mito Stress Test performed on MTHFD2i-treated Th17 and Treg cells. (I) Basal ECAR, basal OCR, max OCR, and basal OCR/ECAR ratio measured in (H) (unpaired t-test, data representative of two independent experiments with n=6 total biological replicates).
Figure 4:
Figure 4:. MTHFD2 deficiency impairs proliferation and induces FOXP3 expression in human Th17 cells.
(A) Proliferation measured by CTV dilution in human CD4+ T cell subsets treated with vehicle or 2μM MTHFD2i for 72hrs post activation with anti-CD3 and anti-CD28 antibodies (paired t-test, data representative of three independent experiments with n=5–6 healthy patient donors). (B) Apoptosis measured by Annexin V in human CD4+ T cells treated with MTHFD2i for 72hrs (paired t-test, data representative of three independent experiments with n=5–6 healthy patient donors). (C) Ki-67 expression in human CD4+ T cells transduced with NTC or siMTHFD2 (paired t-test, data representative of three independent experiments with n=4 healthy patient donors). (D) FOXP3 expression in human CD4+ T cells treated with MTHFD2i for 72hrs (paired t-test, data representative of three independent experiments with n=6–10 healthy patient donors). (E) Change in phospho-S6 expression in human CD4+ T cells treated with MTHFD2i for 72hrs or transduced with siMTHFD2 (one sample t-test, data representative of three independent experiments with n=4–6 healthy patient donors).
Figure 5:
Figure 5:. MTHFD2i effects on T cell subsets are rescued by exogenous formate.
(A) Formate uptake measured by 1H-MRS in CD4+ T cell subsets treated with vehicle or 500nM MTHFD2i for 72 hours post activation (unpaired t-test, data representative of two independent experiments with n=6 total biological replicates). (B) Change in serine, glycine, and methionine concentrations in CD4+ T cells treated with 500nM MTHFD2i or 500nM MTHFD2i+1mM formate for 4–6hrs compared to vehicle measured by mass spectrometry (n=3 biological replicates). (C) Live cell count, viability, and CD25 expression in MTHFD2i-treated CD4+ T cells rescued with 1mM formate or 60μM adenine and guanine purine solution for 72hrs post activation (one-way ANOVA, data representative of three independent experiments with n=9 total biological replicates). (D) Live cell count, viability, and CD25 expression in CD4+ T cells from WT or CD4ΔMthfd2 littermates rescued with formate or purines for 72hrs post activation (one-way ANOVA, n=3 biological replicates). (E) Cytokine expression in Th1 and Th17 cells treated with MTHFD2i±formate or purines for 4 days post activation (one-way ANOVA, data representative of three independent experiments with n=9 total biological replicates). (F) FoxP3 expression in Th17 and Treg cells differentiated with low concentrations of TGFß, treated with MTHFD2i±formate or purines for 72hrs post activation (one-way ANOVA, data representative of three independent experiments with n=9 total biological replicates).
Figure 6:
Figure 6:. MTHFD2i results in accumulation of purine synthesis intermediates, dampened mTORC1 activity, and altered DNA and histone methylation.
(A) Change in GAR, SAICAR, and AICAR concentrations in CD4+ T cells treated with 500nM MTHFD2i or 500nM MTHFD2i+1mM formate for 4–6hrs relative to vehicle measured by mass spectrometry (one-way ANOVA, n=3 biological replicates). (B) Change in nucleotide metabolism species in Th17 and Treg cells treated with MTHFD2i±formate for 4–6hrs relative to vehicle measured by mass spectrometry (n=3 biological replicates). (C) Immunoblot of phospho-S6, S6, Rheb, phospho-ACC, ACC, HIF-1α, and ß-actin in CD4+ T cells treated with MTHFD2i±formate for 72hrs post activation (data representative of three independent experiments with n=3 biological replicates). (D) Change in TCA cycle metabolites in Th17 cells treated with MTHFD2i±formate for 6hrs relative to vehicle measured by mass spectrometry (one-way ANOVA, n=3 biological replicates). (E) Heat maps of H3K27me3 to IgG control ratio in +/− 10 kb regions around promoters of UCSC known genes in Th17 and Treg cells treated with MTHFD2i measured by CUT&RUN (Data pooled from n=3 biological replicates). (F) Heatmap of median DNA methylation frequency of Foxp3 locus by CpG site in Th1 and Th17 cells treated with vehicle or 500nM MTHFD2i and in nTreg cells from WT or CD4ΔMthfd2 littermates (Mood’s test, n=3 biological replicates). (G) Tabulation of (F) by proximal promoter, distal promoter, and TSDR (paired t-test). See also Figure S3–4.
Figure 7:
Figure 7:. Targeting MTHFD2 in vivo reduces disease severity in DTH, EAE, and IBD models.
(A-B) Ear (A) relative thickness and (B) biopsy weight 10 days post KLH with CFA immunization and 3 days post KLH challenge to induce DTH (one-way ANOVA). Mice were treated twice daily with oral 0, 100, or 300mg/kg MTHFD2i (mean±SEM, n=8 biological replicates). (C) KLH-specific IgG concentrations on day 10 of KLH-induced DTH (mean±SEM, Kruskal-Wallis tes, n=8 biological replicates). (D) Average clinical score overtime in WT and CD4ΔMthfd2 littermates immunized with MOG with CFA and PTX to induce EAE (mean±SEM, multiple Mann-Whitney tests, data representative of two independent experiments each with n=5 biological replicates). (E) Cell count and frequency of CD4+ T cells in the spinal cord of EAE mice at peak disease severity (mean±SEM, unpaired t-test, data representative of two independent experiments with n=9 total biological replicates). (F) CD25 and CD44 expression in CD4+ T cells from the spinal cord of EAE mice (mean±SEM, unpaired t-test, n=4 biological replicates). (G&H) Cell count of (G) T-bet+, RORγt+, FoxP3+, FoxP3+/T-bet+ ratio, FoxP3+/RORγt+ ratio, (H) IL-17+, IFNγ+, and IL-17+IFNγ+ CD4+ T cells from the spinal cord of EAE mice (mean±SEM, unpaired t-test, data representative of two independent experiments with n=9 total biological replicates). (I) H&E, anti-CD3 IHC, and Luxol Fast Blue (LFB) staining for myelin in the spinal cord of WT mouse with no immunization and WT and CD4ΔMthfd2 littermates with EAE at peak disease (200x magnification, representative of n=5 biological replicates). (J) Change in body weight over time of Rag1−/− mice i.p. injected with WT or CD4ΔMthfd2 naïve CD4+ T cells to induce IBD colitis (mean±SEM, multiple t-tests, n=8 biological replicates). (K&L) Cell count of (K) total CD4+ T cells and (L) T-bet+, RORγt+, and FoxP3+ CD4+ T cells from MLNs of IBD mice (mean±SEM, unpaired t-test n=8 biological replicates). See also Figure S5&6.

Comment in

References

    1. Anderson GR, Winter PS, Lin KH, Nussbaum DP, Cakir M, Stein EM, Soderquist RS, Crawford L, Leeds JC, Newcomb R, et al. (2017). A Landscape of Therapeutic Cooperativity in KRAS Mutant Cancers Reveals Principles for Controlling Tumor Evolution. Cell Reports 20, 999–1015. - PMC - PubMed
    1. Aune TM, Crooke PS, Patrick AE, Tossberg JT, Olsen NJ, and Spurlock CF (2017). Expression of long non-coding RNAs in autoimmunity and linkage to enhancer function and autoimmune disease risk genetic variants. Journal of Autoimmunity 81, 99–109. - PMC - PubMed
    1. Bantug GR, Galluzzi L, Kroemer G, and Hess C (2018). The spectrum of T cell metabolism in health and disease. Nat Rev Immunol 18, 19–34. - PubMed
    1. Ben-Sahra I, Hoxhaj G, Ricoult SJH, Asara JM, and Manning BD (2016). mTORC1 induces purine synthesis through control of the mitochondrial tetrahydrofolate cycle. Science 351, 728–733. - PMC - PubMed
    1. Brown PM, Pratt AG, and Isaacs JD (2016). Mechanism of action of methotrexate in rheumatoid arthritis, and the search for biomarkers. Nat Rev Rheumatol 12, 731–742. - PubMed

Publication types

MeSH terms

Substances