. 2022 Jan 19;110(2):248-265.e9.
doi: 10.1016/j.neuron.2021.10.028. Epub 2021 Nov 11.

Molecular and functional architecture of striatal dopamine release sites

Affiliations

Molecular and functional architecture of striatal dopamine release sites

Aditi Banerjee et al. Neuron. .

Abstract

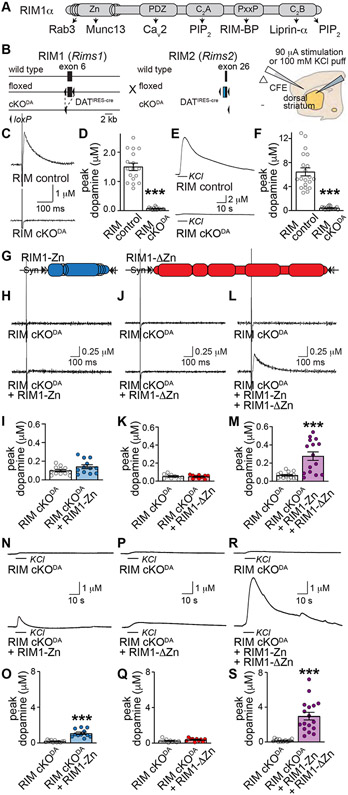
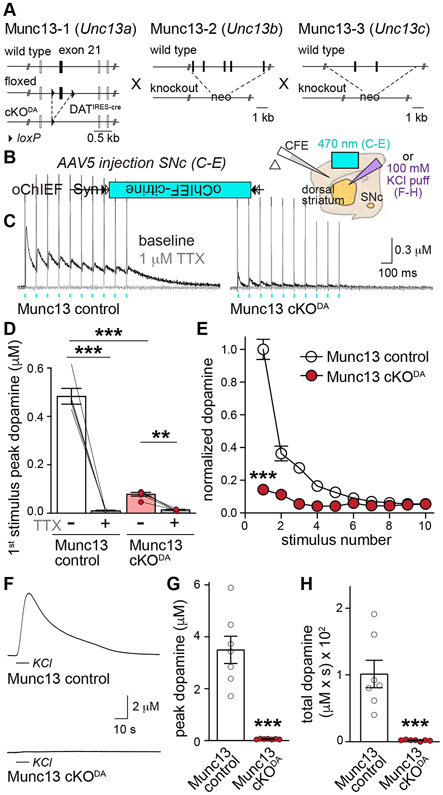
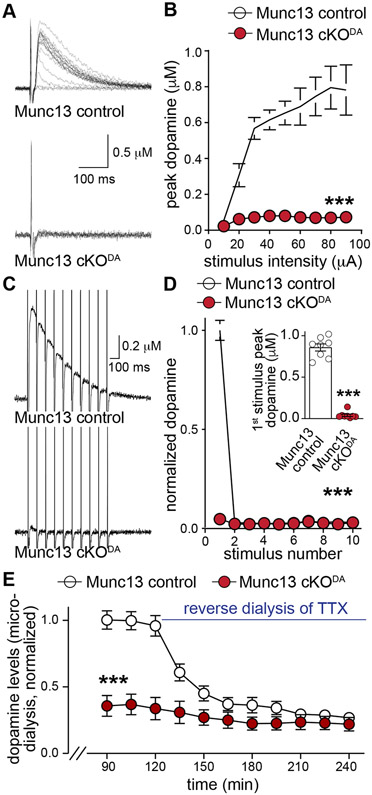
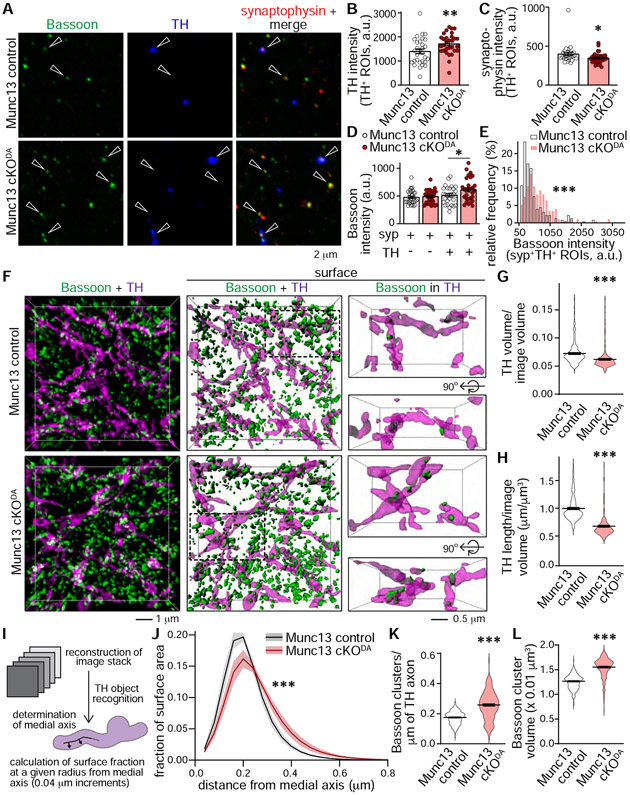
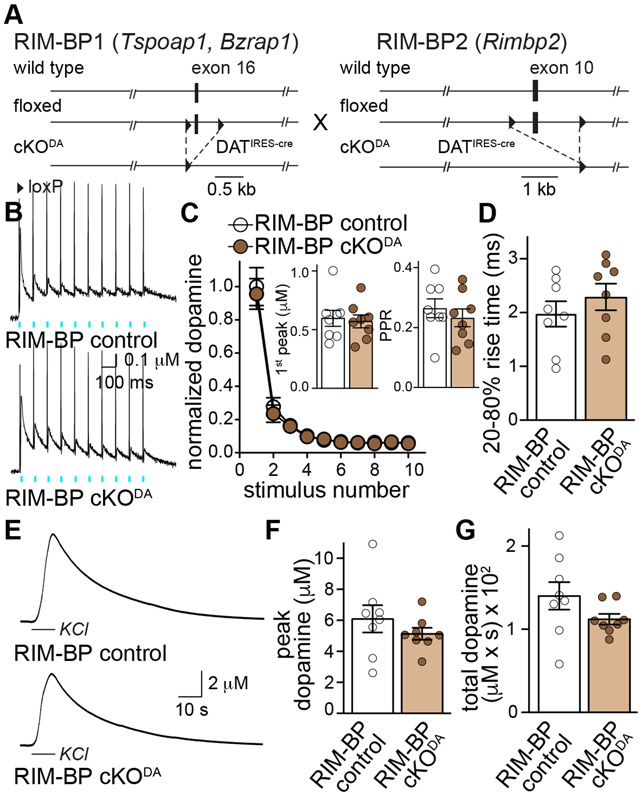
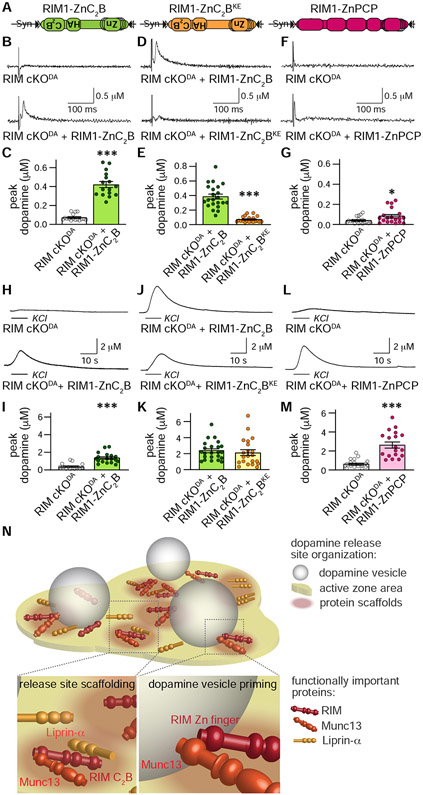
Despite the importance of dopamine for striatal circuit function, mechanistic understanding of dopamine transmission remains incomplete. We recently showed that dopamine secretion relies on the presynaptic scaffolding protein RIM, indicating that it occurs at active zone-like sites similar to classical synaptic vesicle exocytosis. Here, we establish using a systematic gene knockout approach that Munc13 and Liprin-α, active zone proteins for vesicle priming and release site organization, are important for dopamine secretion. Furthermore, RIM zinc finger and C2B domains, which bind to Munc13 and Liprin-α, respectively, are needed to restore dopamine release after RIM ablation. In contrast, and different from typical synapses, the active zone scaffolds RIM-BP and ELKS, and RIM domains that bind to them, are expendable. Hence, dopamine release necessitates priming and release site scaffolding by RIM, Munc13, and Liprin-α, but other active zone proteins are dispensable. Our work establishes that efficient release site architecture mediates fast dopamine exocytosis.

Keywords: Liprin-α; Munc13; RIM-BP; RIM1α; basal ganglia; dopamine; neuromodulation; secretion; striatum.


Conflict of interest statement

Declaration of interests The authors declare no competing interests. L.K. is currently an employee of Prescient Healthcare Group (Jersey City, NJ). R.-L.U. is currently an employee of Medaffcon Oy (Espoo, Finland). X.C. is a visiting graduate student from Xi’an Jiaotong University (China). N.B. is a member of the Neuron Advisory Board.

Figures

Figure 1.
Figure 1.. RIM N- and C-terminal domains are necessary for evoked dopamine release
(A) Schematic of RIM1α domain structure and protein interactions. (B) Strategy for ablation of RIM1αβ and RIM2αβγ in dopamine neurons (RIM cKODA) and schematic of slice recordings. (C, D) Sample traces (C, single sweeps) and quantification (D) of dopamine release in the dorsolateral striatum evoked by a 90-μA electrical stimulus and measured by carbon fiber amperometry in acute brain slices, 17 slices/3 mice each. (E, F) Sample traces (E) and quantification (F) of dopamine release evoked by a 100 mM KCl puff, 20/3 each. (G) Schematic of AAV5 rescue viruses injected either alone or together into the midbrain. For all AAVs, a double-floxed inverted strategy restricts expression to cre-expressing neurons. (H-M) Sample traces (H, J and L, single sweeps) and quantification (I, K and M) of dopamine release as in C and D, I: 12/4 each; K: RIM cKODA 9/3, RIM cKODA + RIM1-ΔZn 10/3; M: 15/4 each. (N-S) Same as H-L, but for a local 100 mM KCl puff, O: 11/4 each; Q: 10/3 each; S: RIM cKODA 16/4, RIM cKODA + RIM1-Zn + RIM1-ΔZn 17/4. Data are mean ± SEM, *** p < 0.001 as assessed by Mann-Whitney test. For means and errors, p-values and the number of observations used for statistics for this and all following figures, see corresponding Tables S1-S8. For rescue expression and additional recordings, see Fig. S1.
Figure 2.
Figure 2.. Munc13-1 is present in sparse clusters in dopamine axons
(A) Schematic of the Munc13-1-EYFP knock-in mice. (B) Sample 3D-SIM images of dorsolateral striatum stained with GFP antibodies (to detect Munc13-1) and TH antibodies (to visualize dopamine axons). Volume rendered images (10 x 10 x 2 μm3) showing Munc13-1 and TH (left), surface-rendered images of the same volumes (middle) and magnified view (right, 5 x 3 x 2 μm3 from dotted rectangle in middle, frontal and 90° rotated views of only Munc13-1 clusters with > 40% volume overlap with TH). (C-I) Quantification of B. For (H) and (I), each Munc13-1 object was locally (within 1 x 1 x 1 μm3) and randomly shuffled 1000 times, and the actual Munc13-1 densities and volumes were compared to the averaged result after shuffling, Munc13-1-EYFP 88 images/3 mice; wild type 86/3. Data are mean ± SEM, *** p < 0.001 as assessed by unpaired (C, D, E, F, G) and paired (H, I) t-tests.
Figure 3.
Figure 3.. Munc13 is essential for evoked dopamine release
(A) Targeting strategy for deletion of Munc13-1, -2 and -3 (Munc13 cKODA). (B) Schematic of cre-dependent expression of oChIEF and slice recording. (C-E) Sample traces (C, average of 4 sweeps) of dopamine release evoked by ten 1-ms light pulses at 10 Hz before and after TTX, quantification of the 1st stimulus amplitudes (D) and peak amplitudes normalized to the average 1st peak of Munc13 control (E), D: 5 slices/3 mice each, E: 6/3 each. (F-H) Sample traces (F), and quantification of KCl-triggered peak dopamine release (G) and area under the curve (H, start of puff to 50 s), 7/3 each. Data are mean ± SEM, ** p < 0.01, *** p < 0.001 as assessed by repeated measures one-way ANOVA followed by Sidak’s multiple comparisons tests in D; two-way ANOVA (*** p < 0.001 for genotype, stimulus number and interaction) followed by Sidak’s multiple comparisons tests in E (*** p < 0.001 for stimulus 1-4, ** p < 0.01 for stimulus 5), and Mann-Whitney test in G and H. For generation and analyses of Munc13-1 cKO mice, see Figs. S2 and S3; for extracellular recordings, see Fig. S4.
Figure 4.
Figure 4.. Roles for Munc13 in other modes of dopamine release
(A, B) Sample traces (A, single sweeps) and quantification of peak amplitudes (B) of dopamine release evoked by electrical stimulation (10-90 μA single electrical pulses), 10 slices/5 mice each. (C, D) Sample traces (C, average of 4 sweeps) and quantification of peak dopamine amplitudes normalized to the 1st peak amplitude of Munc13 control (D) in response to ten electrical pulses at 10 Hz, inset in D shows peak amplitude for the 1st stimulus, 8/4 each. (E) Quantification of extracellular dopamine levels within dorsal striatum measured by in vivo microdialysis. Values were normalized to average dopamine values of the 76th-120th min of Munc13 control. 10 μM TTX was reverse dialyzed starting at 121 min, 7 mice each. Data are mean ± SEM, ** p < 0.01, *** p < 0.001, as assessed by two-way ANOVA (p < 0.001 for genotype, stimulus intensity/stimulus number/time and interaction) in B, D and E followed by Sidak’s multiple comparisons tests (B: ** p < 0.01 for 20 μA, *** p < 0.001 for 30-90 μA; D: *** p < 0.001 for 1st stimulus; E: *** p < 0.001 for 90-150th min, ** p < 0.01 for 165-195th min), and Mann-Whitney test for inset in D.
Figure 5.
Figure 5.. Munc13 cKODA affects dopamine axon structure and Bassoon clustering
(A) Sample confocal images of striatal synaptosomes stained with the active zone marker Bassoon, the vesicle marker synaptophysin, and TH; synaptosomes co-expressing all three proteins (solid arrowhead) or non-dopaminergic synaptosomes (hollow arrows, no TH signal) are highlighted. (B-E) Quantification of A, E shows the frequency histogram for Bassoon intensity in syp+TH+ ROIs (E), B, C: 30 images/3 mice each; D: syp+TH 30/3 each; syp+TH+ 29/3 each; E: Munc13 control 221 ROIs/29 images/3 mice, Munc13 cKODA 168/29/3. (F) Sample 3D-SIM images (dimensions and overlap criteria as in Fig. 2B) of dorsolateral striatum stained for Bassoon and TH. (G-L) Quantification of F as in Fig. 2. In I, J, TH axon shape was assessed by determining the proportion of the axon surface at a specific distance from the medial axis of the TH-labelled axon, Munc13 control 163 images/4 mice; Munc13 cKODA 165/4 (G, H, K, L), 160/4 each (J). Data are mean ± SEM except for J (mean ± SD), * p < 0.05, ** p < 0.01, *** p < 0.001 as assessed by unpaired t-test in B, C, G, H, K and L; one-way ANOVA followed by Sidak’s multiple comparisons tests in D; Kolmogorov-Smirnov test in E and two-way ANOVA (*** p < 0.001 for genotype, distance and interaction) in J. For additional morphological analyses, see Fig. S5.
Figure 6.
Figure 6.. RIM-BP is dispensable for dopamine release
(A) Strategy for ablation of RIM-BP1 and RIM-BP2 in dopamine neurons (RIM-BP cKODA). (B-D) Sample traces of dopamine release (B, average of four sweeps) evoked by ten 1 ms-light pulses at 10 Hz, quantification of amplitudes (C) normalized to average of the first peak amplitude of RIM-BP control, peak amplitude evoked by the first stimulus and paired pulse ratios (PPR) of the 2nd to the 1st stimulus (C, inset), and 20-80% rise times (D), 8 slices/5 mice each. (E-G) Sample traces (E), quantification of peak amplitudes (F) and area under the curve (G) in response to a KCl puff, 8/3 each. Data are mean ± SEM, *** p < 0.001 as assessed by two-way ANOVA (*** for stimulus number, not significant (n.s.), for genotype, interaction) followed by Sidak’s multiple comparisons tests in C, and Mann-Whitney test in C (insets), F, and G. For electrical stimulation experiments, see Fig. S6.
Figure 7.
Figure 7.. Liprin-α is important for dopamine release
(A) Strategy for ablation of Liprin-α2 and Liprin-α3 (Liprin-α cKODA). (B) Sample 3D-SIM images (dimensions and overlap criteria as in Fig. 2B) of dorsolateral striatum stained for Bassoon and TH. (C-G) Quantification of B as in Fig. 5G-5L, Liprin control 84 images/4 mice; Liprin cKODA 85/4. (H-J) Sample traces of dopamine release (H, average of four sweeps) evoked by ten 1-ms light pulses at 10 Hz and quantification of amplitudes (I) normalized to the average of the first peak amplitude of RIM-BP control, 1st stimulus peak amplitude and PPR (I, inset), and 20-80% rise times (J), 11 slices/4 mice each. (K-M) Sample traces (K), quantification of peak amplitudes (L) and area under the curve (M) in response to a KCl puff, 12/8 each. Data are mean ± SEM, except for E (mean ± SD), ** p < 0.01, *** p < 0.001 as assessed by unpaired t-test in C, D, F, G; two-way ANOVA (*** p < 0.001 for distance and interaction, n.s. for genotype) in E; two-way ANOVA (*** p < 0.001 for genotype, stimulus number and interaction) followed by Sidak’s multiple comparisons tests in I (*** p < 0.001 for first and second stimuli), Mann-Whitney test in I (insets), J, L, M. For additional Liprin-α cKODA analyses, see Fig. S7.
Figure 8.
Figure 8.. RIM C2B domains are important for evoked dopamine release
(A) Schematic of AAV5 viruses injected into the midbrain for cre-dependent expression of rescue proteins. (B-G) Sample traces (B, D and F, single sweeps) and quantification (C, E and G) of dopamine release evoked by a 90 μA electrical stimulus, C: 16 slices/4 mice each; E: RIM cKODA + RIM1-ZnC2B 22/5, RIM cKODA + RIM1-ZnC2BKE 20/5; G: 19/4 each. (H-M) Same as B-G, but for a local 100 mM puff of KCl, I: 18/4 each; K: RIM cKODA + RIM1-ZnC2B 23/5, RIM cKODA + RIM1-ZnC2BKE 21/5; M: 18/4 each. (N) Model of an active zone-like site in dorsal striatum. RIM, Munc13, Liprin-α form release sites in dopamine varicosities, with Munc13 and RIM mediating dopamine vesicle priming and all three proteins contributing to scaffolding. Data are mean ± SEM, * p < 0.05, *** p < 0.001 as assessed by Mann-Whitney test in C, E, G, I, K and M. For wild type control recordings, additional rescue, and comparisons of all rescue experiments, see Fig. S8.

References

    1. Acuna C, Liu X, Gonzalez A, and Südhof TC (2015). RIM-BPs Mediate Tight Coupling of Action Potentials to Ca(2+)-Triggered Neurotransmitter Release. Neuron 87, 1234–1247. - PubMed
    1. Acuna C, Liu X, and Südhof TC (2016). How to Make an Active Zone: Unexpected Universal Functional Redundancy between RIMs and RIM-BPs. Neuron 91, 792–807. - PubMed
    1. Adams DJ, Quail MA, Cox T, van der Weyden L, Gorick BD, Su Q, Chan W, Davies R, Bonfield JK, Law F, et al. (2005). A genome-wide, end-sequenced 129Sv BAC library resource for targeting vector construction. Genomics 86, 753–758. - PubMed
    1. Agnati LF, Zoli M, Strömberg I, and Fuxe K (1995). Intercellular communication in the brain: Wiring versus volume transmission. Neuroscience 69, 711–726. - PubMed
    1. Andrews-Zwilling YS, Kawabe H, Reim K, Varoqueaux F, and Brose N (2006). Binding to Rab3A-interacting molecule RIM regulates the presynaptic recruitment of Munc13-1 and ubMunc13-2. J. Biol. Chem 281, 19720–19731. - PubMed

Publication types

LinkOut - more resources