

Analysis of the novel NCWELL database highlights two decades of co-occurrence of toxic metals in North Carolina private well water: Public health and environmental justice implications
- PMID: 34767890
- PMCID: PMC9733895
- DOI: 10.1016/j.scitotenv.2021.151479
Analysis of the novel NCWELL database highlights two decades of co-occurrence of toxic metals in North Carolina private well water: Public health and environmental justice implications
Abstract
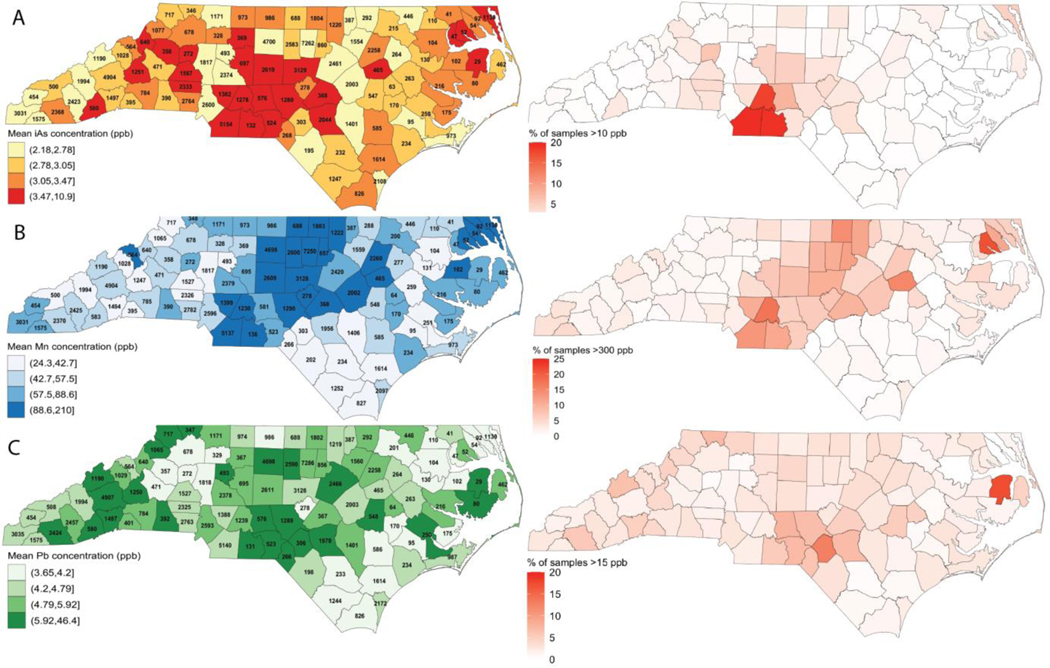
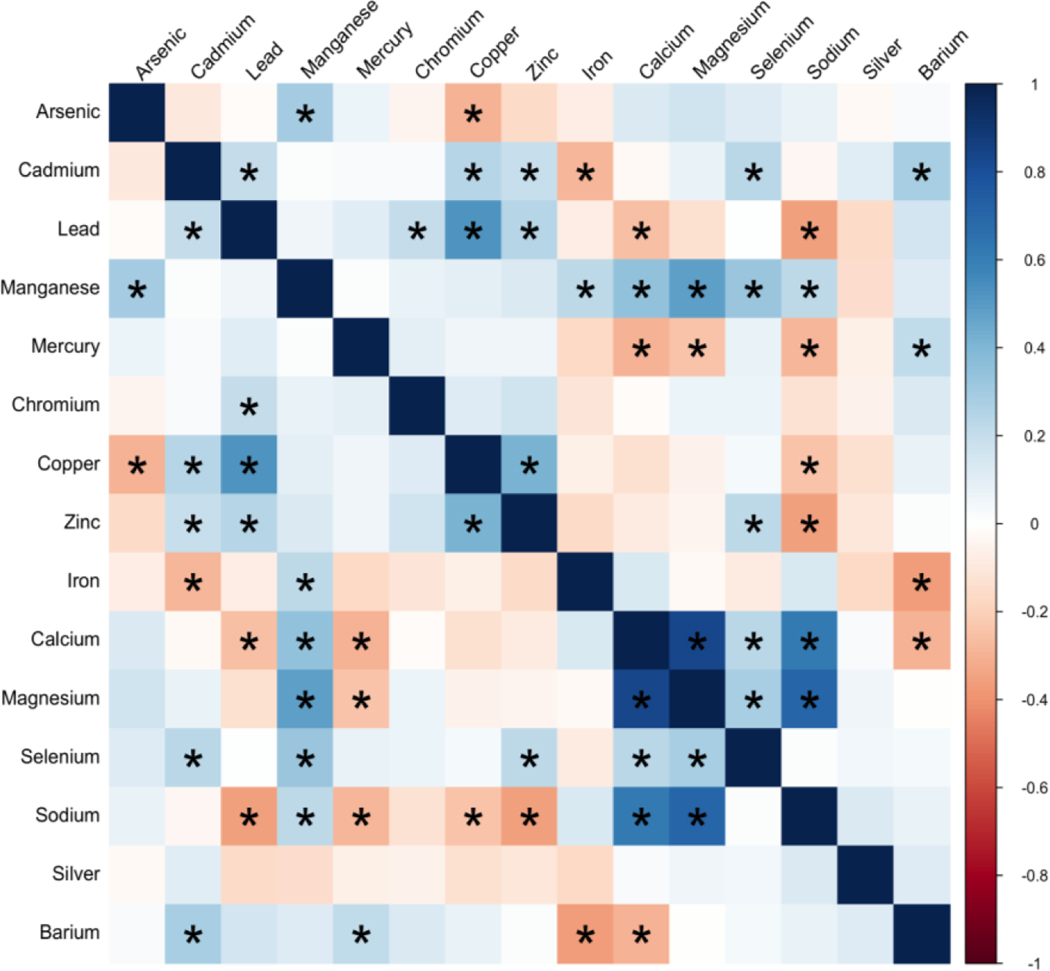
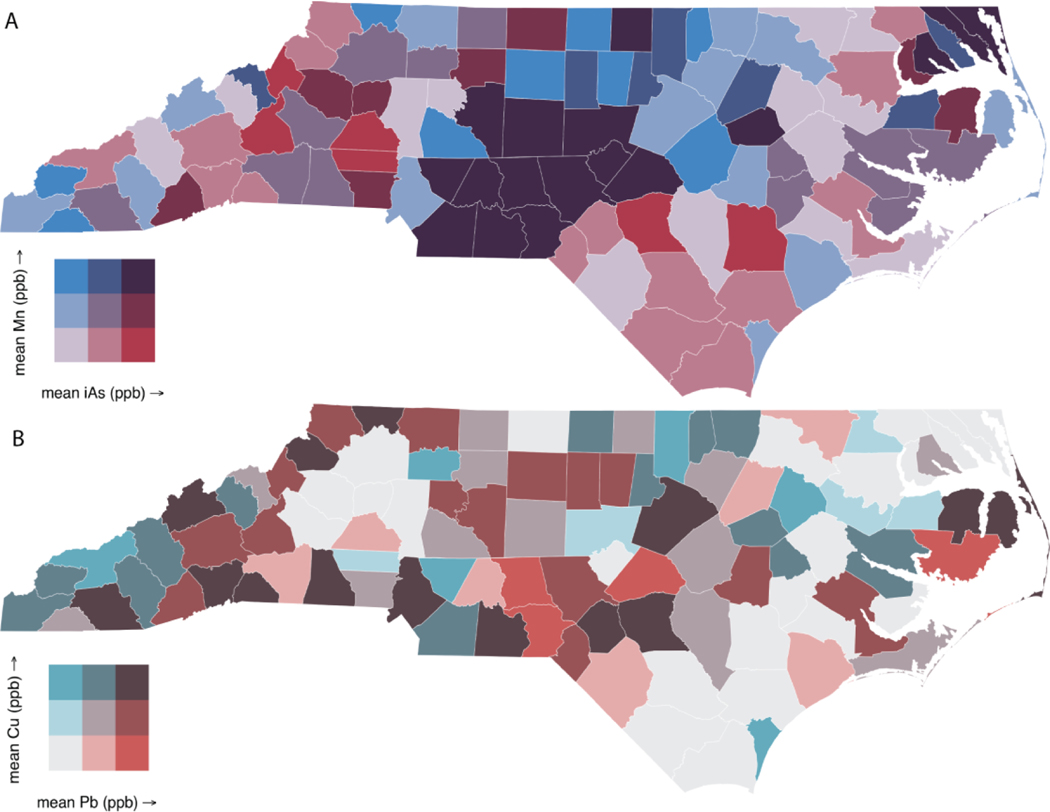
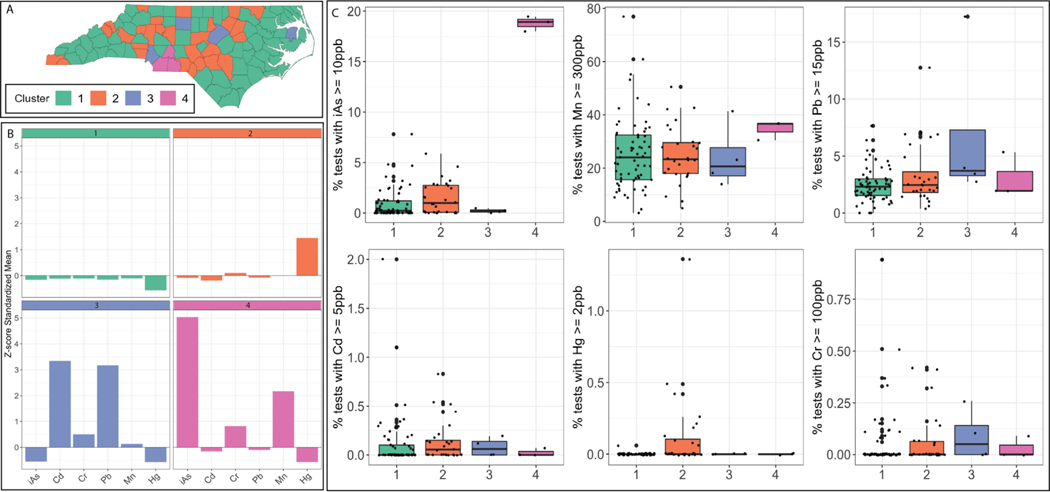
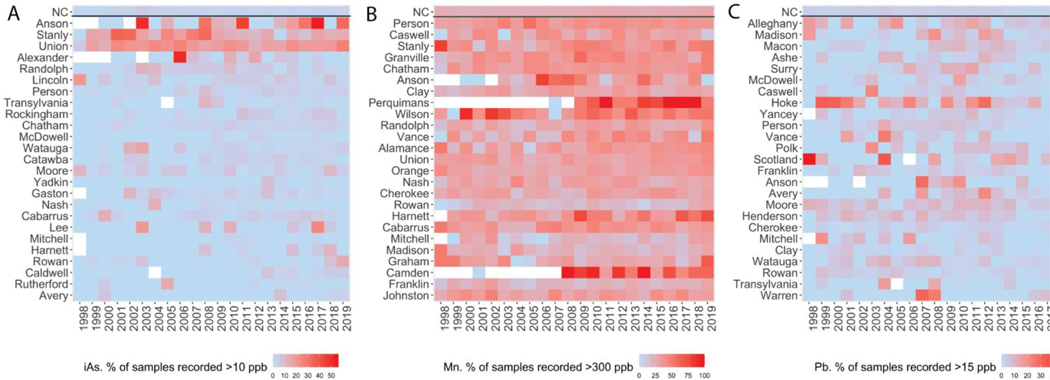
Private well users are particularly vulnerable to metal exposure as they are not protected by the Safe Drinking Water Act. In North Carolina (NC), approximately 2.4 million individuals rely on private well water. In the present study, we constructed the NCWELL database: a comprehensive database of 117,960 geocoded well water tests over twenty-years in NC inclusive of 28 metals/metalloids. The NCWELL database was analyzed to identify areas of concern for single and co-occurring toxic metal contamination of private wells in NC. County-level population-at-risk rankings were calculated by combining toxic metal levels and the proportion of residents relying on well water. Additionally, k-means analysis was used to identify counties with critical co-occurrence of toxic metals. In the NCWELL database, inorganic arsenic (iAs) and lead (Pb) were detected above the EPA standards of 10 and 15 ppb in over 2500 and over 3000 tests, respectively. Shockingly, iAs was observed at levels up to 806 ppb and Pb at levels up to 105,440 ppb. Manganese (Mn) was detected above the EPA lifetime Health Advisory Limit in 4.9% and above the secondary Maximum Contaminant Level in 24.3% of all well water tests in NC, with a maximum concentration of 46,300 ppb reported. Mixtures-based analysis identified four distinct clusters of counties, one demonstrating high iAs and Mn and another with high Pb. Over the twenty-year period, metal levels remained high, indicative of sustained contamination in areas of concern. This study provides a novel database for researchers and concerned citizens in NC, demonstrates a methodology for identifying priority geographic regions for single and multiple contaminants, and has environmental justice implications in NC where metal exposure via private well water remains a serious public health concern.
Keywords: Arsenic; Geocoding; K-means clustering; Lead; Manganese; Private wells.
Copyright © 2021 Elsevier B.V. All rights reserved.
Conflict of interest statement
Declaration of competing interest The authors declare that they have no known competing financial interests or personal relationships that could have appeared to influence the work reported in this paper.
Figures
References
-
- Aiken CS. Race as a factor in municipal underbounding. Annals of the Association of American Geographers. 1987. Dec;77(4):564–79.
-
- Andrews KW, Savitz DA, Hertz-Picciotto I. Prenatal lead exposure in relation to gestational age and birth weight: a review of epidemiologic studies. Am J Ind Med. 1994. Jul;26(1):13–32. - PubMed
-
- ATSDR. Substance Priority List. ATSDR; 2019.
-
- Ayotte JD, Montgomery DL, Flanagan SM, Robinson KW. Arsenic in groundwater in eastern New England: occurrence, controls, and human health implications. Environ Sci Technol. 2003. May 15;37(10):2075–83. - PubMed
MeSH terms
Substances
Grants and funding
LinkOut - more resources
Full Text Sources
Medical
Research Materials
