. 2022 Mar 2;30(3):1300-1314.
doi: 10.1016/j.ymthe.2021.11.006. Epub 2021 Nov 10.

Microglia secrete miR-146a-5p-containing exosomes to regulate neurogenesis in depression

Affiliations

Microglia secrete miR-146a-5p-containing exosomes to regulate neurogenesis in depression

Cuiqin Fan et al. Mol Ther. .

Abstract

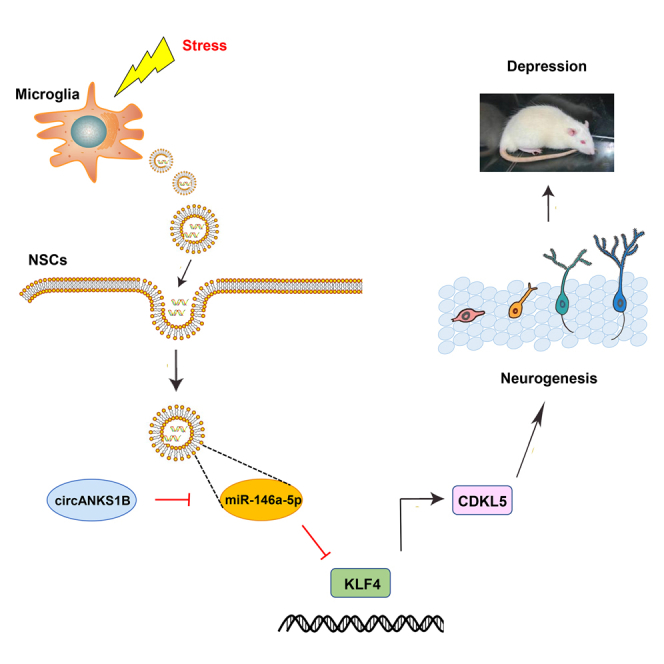
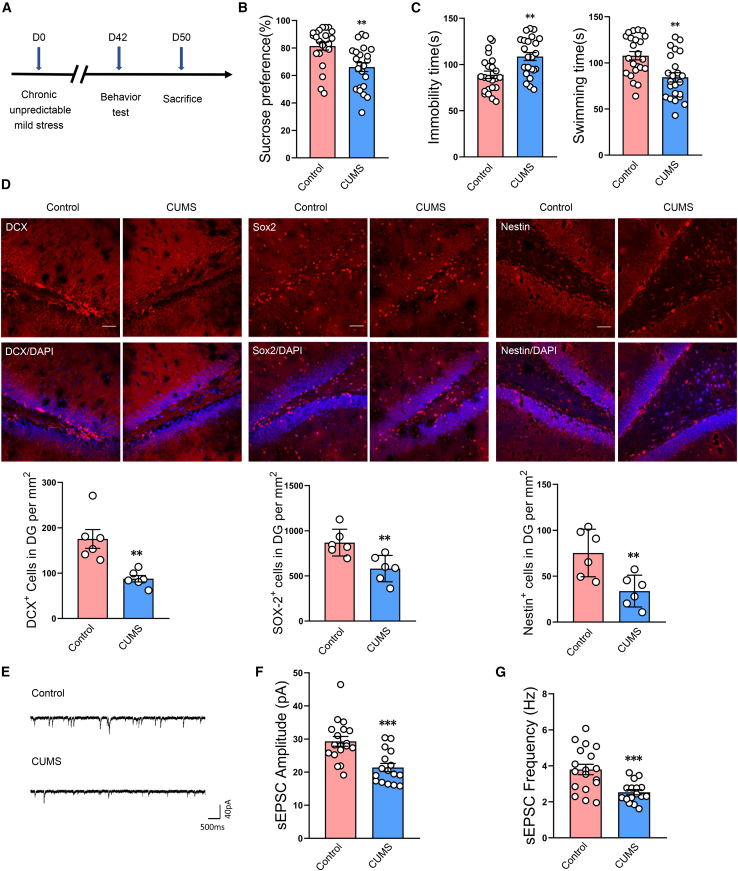
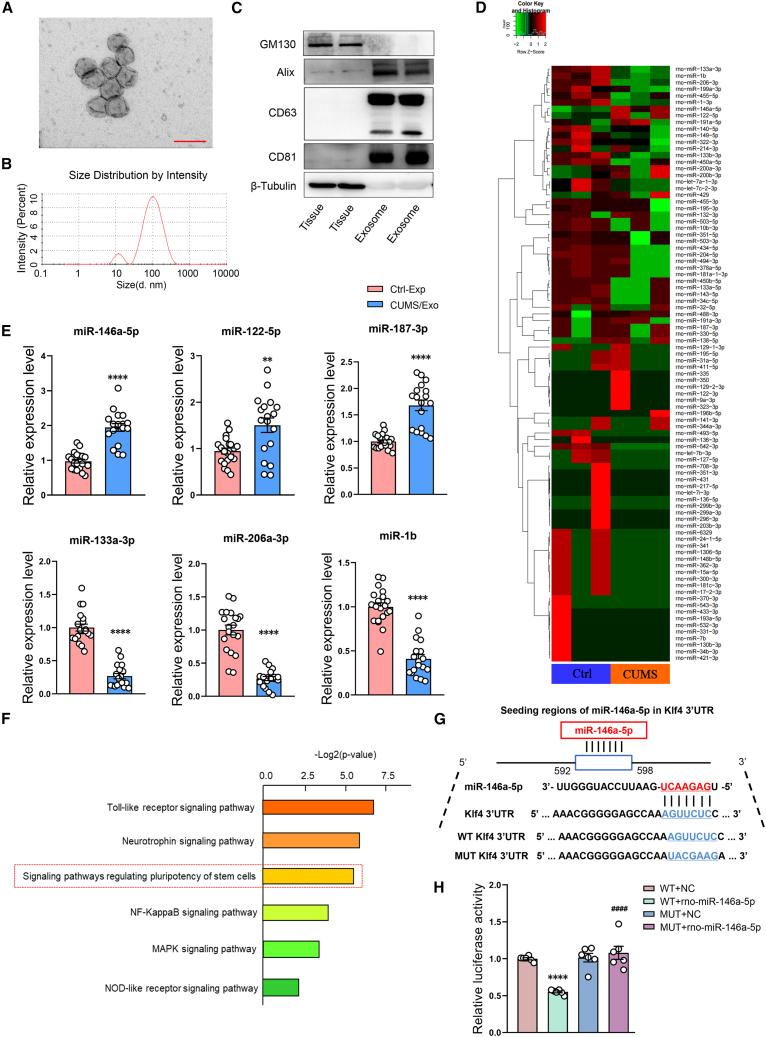
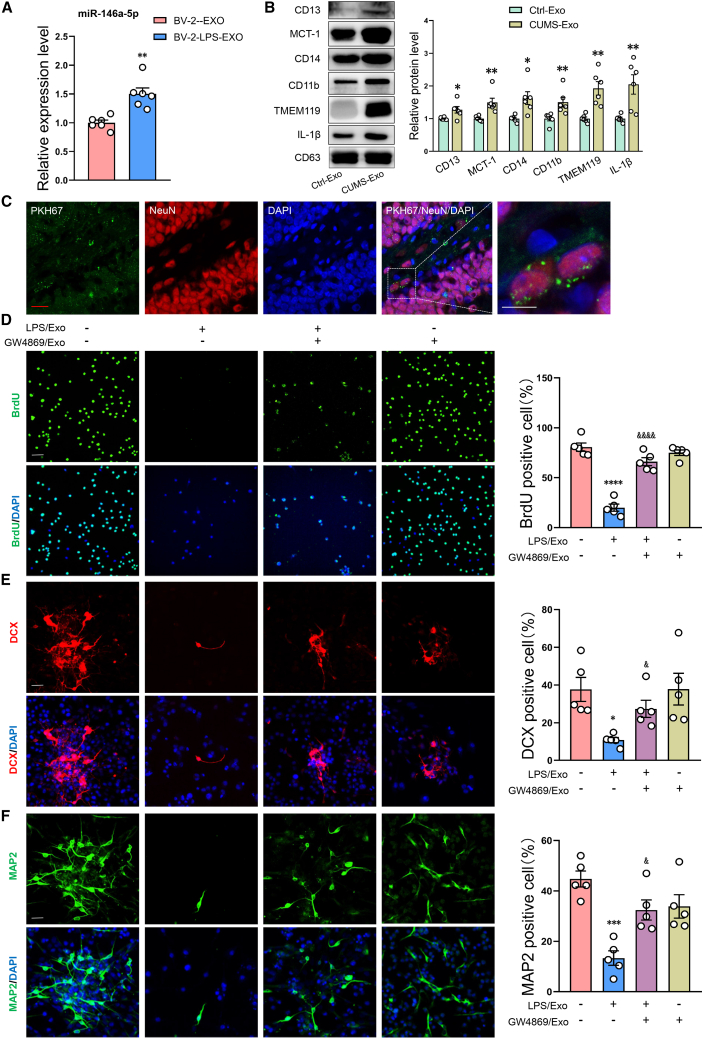
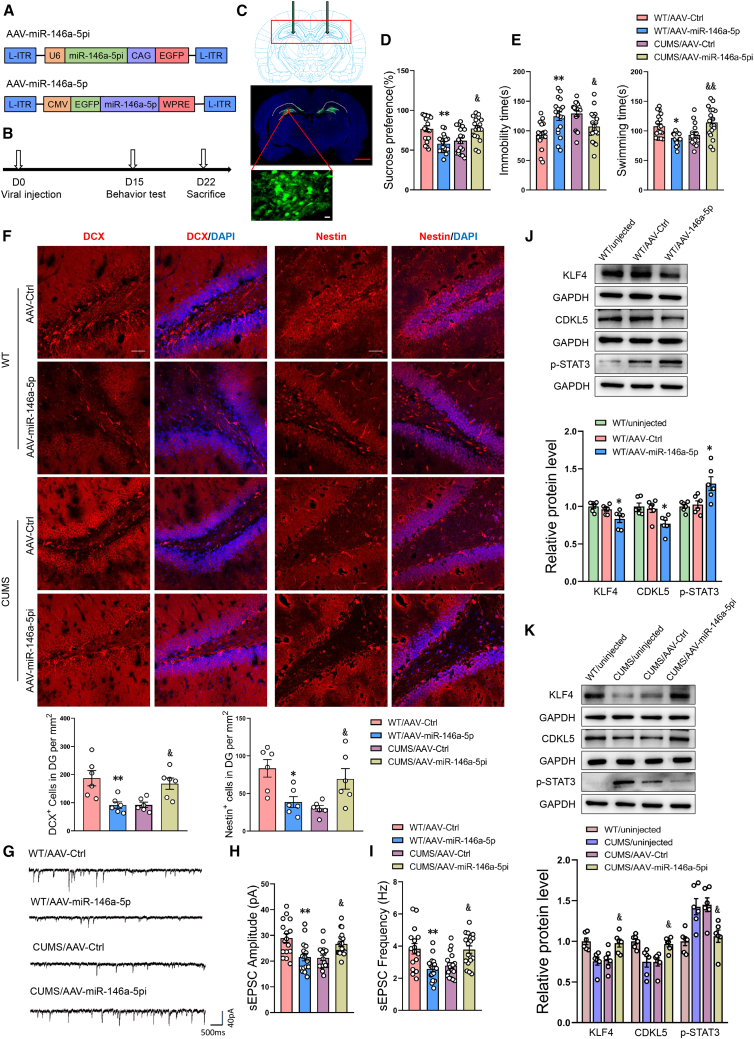
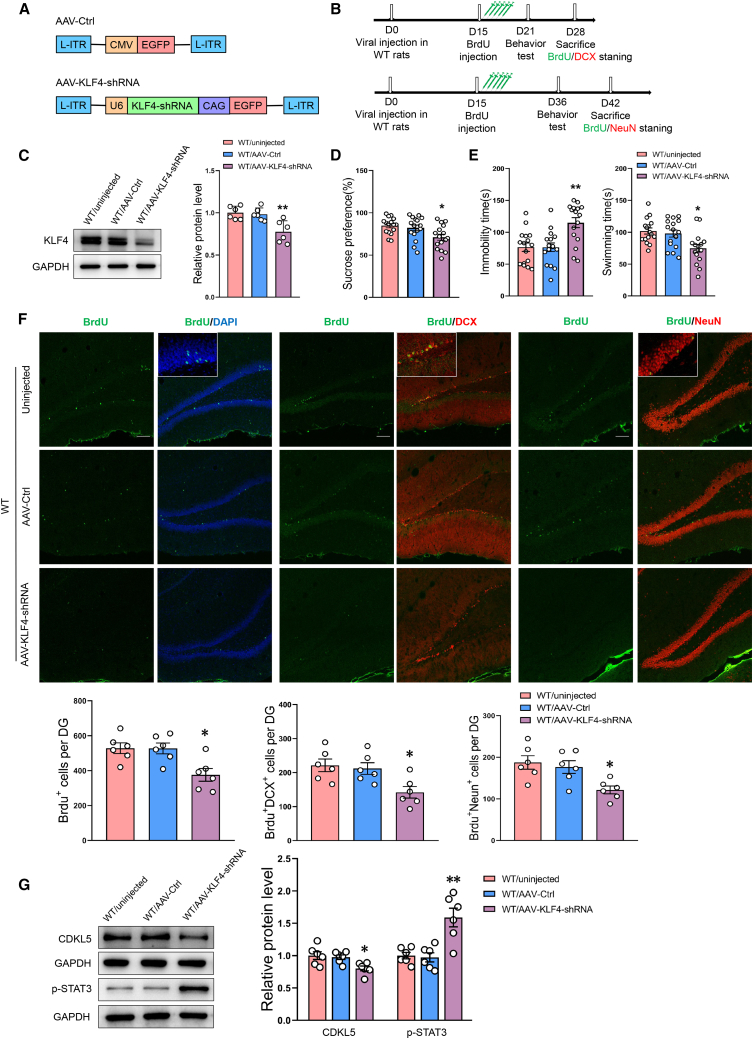
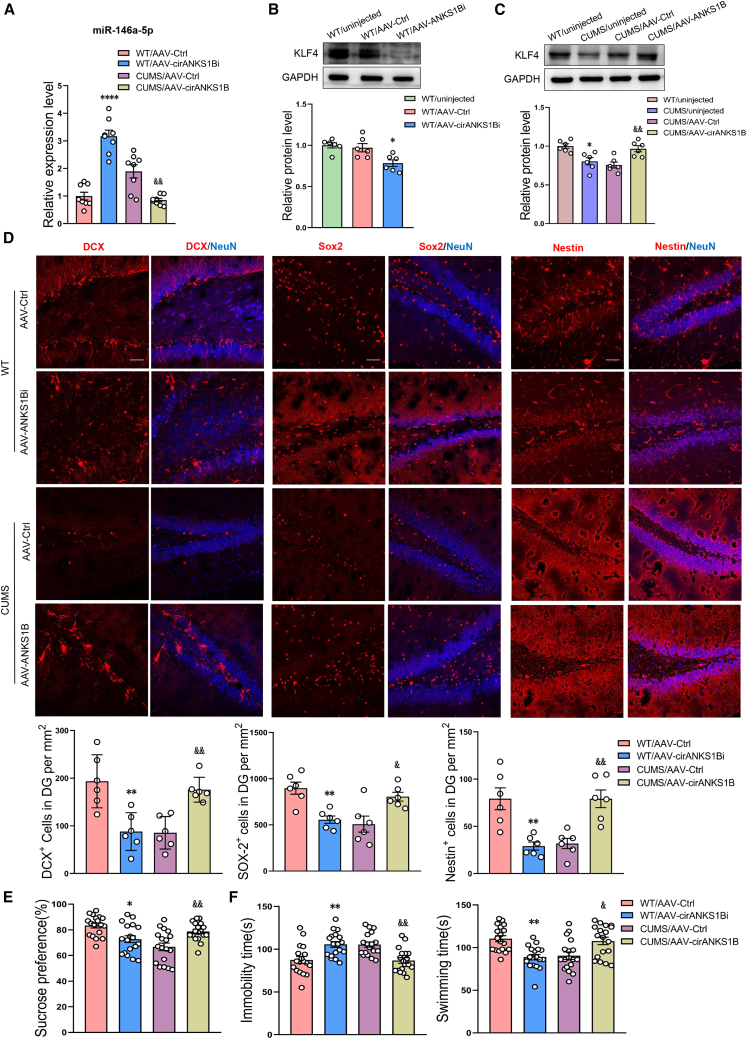
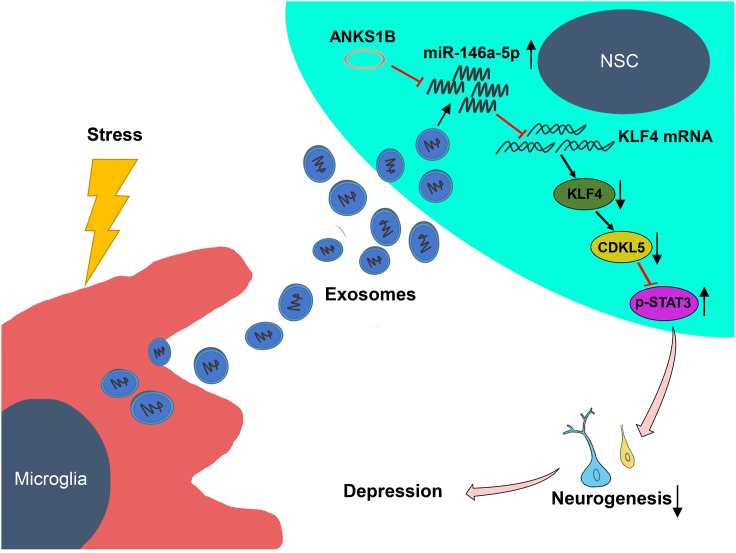
Enhancing neurogenesis within the hippocampal dentate gyrus (DG) is critical for maintaining brain development and function in many neurological diseases. However, the neural mechanisms underlying neurogenesis in depression remain unclear. Here, we show that microglia transfer a microglia-enriched microRNA, miR-146a-5p, via secreting exosomes to inhibit neurogenesis in depression. Overexpression of miR-146a-5p in hippocampal DG suppresses neurogenesis and spontaneous discharge of excitatory neurons by directly targeting Krüppel-like factor 4 (KLF4). Downregulation of miR-146a-5p expression ameliorates adult neurogenesis deficits in DG regions and depression-like behaviors in rats. Intriguingly, circular RNA ANKS1B acts as a miRNA sequester for miR-146a-5p to mediate post-transcriptional regulation of KLF4 expression. Collectively, these results indicate that miR-146a-5p can function as a critical factor regulating neurogenesis under conditions of pathological processes resulting from depression and suggest that microglial exosomes generate new crosstalk channels between glial cells and neurons.

Keywords: circ-ANKS1B; depression; exosomes; miR-146a-5p; microglia; neurogenesis.


Conflict of interest statement

Declaration of interests The authors declare no competing interests.

Figures

None
Graphical abstract
Figure 1
Figure 1
Neurogenesis is reduced in DG regions of CUMS rats (A) Schematic diagram of experimental design. (B and C) Rats were assessed for depression-like behaviors in the sucrose preference test (SPT) (B) and forced swim test (FST) (C) after 5 weeks of CUMS exposure. n = 23 per group. ∗∗p < 0.01 CUMS versus control. (D) Representative confocal microscopic images of immunostainings for Sox2+, DCX+, and Nestin+ cells in DG regions of the hippocampus. Scale bars, 50 μm. n = 6 per group. ∗∗p < 0.01 CUMS versus control. (E) Representative post-synaptic current (sEPSC) from whole-cell recordings of spontaneous excitatory activity of DG neurons in control and CUMS rats. (F–G) Cumulative fraction plots of sEPSC amplitudes (F) and frequencies (G) of DG neurons in control and CUMS rats. n = 18 neurons from 7 control rats and n = 16 neurons from 6 CUMS rats. ∗∗∗p < 0.001 CUMS versus control. Data represent means ± SEM. Student’s t tests for comparisons between the two groups (B–D, F, and G).
Figure 2
Figure 2
miR-146a-5p is upregulated in serum-derived exosomes of CUMS rats (A) Representative transmission electron microscopy images of rat serum-derived exosomes. Scale bar, 200 nm. n = 6 per group. (B) Representative nanoparticle tracking analysis of exosomes derived from rat serum. n = 6 per group. (C) Representative western blot images of relative protein levels for CD63, CD81, Alix, GM130, and β-tubulin in rat serum-derived exosomes. n = 5 per group. (D) Heatmap of miRNAs expressed in exosomes derived from control and CUMS rat serum. n = 3 per group. (E) Relative expression levels of miR-146a-5p, miR-122-5p, miR-187-3p, miR-133a-3p, miR-206-3p, and miR-1b in exosomes obtained from control and CUMS rat serum. SnRNAU6 as the internal controls. Control, n = 20; CUMS, n = 18. ∗∗p < 0.01, ∗∗∗∗p < 0.0001 CUMS-Exo versus Ctrl-Exo. (F) Bar graphs represent magnitudes of significant correlations for miR-146a-5p-mediated signaling pathways as indicated by respective p values (−log2 scaled). (G and H) Predicted putative seed-matching sites between miR-146a-5p and KLF4 (G) and Luciferase reporter assay results as performed on 293T cells to detect relative luciferase activities of WT and MUT KLF4 reporters (H). n = 6 per group. ####p < 0.0001 WUT + rno-miR-146a-5p versus WT + rno-miR-146a-5p, ∗∗∗∗p < 0.0001 WT + rno-miR-146a-5p versus WT + NC. Data represent means ± SEM. Student’s t tests for comparisons between the two groups (E). One-way ANOVA with Tukey's post hoc test for multiple comparisons involving >2 groups (F). WT, wild type; MUT, mutation; NC, normal control; Ctrl, control.
Figure 3
Figure 3
Internalization of microglia-derived exosomes in DG neurons and effects on neuronal differentiation and migration (A) Relative expression levels of miR-146a-5p in BV-2-derived exosomes. SnRNAU6 as the internal controls. n = 6 per group. ∗∗p < 0.01 BV-2-LPS-Exo versus BV-2-untreated-Exo. (B) Representative western blot images of relative protein levels for CD13, MCT-1, CD14, IL-1β, TMEM119, CD11b, and CD63 in rat serum-derived exosomes. n = 6 per group. ∗p < 0.05 CUMS-Exo versus Ctrl-Exo. (C) Confocal microscopy images showing internalization of exosomes in DG neurons of the hippocampus. Scale bars, 10 μm (white), 10 μm (red). n = 6 per group. (D–F) Exosomes derived from LPS-treated BV-2 cells (LPS/Exo) or GW4869-treated BV-2 cells (GW4869/Exo) were added into the medium. Proliferation (D) and differentiation (E and F) of neuronal stem cells (NSCs) as determined in vitro using immunofluorescence. Scale bars, 30 μm. n = 5 per group. ∗∗p < 0.01, ∗∗∗p < 0.001, ∗∗∗∗p < 0.0001 LPS/Exo group (exosomes from LPS-treated BV-2 cells) versus naive group (exosomes from non-LPS- and non-GW4869-treated BV-2 cells), &p < 0.05, &&p < 0.01 LPS/GW4869/Exo group (exosomes from LPS- and GW4869-treated BV-2 cells) versus LPS/Exo group (exosomes from LPS-treated BV-2 cells). Data represent means ± SEM. Student’s t tests for comparisons between the two groups (A and B). One-way ANOVA with Tukey's post hoc test for multiple comparisons involving >2 groups (D–F). Ctrl, control.
Figure 4
Figure 4
MiR-146a-5p in DG regions is associated with depression-like phenotypes and suppression of neurogenesis via the KLF4/CDKL5 pathway (A) Schematics of AAV vectors engineered to overexpress miR-146a-5p or knockdown miR-146a-5p and their corresponding controls. (B) Experimental paradigm for determining behavioral responses of rats infected with the virus. (C) Illustration of viral infusion into the rat DG regions. Scale bars, 2 mm (red), 20 μm (white). (D and E) Behavioral effects of expressing various viral constructs in DG regions as shown for the sucrose preference test (SPT) (D) and forced swim test (FST) (E). n = 18 per group. ∗p < 0.05, ∗∗p < 0.01 WT/AAV-miR-146a-5p versus WT/AAV-Ctrl, &p < 0.05, &&p < 0.01 CUMS/AAV-miR-146a-5pi versus CUMS/AAV-Ctrl. (F) Representative confocal microscopic images of immunostainings for DCX+ and Nestin+ cells in the DG regions. Scale bars, 50 μm. n = 6 per group. ∗p < 0.05, ∗∗p < 0.01 WT/AAV-miR-146a-5p versus WT/AAV-Ctrl, &p < 0.05 CUMS/AAV-miR-146a-5pi versus CUMS/AAV-Ctrl. (G) Representative traces of sEPSC in DG neurons of rats infected with the virus. (H and I) Cumulative fraction plots of sEPSC amplitudes (H) and frequencies (I) in neurons of rat DG regions. n = 16 neurons from 6 WT/AAV-Ctrl rats, n = 16 neurons from 7 WT/AAV-miR-146a-5p rats, n = 18 neurons from 6 CUMS/AAV-Ctrl rats, and n = 18 neurons from 6 CUMS/AAV-miR-146a-5pi rats. ∗∗p < 0.01 WT/AAV-miR-146a-5p versus WT/AAV-Ctrl, &p < 0.05, &&p < 0.01 CUMS/AAV-miR-146a-5pi versus CUMS/AAV-Ctrl. (J) Representative western blot images showing relative protein levels of KLF4 and CDKL5, and phosphorylation of STAT3 in AAV-miR-146a-5p-infected DGs of WT rats. n = 6 per group. ∗p < 0.05 WT/AAV-miR-146a-5p versus WT/AAV-Ctrl. (K) Representative western blot images showing relative protein levels of KLF4 and CDKL5, and phosphorylation of STAT3 in AAV-miR-146a-5pi-infected DGs of CUMS rats. n = 6 per group. &p < 0.05 CUMS/AAV-miR-146a-5pi versus CUMS/AAV-Ctrl rat. Data represent means ± SEM. One-way ANOVA with Tukey's post hoc test for multiple comparisons involving >2 groups (D–F, H–K). Ctrl, control.
Figure 5
Figure 5
Blocking KLF4 in DG regions induces depression-like behaviors in normal rats and inhibits neurogenesis through the P-STAT3/CDKL5 pathway (A) Schematics of AAV vectors engineered to knock down KLF4 and their corresponding controls. (B) Experimental paradigm for determining behavioral responses of rats infected with the virus and BrdU. (C) Representative western blot images showing the knockdown efficiency of KLF4. n = 6 per group. ∗∗p < 0.01 WT/AAV-KLF4-shRNA versus WT/AAV-Ctrl rats. (D and E) Behavioral responses in the SPT (D) and FST (E) of rats with knockdown of viral AAV- KLF4-shRNA in the DG regions. n = 16 per group. ∗p < 0.05, ∗∗p < 0.01 WT/AAV-KLF4-shRNA versus WT/AAV-Ctrl rats. (F) Representative confocal microscopic images of immunostainings for cell numbers of BrdU+, BrdU+/DCX+, and BrdU+/NeuN+ in the DG. Scale bars, 50 μm. n = 6 per group. ∗p < 0.05 WT/AAV-KLF4-shRNA versus WT/AAV-Ctrl rats. (G) Representative western blot images showing relative protein levels of CDKL5 and phosphorylation of STAT3 in virus-infected DGs. n = 6 per group. ∗p < 0.05, ∗∗p < 0.01 WT/AAV-KLF4-shRNA versus WT/AAV-Ctrl rats. Data represent means ± SEM. One-way ANOVA with Tukey's post hoc test for multiple comparisons involving >2 groups (C–G). WT, wild type; Ctrl, control.
Figure 6
Figure 6
circANKS1B regulates neurogenesis in the DG region through the miR-146a-5p/KLF4 pathway (A) Relative expression levels of miR-146a-5p in DG regions infected with the AAV- circANKS1B-shRNA or the AAV-circANKS1B virus. n = 6 per group. ∗∗∗∗p < 0.0001 WT/AAV-circANKS1Bi versus WT/AAV-Ctrl, &&p < 0.01 CUMS/AAV-circANKS1B versus CUMS/AAV-Ctrl. (B and C) Representative western blot images showing relative protein levels of KLF4 in DG regions infected with the AAV-circANKS1B-shRNA (B) or the AAV-circANKS1B (C) virus. n = 6 per group. ∗p < 0.05 WT/AAV-circANKS1Bi versus WT/AAV-Ctrl, &&p < 0.01 CUMS/AAV-circANKS1B versus CUMS/AAV-Ctrl. (D) Representative confocal microscopic images of immunostainings for DCX+, Sox2+, and Nestin+ cells in DG regions infected with the virus. Scale bars, 50 μm. n = 6 per group. ∗∗p < 0.01 WT/AAV-circANKS1Bi versus WT/AAV-Ctrl, &p < 0.05, &&p < 0.01 CUMS/AAV-circANKS1B versus CUMS/AAV-Ctrl. (E and F) Behavioral responses in the SPT (E) and FST (F) of rats with expression of the AAV-circANKS1B-shRNA construct in the DG of WT rats and the AAV-circANKS1B construct in the DG of CUMS rats. n = 18 per group. ∗p < 0.05, ∗∗p < 0.01 WT/AAV-circANKS1Bi versus WT/AAV-Ctrl, &p < 0.05, &&p < 0.01 CUMS/AAV-circANKS1B versus CUMS/AAV-Ctrl. Data represent means ± SEM. One-way ANOVA with Tukey's post hoc test for multiple comparisons involving >2 groups (A–F). WT, wild type; Ctrl, control.
Figure 7
Figure 7
Stress-triggered microglia secrete exosomes containing miR-146a-5p to regulate neurogenesis via the miR-146a-5p/KLF4 signaling pathway in depression ANKS1B, circRNA-ANKS1B; NSC, neural stem cell.

References

    1. Malhi G.S., Coulston C.M., Fritz K., Lampe L., Bargh D.M., Ablett M., Lyndon B., Sapsford R., Theodoros M., Woolfall D., et al. Unlocking the diagnosis of depression in primary care: which key symptoms are GPs using to determine diagnosis and severity? Aust. N. J. Psychiatry. 2014;48:542–547. - PubMed
    1. Malhi G.S., Mann J.J. Depression. Lancet. 2018;392:2299–2312. - PubMed
    1. Wong C.H., Siah K.W., Lo A.W. Estimation of clinical trial success rates and related parameters. Biostatistics. 2019;20:366. - PMC - PubMed
    1. Willner P. Chronic mild stress (CMS) revisited: consistency and behavioural-neurobiological concordance in the effects of CMS. Neuropsychobiology. 2005;52:90–110. - PubMed
    1. Schmaal L., Hibar D.P., Samann P.G., Hall G.B., Baune B.T., Jahanshad N., Cheung J.W., van Erp T.G.M., Bos D., Ikram M.A., et al. Cortical abnormalities in adults and adolescents with major depression based on brain scans from 20 cohorts worldwide in the ENIGMA Major Depressive Disorder Working Group. Mol. Psychiatry. 2017;22:900–909. - PMC - PubMed

Publication types

LinkOut - more resources