

Review
doi: 10.3390/jcm10215193.
Dual-Energy Heart CT: Beyond Better Angiography-Review
Affiliations
- PMID: 34768713
- PMCID: PMC8584316
- DOI: 10.3390/jcm10215193
Item in Clipboard
Review
Dual-Energy Heart CT: Beyond Better Angiography-Review
J Clin Med.
.
Abstract
Heart CT has undergone substantial development from the use of calcium scores performed on electron beam CT to modern 256+-row CT scanners. The latest big step in its evolution was the invention of dual-energy scanners with much greater capabilities than just performing better ECG-gated angio-CT. In this review, we present the unique features of dual-energy CT in heart diagnostics.
Keywords: coronary arteries; dual-energy CT; heart; spectral computed tomography.
Conflict of interest statement
The authors declare no conflict of interest.
Figures
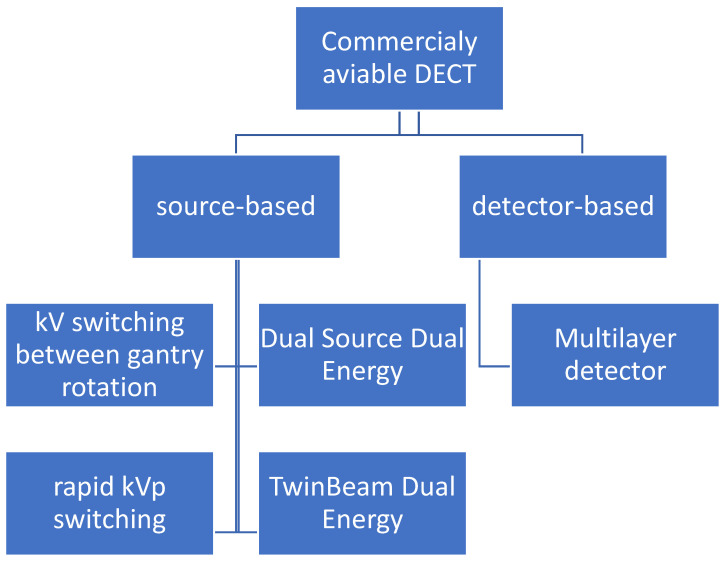
Technical source of dual-energy data. There are five commercially available types of CT scanners: four of them are source-based and only one is detector-based. DECT, dual-energy CT.

Series of curved MPR of RCA at different energy VMIs: (A)—40 keV, (B)—50 keV, (C)—60 keV, (D)—70 keV, (E)—80 keV, (F)—100 keV, (G)—120 keV, (H)—140 keV. The best contrast to noise ratio is at 60–70 keV images (C,D) Lower energies have higher iodine density but also much higher noise. Higher-energy VMIs (F–H) are less useful due to low contrast density. (I)—curved MPR reconstructed from iodine(water) map can also be used to assess lumen of RCA.

Curved VMI reconstruction of coronary graft of poorly enhanced CTA. Three reconstructions with different energies ((A)—80 kev, (B)—60 keV, (C)—50 keV) and the same window and level settings. Contrast density is rising with lower energies, but also noise and artifacts from metal clips around graft.

Features of venerable plaques. (A,B)—spotty calcification—calcification smaller than 3 mm and less than 150% lumen diameter (A)—short axis view, (B)—curved MPR of the vessel; (C,D)—positive wall remodeling—outer diameter of involved section of the vessel at least 110% of non-involved part of vessel; (E,F)—both plaques are noncalcified and low density (<30 HU) corresponding to cholesterol reach core, (F)—napkin ring sign—hyperdense outer part of noncalcified plaque.

MPR MIP image of true unenhanced image (A) and water (iodine) map (B) showing calcifications in the LCx. The volume of calculated calcifications was 85 mL and 88 mL, respectively. Similar results, showing high correlation between calcium volume calculated from TUN and VUIs, were reported by [24].

At 70 keV VMI, the subepicardial region of lateral wall of increased density is visible in delayed phase (A); it is caused by increased iodine uptake and reduced water concentration (B,C).

(A–D). Case of patient with chronic atrial fibrillation after 3 unsuccessful ablations, currently admitted due to chest pain. Coronary CTA was performed to roll out coronary artery stenosis. Differentiating thrombus and filling defect of LAA using iodine concentration is much more specific and sensitive than the use of Hounsfield unities ratio, as proven by Hur et al. [64]. (A)—Histogram of iodine concentration in ROIs; (B)—map iodine(water) shows lower concentration of iodine in LAA of about 4.1 mg/mL, meeting the criteria for circulatory stasis by Hur et al.; (C,D)–70 keV VMI with color overlay of iodine(water) map. (D)–in log axis of LAA. In the lower right corner of sub-image B-C-D information about viewpoint.

(A–D). Reduction in artifacts originating from pacemaker electrode using high-energy VMI (C,D). Phantom study. GSI, gemstone spectral imaging.

Dual-energy coronary CTA performed due to worsening of dyspnea and suspected CAD. There is small clot in peripheral artery in segment 9 of right lung which can be easily misted in axial VMI at 70 keV (A). There is a large V-shape aerial of hypoperfusion visible in sagittal reformat on iodine(water) map in segment 9 (B); similar aerials were discovered in segments: 4R and 5R. Finally, diagnosis of chronic peripheral pulmonary embolism was made.
References
-
- Siegel M.J., Kaza R.K., Bolus D.N., Boll D.T., Rofsky N.M., De Cecco C.N., Foley W.D., Morgan D.E., Schoepf U.J., Sahani D.V., et al. White Paper of the Society of Computed Body Tomography and Magnetic Resonance on Dual-Energy Ct, Part 1: Technology and Terminology. J. Comput. Assist. Tomogr. 2016;40:841–845. doi: 10.1097/RCT.0000000000000531. - DOI - PubMed
-
- Fredenberg E. Spectral and Dual-Energy X-ray Imaging for Medical Applications. Nucl. Instrum. Methods Phys. Res. Sect. A Accel. Spectrometers Detect. Assoc. Equip. 2018;878:74–87. doi: 10.1016/j.nima.2017.07.044. - DOI
Publication types
LinkOut - more resources
Full Text Sources
