

Curcumin Alleviates the Senescence of Canine Bone Marrow Mesenchymal Stem Cells during In Vitro Expansion by Activating the Autophagy Pathway
- PMID: 34768788
- PMCID: PMC8583405
- DOI: 10.3390/ijms222111356
Curcumin Alleviates the Senescence of Canine Bone Marrow Mesenchymal Stem Cells during In Vitro Expansion by Activating the Autophagy Pathway
Abstract
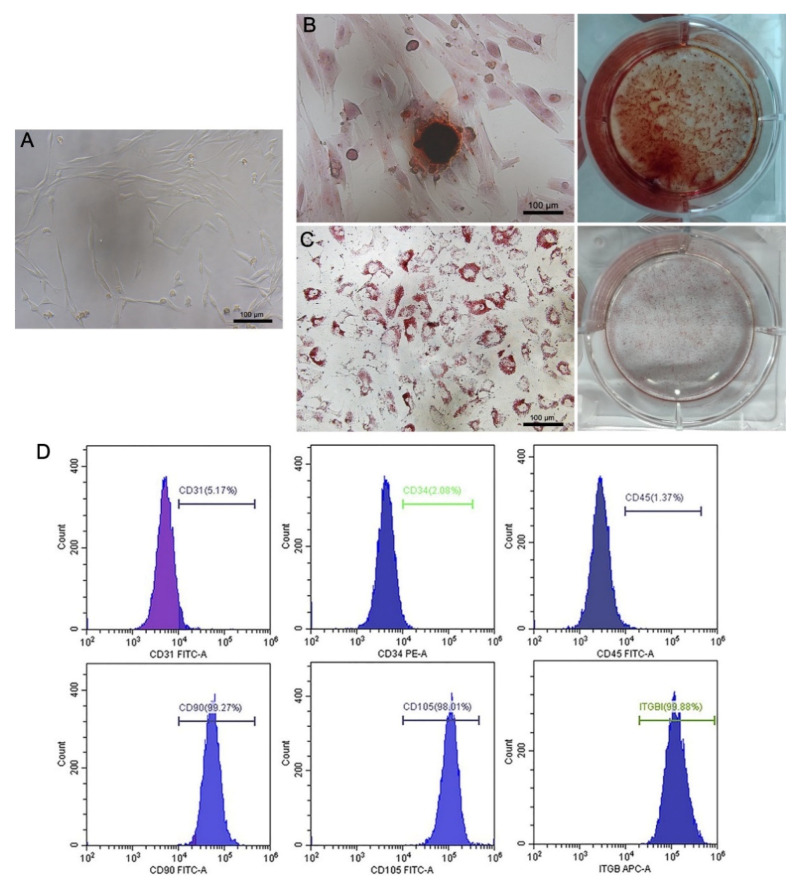
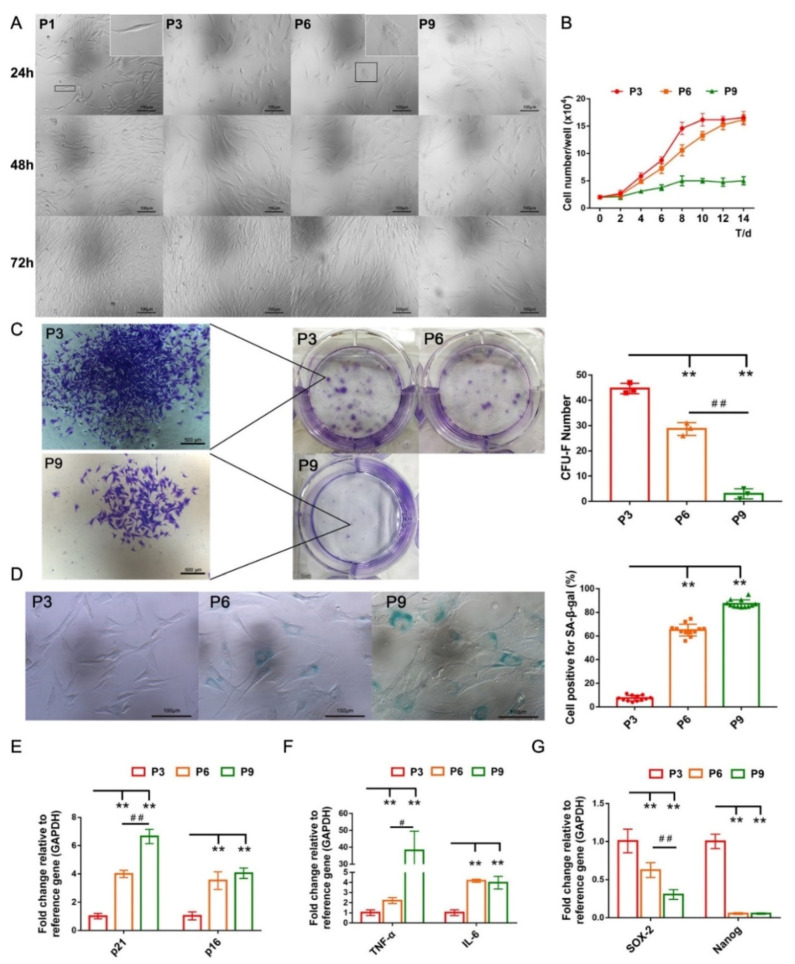
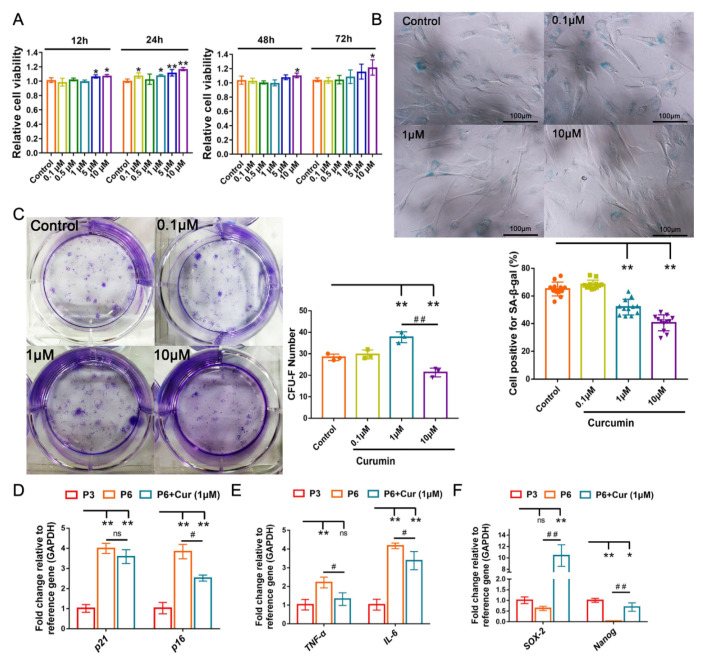
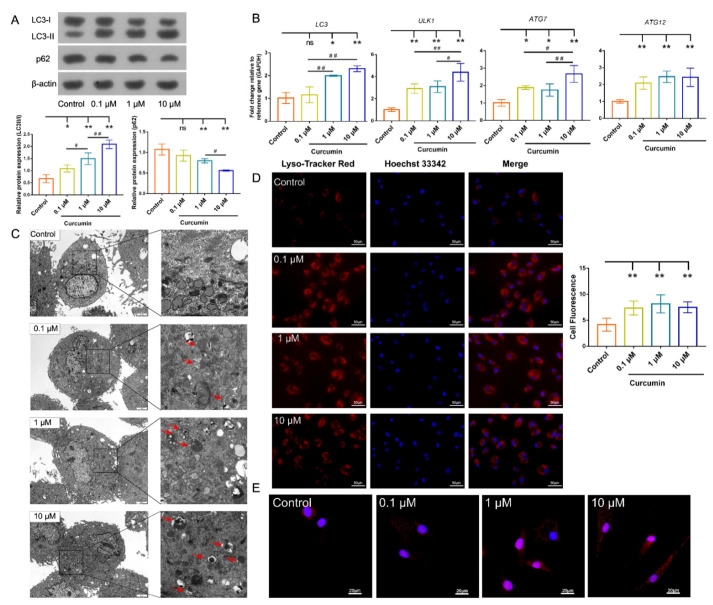
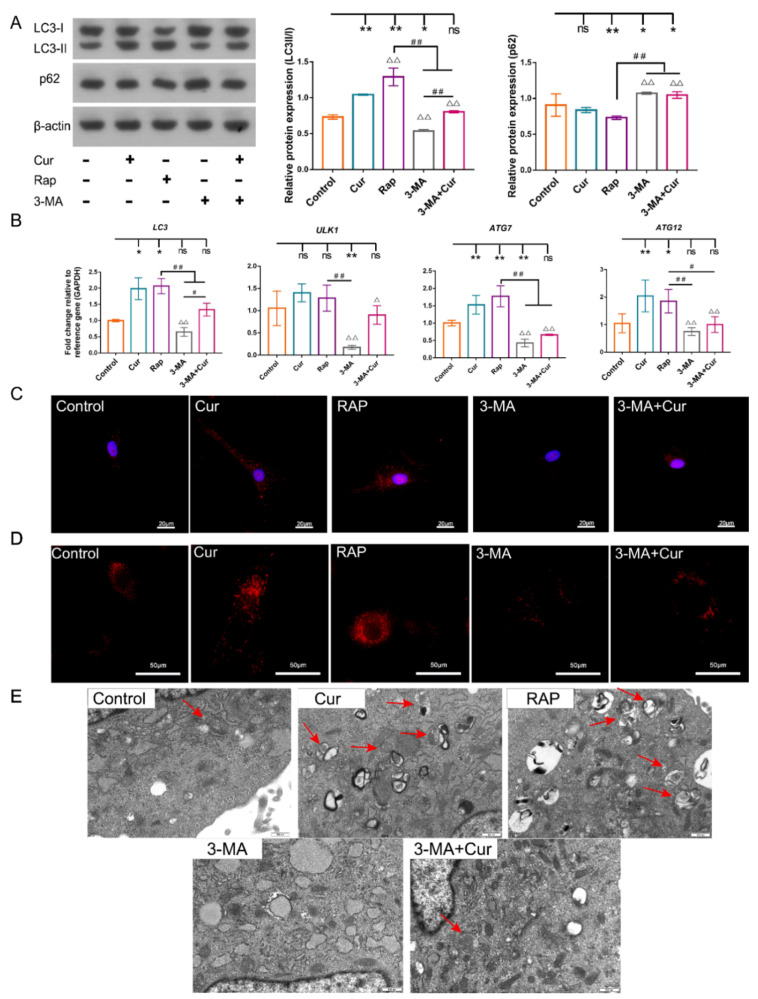
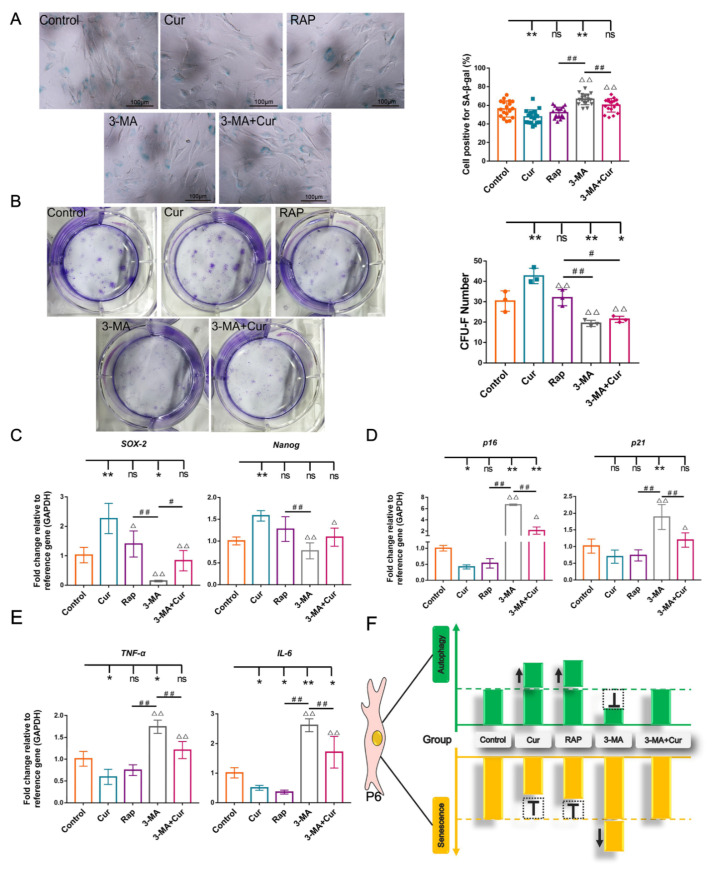
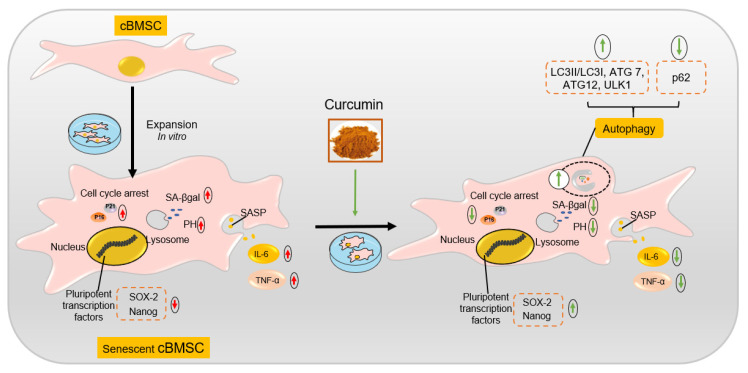
Senescence in mesenchymal stem cells (MSCs) not only hinders the application of MSCs in regenerative medicine but is also closely correlated with biological aging and the development of degenerative diseases. In this study, we investigated the anti-aging effects of curcumin (Cur) on canine bone marrow-derived MSCs (cBMSCs), and further elucidated the potential mechanism of action based on the modulation of autophagy. cBMSCs were expanded in vitro with standard procedures to construct a cell model of premature senescence. Our evidence indicates that compared with the third passage of cBMSCs, many typical senescence-associated phenotypes were observed in the sixth passage of cBMSCs. Cur treatment can improve cBMSC survival and retard cBMSC senescence according to observations that Cur (1 μM) treatment can improve the colony-forming unit-fibroblasts (CFU-Fs) efficiency and upregulated the mRNA expression of pluripotent transcription factors (SOX-2 and Nanog), as well as inhibiting the senescence-associated beta-galactosidase (SA-β-gal) activities and mRNA expression of the senescence-related markers (p16 and p21) and pro-inflammatory molecules (tumor necrosis factor-α (TNF-α) and interleukin-6 (IL-6)). Furthermore, Cur (0.1 μM~10 μM) was observed to increase autophagic activity, as identified by upregulation of microtubule-associated protein 1 light chain 3 (LC3), unc51-like autophagy-activating kinase-1 (ULK1), autophagy-related gene (Atg) 7 and Atg12, and the generation of type II of light chain 3 (LC3-II), thereby increasing autophagic vacuoles and acidic vesicular organelles, as well as causing a significant decrease in the p62 protein level. Moreover, the autophagy activator rapamycin (RAP) and Cur were found to partially ameliorate the senescent features of cBMSCs, while the autophagy inhibitor 3-methyladenine (3-MA) was shown to aggravate cBMSCs senescence and Cur treatment was able to restore the suppressed autophagy and counteract 3-MA-induced cBMSC senescence. Hence, our study highlights the important role of Cur-induced autophagy and its effects for ameliorating cBMSC senescence and provides new insight for delaying senescence and improving the therapeutic potential of MSCs.
Keywords: autophagy; canine bone marrow-derived mesenchymal stem cells; curcumin; senescence.
Conflict of interest statement
All the authors declared no conflict of interest.
Figures
Similar articles
-
Curcumin liposomes alleviate senescence of bone marrow mesenchymal stem cells by activating mitophagy.Sci Rep. 2024 Dec 28;14(1):31291. doi: 10.1038/s41598-024-82614-1. Sci Rep. 2024. PMID: 39732809 Free PMC article.
-
Kynurenine inhibits autophagy and promotes senescence in aged bone marrow mesenchymal stem cells through the aryl hydrocarbon receptor pathway.Exp Gerontol. 2020 Feb;130:110805. doi: 10.1016/j.exger.2019.110805. Epub 2019 Dec 5. Exp Gerontol. 2020. PMID: 31812582 Free PMC article.
-
Restoration of Autophagic Flux Rescues Oxidative Damage and Mitochondrial Dysfunction to Protect against Intervertebral Disc Degeneration.Oxid Med Cell Longev. 2019 Dec 30;2019:7810320. doi: 10.1155/2019/7810320. eCollection 2019. Oxid Med Cell Longev. 2019. PMID: 31976028 Free PMC article.
-
Autophagy: a potential key contributor to the therapeutic action of mesenchymal stem cells.Autophagy. 2020 Jan;16(1):28-37. doi: 10.1080/15548627.2019.1630223. Epub 2019 Jun 18. Autophagy. 2020. PMID: 31185790 Free PMC article. Review.
-
Rejuvenation of Mesenchymal Stem Cells to Ameliorate Skeletal Aging.Cells. 2023 Mar 24;12(7):998. doi: 10.3390/cells12070998. Cells. 2023. PMID: 37048071 Free PMC article. Review.
Cited by
-
Ginsenoside Rg2 Promotes the Proliferation and Stemness Maintenance of Porcine Mesenchymal Stem Cells through Autophagy Induction.Foods. 2023 Mar 2;12(5):1075. doi: 10.3390/foods12051075. Foods. 2023. PMID: 36900592 Free PMC article.
-
Interferon-γ enhances the immunosuppressive ability of canine bone marrow-derived mesenchymal stem cells by activating the TLR3-dependent IDO/kynurenine pathway.Mol Biol Rep. 2022 Sep;49(9):8337-8347. doi: 10.1007/s11033-022-07648-y. Epub 2022 Jun 12. Mol Biol Rep. 2022. PMID: 35690960
-
The Impact of Obesity on Autophagy in Human Adipose-Derived Mesenchymal Stromal Cells.Cell Transplant. 2025 Jan-Dec;34:9636897251323339. doi: 10.1177/09636897251323339. Epub 2025 Mar 21. Cell Transplant. 2025. PMID: 40116436 Free PMC article.
-
Application of autophagy in mesenchymal stem cells.World J Stem Cells. 2024 Dec 26;16(12):990-1001. doi: 10.4252/wjsc.v16.i12.990. World J Stem Cells. 2024. PMID: 39734481 Free PMC article.
-
Cellular microenvironment: a key for tuning mesenchymal stem cell senescence.Front Cell Dev Biol. 2023 Dec 4;11:1323678. doi: 10.3389/fcell.2023.1323678. eCollection 2023. Front Cell Dev Biol. 2023. PMID: 38111850 Free PMC article. Review.
References
-
- Zhan X.S., El-Ashram S., Luo D.Z., Luo H.N., Wang B.Y., Chen S.F., Bai Y.S., Chen Z.S., Liu C.Y., Ji H.Q. A Comparative Study of Biological Characteristics and Transcriptome Profiles of Mesenchymal Stem Cells from Different Canine Tissues. Int. J. Mol. Sci. 2019;20:1485. doi: 10.3390/ijms20061485. - DOI - PMC - PubMed
-
- Liu X., Kumagai G., Wada K., Tanaka T., Asari T., Oishi K., Fujita T., Mizukami H., Furukawa K.I., Ishibashi Y. High Osteogenic Potential of Adipose- and Muscle-derived Mesenchymal Stem Cells in Spinal-Ossification Model Mice. Spine. 2017;42:E1342–E1349. doi: 10.1097/BRS.0000000000002266. - DOI - PMC - PubMed
MeSH terms
Substances
LinkOut - more resources
Full Text Sources
Research Materials
Miscellaneous
