. 2021 Oct 22;22(21):11409.
doi: 10.3390/ijms222111409.

Saikosaponin A and D Inhibit Adipogenesis via the AMPK and MAPK Signaling Pathways in 3T3-L1 Adipocytes

Affiliations

Saikosaponin A and D Inhibit Adipogenesis via the AMPK and MAPK Signaling Pathways in 3T3-L1 Adipocytes

Sung Ho Lim et al. Int J Mol Sci. .

Abstract

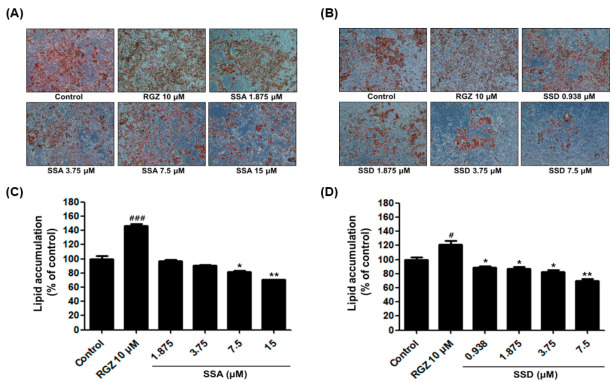
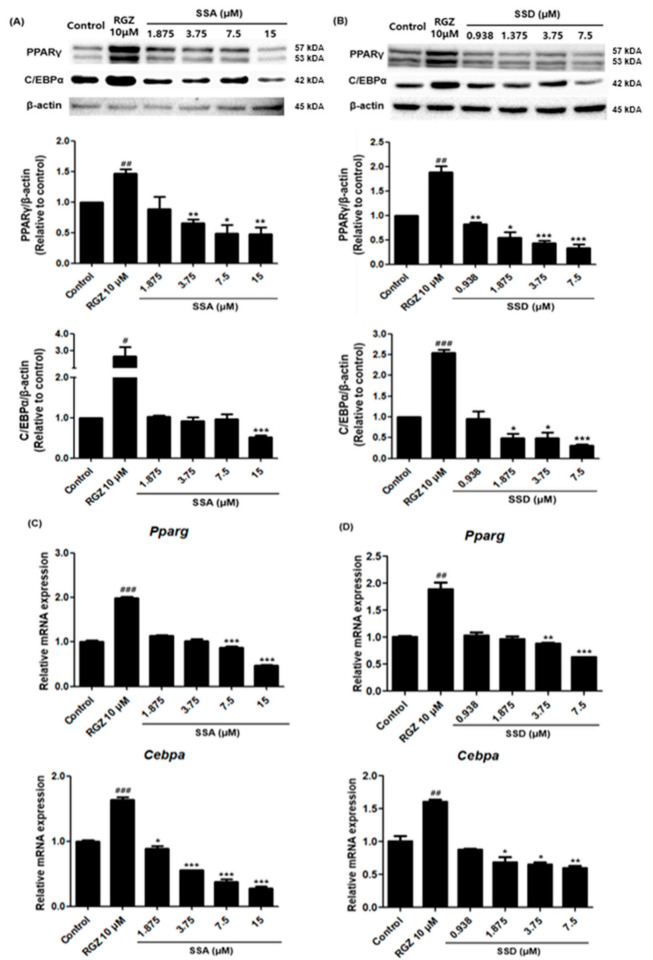
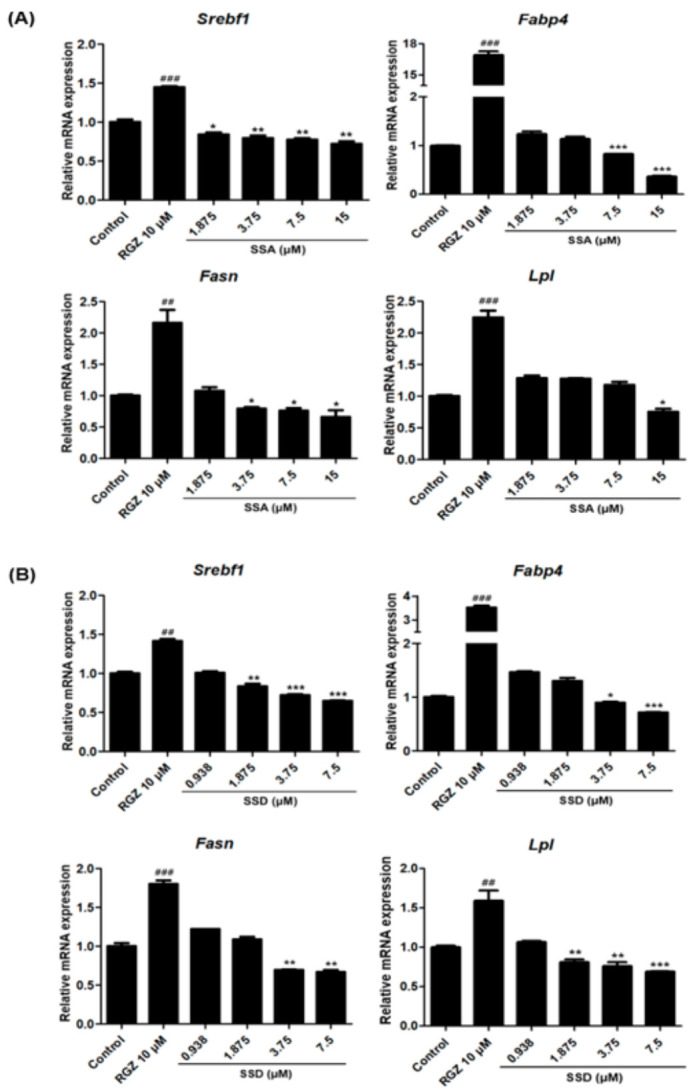
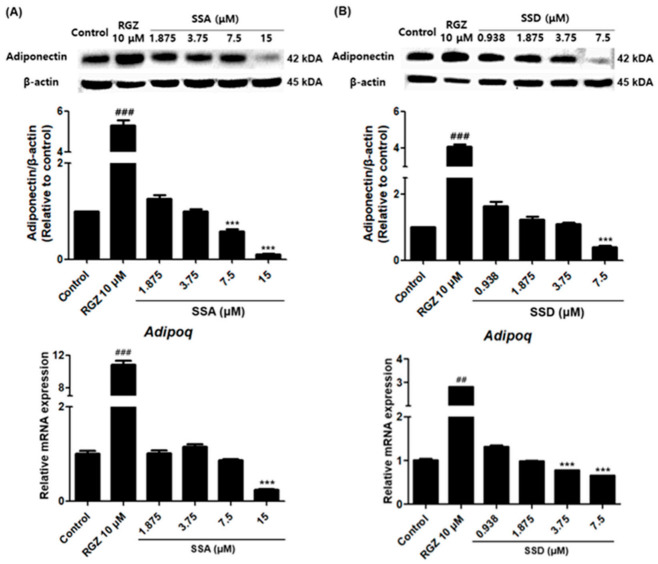
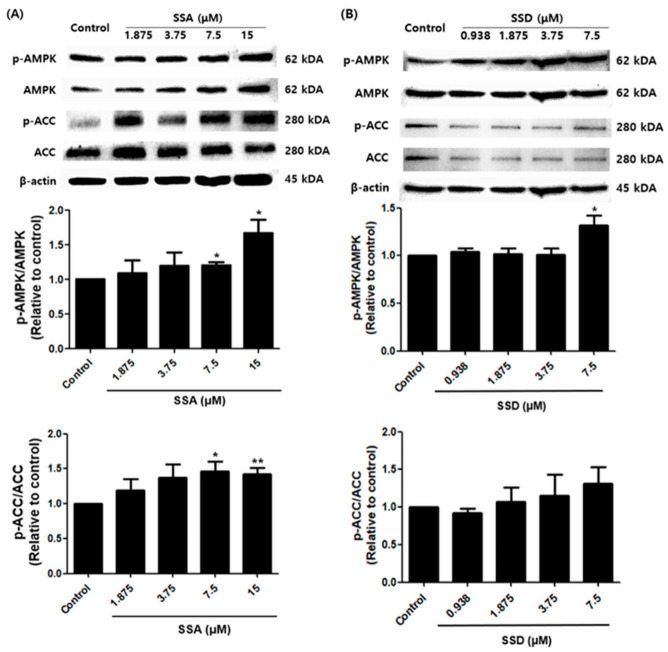
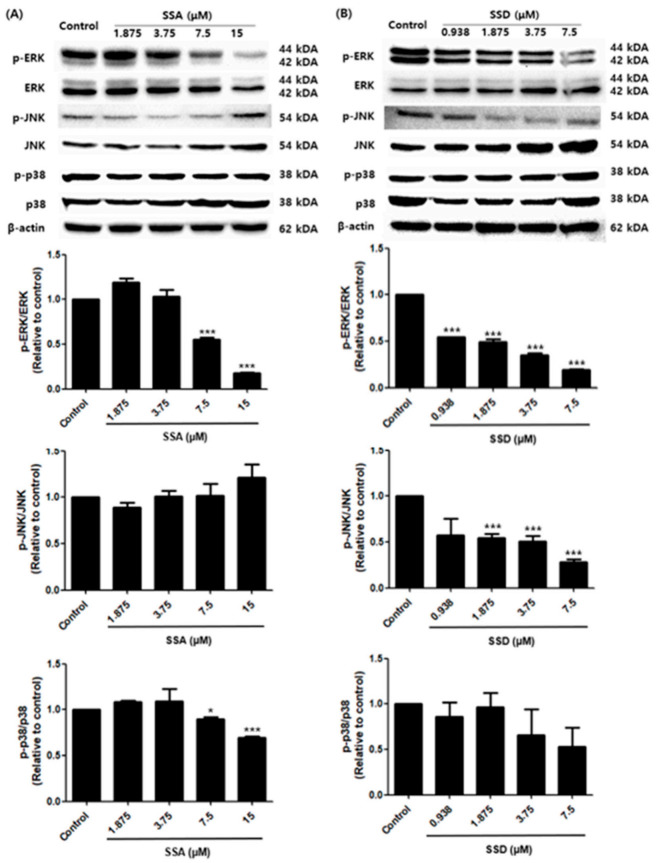
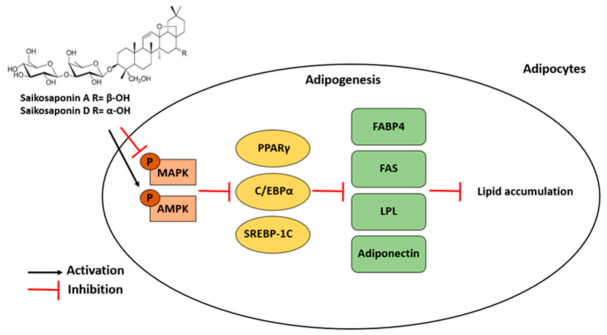
Obesity is a lipid metabolism disorder caused by genetic, medicinal, nutritional, and other environmental factors. It is characterized by a complex condition of excess lipid accumulation in adipocytes. Adipogenesis is a differentiation process that converts preadipocytes into mature adipocytes and contributes to excessive fat deposition. Saikosaponin A (SSA) and saikosaponin D (SSD) are triterpenoid saponins separated from the root of the Bupleurum chinensis, which has long been used to treat inflammation, fever, and liver diseases. However, the effects of these constituents on lipid accumulation and obesity are poorly understood. We investigated the anti-obesity effects of SSA and SSD in mouse 3T3-L1 adipocytes. The MTT assay was performed to measure cell viability, and Oil Red O staining was conducted to determine lipid accumulation. Various adipogenic transcription factors were evaluated at the protein and mRNA levels by Western blot assay and quantitative reverse transcription polymerase chain reaction (qRT-PCR). Here, we showed that SSA and SSD significantly inhibited lipid accumulation without affecting cell viability within the range of the tested concentrations (0.938-15 µM). SSA and SSD also dose-dependently suppressed the expression of peroxisome proliferator-activated receptor gamma (PPARγ), CCAAT/enhancer binding protein alpha (C/EBPα), sterol regulatory element binding protein-1c (SREBP-1c), and adiponectin. Furthermore, the decrease of these transcriptional factors resulted in the repressed expression of several lipogenic genes including fatty acid binding protein (FABP4), fatty acid synthase (FAS), and lipoprotein lipase (LPL). In addition, SSA and SSD enhanced the phosphorylation of adenosine monophosphate-activated protein kinase (AMPK) and its substrate, acetyl-CoA carboxylase (ACC), and inhibited the phosphorylation of extracellular-regulated kinase 1/2 (ERK1/2) and p38, but not c-Jun-N-terminal kinase (JNK). These results suggest that SSA and SSD inhibit adipogenesis through the AMPK or mitogen-activated protein kinase (MAPK) pathways in the early stages of adipocyte differentiation. This is the first study on the anti-adipogenic effects of SSA and SSD, and further research in animals and humans is necessary to confirm the potential of saikosaponins as therapeutic agents for obesity.

Keywords: 3T3-L1 cells; AMPK pathway; MAPK pathway; adipogenesis; saikosaponin.


Conflict of interest statement

The authors declare no conflict of interest.

Figures

Figure 1
Figure 1
Effect of saikosaponin A (SSA, A) and saikosaponin D (SSD, B) treatment on cell viability in 3T3-L1 cells for 48 h. The cell viability was assessed by MTT assay. Data are expressed as a percentage of control (0.5% DMSO) value of triplicate experiments.
Figure 2
Figure 2
Effect of SSA and SSD on lipid accumulation in 3T3-L1 cells. (A,B) Representative cell images were captured at 100 × magnification. (C,D) The lipid droplets were stained Oil Red O solution and extracted using isopropanol. Then, they were quantified using a microplate reader at the wavelength of 520 nm. Data are presented as a percentage of control (0.5% DMSO) and RGZ (rosiglitazone) was used as a positive control for this experiment. Results are mean ± standard error of the mean (SEM, n = 3); * p < 0.05, ** p < 0.01, # p < 0.05, ### p < 0.001, compared with control. #: increased compared to control, *: decreased compared to control.
Figure 3
Figure 3
Effect of SSA and SSD on the protein and mRNA expression levels of PPARγ and C/EBPα in 3T3-L1 cells. Cells were seeded in a 6-well plate and stimulated to differentiate with DIM, DPM and PDM in the presence or absence of SSA and SSD (0.938, 1.875, 3.75, 7.5 and 15 µM) for 8 days. (A,B) The protein levels of PPARγ and C/EBPα were analyzed using Western blot with specific antibodies. (C,D) Relative mRNA expression levels of Pparg and Cebpa were measured by quantitative real-time PCR. Results are shown as a relative of control (0.5% DMSO) values and RGZ (rosiglitazone) was used as a positive control for these experiments. The β-actin was used as a loading control and the Gapdh was used as a house keeping gene. Target gene mRNA levels were normalized to Gapdh using the 2-ΔΔ Ct method. Data are mean ± standard error of the mean (SEM) of three independent experiments. * p < 0.05, ** p < 0.01, *** p < 0.001, # p< 0.05, ## p < 0.01, ### p < 0.001 compared with control, #: increased compared to control, *: decreased compared to control.
Figure 4
Figure 4
Effect of SSA (A) and SSD (B) on the mRNA expression levels of adipogenic transcriptional factors in 3T3-L1 cells as measured by quantitative PCR. Results are shown as relative of control (0.5% DMSO) values and RGZ (rosiglitazone) was used as a positive control for this experiment. Gapdh was used as a house keeping gene. Target gene mRNA levels were normalized to Gapdh using the 2-ΔΔ Ct method. Results are mean ± standard error of the mean (SEM) of three independent experiments. * p < 0.05, ** p < 0.01, *** p < 0.001, ## p < 0.01, ### p < 0.001, compared with control, #: increased compared to control, *: decreased compared to control.
Figure 5
Figure 5
Effect of SSA (A) and SSD (B) on the expression protein and mRNA levels of adiponectin in 3T3-L1 cells as measured by Western blot and quantitative real-time PCR, respectively. Results are shown as a relative of control (0.5% DMSO) values and RGZ (rosiglitazone) was used as a positive control for this experiment. β-actin was used as a loading control and Gapdh was used as a house keeping gene. Target gene mRNA levels were normalized to Gapdh using the 2-ΔΔ Ct method. Data are mean ± standard error of the mean (SEM) of three independent experiments. Results are mean ± standard error of the mean (SEM) of triplicate experiments. *** p < 0.001, ## p < 0.01, ### p < 0.001, compared with control, #: increased compared to control, *: decreased compared to control.
Figure 6
Figure 6
Effect of SSA (A) and SSD (B) on adipogenesis is mediated by AMPK signaling pathway as examined by Western blot analysis. The graphs show the band intensity ratio of the phosphorylated form by the total protein expression of AMPK and ACC. Results are shown as a relative of control (0.5% DMSO) values for this experiment. β-actin was used as a loading control. Data are mean ± standard error of the mean (SEM) of three independent experiments. * p < 0.05, ** p < 0.01, compared with control, *: increased compared to control.
Figure 7
Figure 7
Effect of SSA (A) and SSD (B) on adipogenesis is mediated by MAPK signaling pathway as examined by Western blot analysis. The relative intensity of each band of the phosphorylated ERK, JNK, and p38 after normalization for the levels in the total forms is shown, and β-actin was used as a loading control. Results are shown as a relative of control (0.5% DMSO) values for this experiment. Data are mean ± standard error of the mean (SEM) of three independent experiments. * p < 0.05, *** p < 0.001, compared with control, *: decreased compared to control.
Figure 8
Figure 8
3T3-L1 cell differentiation processes.
Figure 9
Figure 9
Suggested molecular mechanism for anti-adipogenic effect of saikosaponin A (SSA) and saikosaponin D (SSD) in 3T3-L1 adipocytes. Black arrows indicate activation and red arrows refer to inhibition.

References

    1. Carneiro I.P., Elliott S.A., Siervo M., Padwal R., Bertoli S., Battezzati A., Prado C.M. Is Obesity Associated with Altered Energy Expenditure? Adv. Nutr. 2016;7:476–487. doi: 10.3945/an.115.008755. - DOI - PMC - PubMed
    1. Unger R.H., Zhou Y.T. Lipotoxicity of Beta-Cells in Obesity and in Other Causes of Fatty Acid Spillover. Diabetes. 2001;50:S118–S121. doi: 10.2337/diabetes.50.2007.S118. - DOI - PubMed
    1. Guh D.P., Zhang W., Bansback N., Amarsi Z., Birmingham C.L., Anis A.H. The Incidence of Co-Morbidities Related to Obesity and Overweight: A Systematic Review and Meta-Analysis. BMC Public Health. 2009;9:88. doi: 10.1186/1471-2458-9-88. - DOI - PMC - PubMed
    1. Ambele M.A., Dhanraj P., Giles R., Pepper M.S. Adipogenesis: A Complex Interplay of Multiple Molecular Determinants and Pathways. Int. J. Mol. Sci. 2020;21:4283. doi: 10.3390/ijms21124283. - DOI - PMC - PubMed
    1. Avena N.M., Gold J., Kroll C., Gold M.S. Further Developments in the Neurobiology of Food and Addiction: Update on the State of the Science. Nutrition. 2012;28:341–343. doi: 10.1016/j.nut.2011.11.002. - DOI - PMC - PubMed

MeSH terms