. 2021 Oct 26;22(21):11554.
doi: 10.3390/ijms222111554.

Not All Lectins Are Equally Suitable for Labeling Rodent Vasculature

Affiliations

Not All Lectins Are Equally Suitable for Labeling Rodent Vasculature

Roberta Battistella et al. Int J Mol Sci. .

Abstract

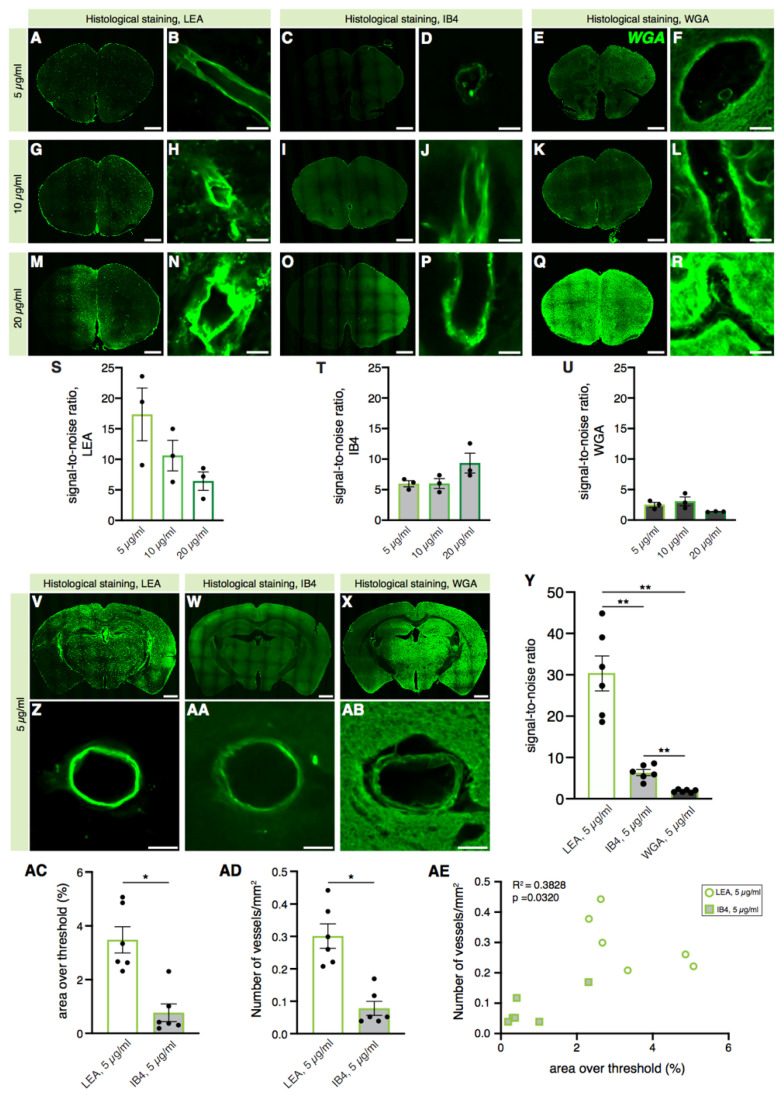
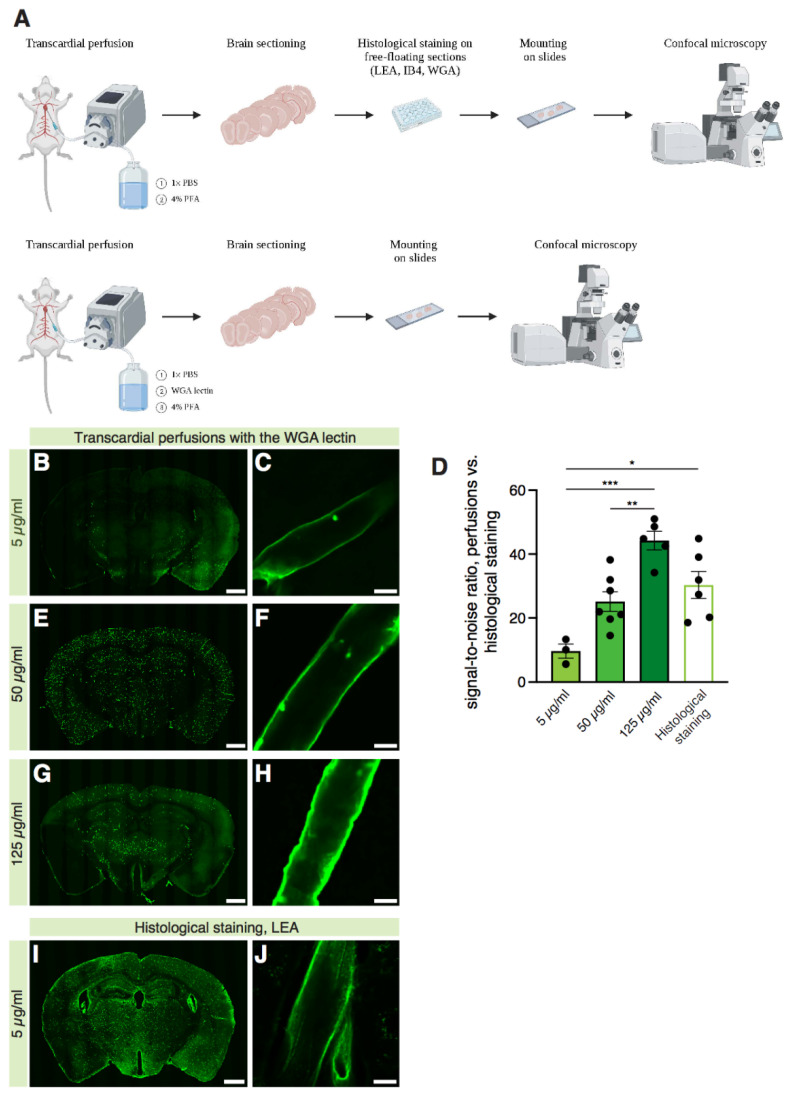
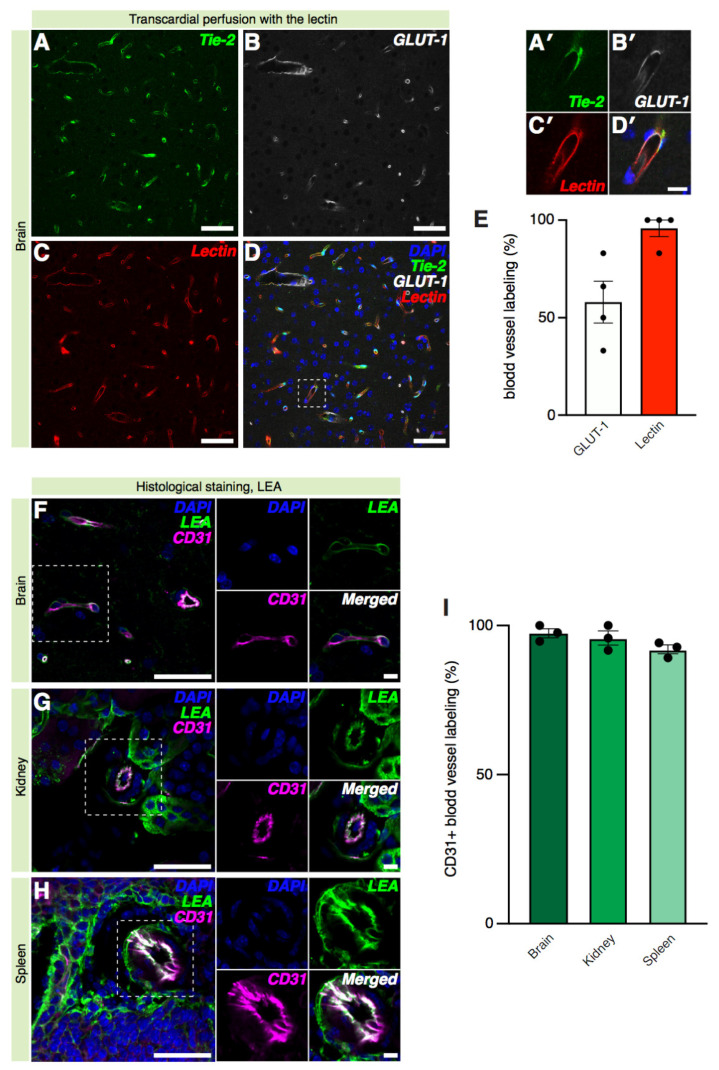
The vascular system is vital for all tissues and the interest in its visualization spans many fields. A number of different plant-derived lectins are used for detection of vasculature; however, studies performing direct comparison of the labeling efficacy of different lectins and techniques are lacking. In this study, we compared the labeling efficacy of three lectins: Griffonia simplicifolia isolectin B4 (IB4); wheat germ agglutinin (WGA), and Lycopersicon esculentum agglutinin (LEA). The LEA lectin was identified as being far superior to the IB4 and WGA lectins in histological labeling of blood vessels in brain sections. A similar signal-to-noise ratio was achieved with high concentrations of the WGA lectin injected during intracardial perfusion. Lectins were also suitable for labeling vasculature in other tissues, including spinal cord, dura mater, heart, skeletal muscle, kidney, and liver tissues. In uninjured tissues, the LEA lectin was as accurate as the Tie2-eGFP reporter mice and GLUT-1 immunohistochemistry for labeling the cerebral vasculature, validating its specificity and sensitivity. However, in pathological situations, e.g., in stroke, the sensitivity of the LEA lectin decreases dramatically, limiting its applicability in such studies. This work can be used for selecting the type of lectin and labeling method for various tissues.

Keywords: angiogenesis; blood vessels; lectin angiography; lectins; stroke; vascular research.


Conflict of interest statement

The authors declare no conflict of interest.

Figures

Figure 1
Figure 1
Labeling of blood vessels in free-floating brain sections by lectins Lycopersicon esculentum agglutinin (LEA), Griffonia simplicifolia isolectin B4 (IB4), and wheat germ agglutinin (WGA). (AR) Representative confocal images of mouse brain sections histologically stained with the LEA, IB4, and WGA lectins at different concentrations. (SU) Quantification of the signal-to-noise ratio. Each datapoint represents a single vessel; n = 1. (VAB) Representative confocal images of (i) 10× mouse brain sections histologically stained with the LEA, IB4, and WGA lectin solutions at a concentration of 5 µg/mL (V,W,X) and (ii) high magnification (20×) of the blood vessels (Z,AA,AB) used for the quantification of the signal-to-noise ratio in (Y). Three vessels analyzed per animal, n = 6 mice (repeated measures one-way ANOVA, p = 0.0010; Tukey’s multiple comparisons test: WGA vs. IB4, p = 0.0039; WGA vs. LEA, p = 0.0025; IB4 vs. LEA, p = 0.0034). ** = p < 0.01. (ACAD) Quantification of the area over the threshold (%) (AC) and of the number of vessels/mm2 (AD) labeled by the IB4 and LEA lectins in brain sections. Each datapoint represents the averaged values in one single animal; n = 6 mice. (AC: Wilcoxon test, p = 0.0312; AD: Wilcoxon test, p = 0.0312). * = p < 0.05. (AE) Graph showing the existing correlation between the percentage of the area over the threshold and the number of vessels/mm2 labeled with the IB4 and LEA lectins in brain sections. Each datapoint represents the averaged values in one single animal; n = 6 mice (correlation, Pearson coefficient: R2 = 0.3828, p = 0.0320). Scale bars: 1000 µm for low-magnification images, 10 µm for high-magnification images.
Figure 2
Figure 2
Comparison of different methods to labeling brain vessels with lectins: intravascular WGA delivery during terminal perfusion vs. LEA histological staining on free-floating sections. (A) Schematic drawing summarizing the setup for the experiments comparing the two methods. Created with BioRender. (BJ) Representative 10× confocal images of brain sections of the mice intracardially perfused with the WGA lectin at a concentration of 5 µg/mL (B), 50 µg/mL (E), and 125 µg/mL (G) compared to the ones histologically stained with the LEA lectin (I) and (D) quantification of the signal-to-noise ratio of the vessels stained with different methods (representative confocal 20×-magnified images in C,F,H,J). Three vessels analyzed per animal; n = 3 mice for the 5 µg/mL group, n = 7 mice for the 50 µg/mL group, n = 5 mice for the 125 µg/mL group, n = 6 mice for the LEA histological staining group (one-way ANOVA test, p = 0.0002; Tukey’s multiple comparisons test: 5 µg/mL WGA vs. 125 µg/mL WGA, p = 0.0001; 5 µg/mL WGA vs. LEA, p = 0.0112; 50 µg/mL WGA vs. 125 µg/mL WGA, p = 0.0047). * = p < 0.05; ** = p < 0.01; *** = p < 0.001. Scale bars: 1000 µm for low-magnification images, 10 µm for high-magnification images.
Figure 3
Figure 3
Comparison of different methods of labeling blood vessels in various organs with lectins: WGA intravascular delivery during terminal perfusion vs. LEA histological staining on free-floating sections. (AX) Representative images of the whole-mount dura mater meninx, skeletal muscle, kidney, spinal cord, heart, and liver tissues of the mice intracardially perfused with the WGA lectin (concentration: 50 µg/mL) compared with those histologically stained with the LEA lectin. White squares indicate the point where the high magnification images of the blood vessels used for the quantification were acquired from. Scale bars: 1000 µm for low magnification images, 10 µm for high magnification images. (YAD) Quantification of the signal-to-noise ratio values of the two methods in different organs (dura mater: Welch’s t-test, p = 0.3955; skeletal muscle: Mann–Whitney U test, p = 0.2286; Kidney: Welch’s t-test, p = 0.7319; spinal cord: unpaired t-test, p = 0.2778; heart: unpaired t-test, p = 0.5096; liver: unpaired t-test, p = 0.0272); n = 3 to 4 mice for the 50 µg/mL WGA perfusion group and n = 4 mice for the LEA histological staining group. * = p < 0.05.
Figure 4
Figure 4
Comparison of lectin labeling of blood vessels in different types of the endothelium with the commonly used blood vessel markers. (AD) Representative 20× confocal images of a brain section from a Tie2–eGFP reporter mouse intracardially perfused with the biotinylated lectin and processed with Cy3-conjugated streptavidin and GLUT-1 antibodies. Scale bars: 50 µm. The white dashed square marks the magnified inset in (A′–D′). Scale bars: 10 µm. (E) Quantification of blood vessels labeled (%) by GLUT-1 and lectin staining; n = 4 mice (Wilcoxon test, p = 0.2500). (FH) Representative 20× confocal images of the brain, kidney, and spleen sections labeled with the CD31 endothelial marker. Scale bars: 50 µm. White dashed squares mark the magnified insets on the right. Scale bars: 10 µm. (I) Quantification of CD31+ blood vessels (%) in the brain, kidney, and spleen tissues that are co-labeled with LEA; n = 3 mice (one-Way ANOVA, p = 0.1894).
Figure 5
Figure 5
Analysis of the LEA lectin´s labeling of blood vessels in the ischemic core of a post-stroke brain. (A) Representative micrograph of the infarcted area (dashed line) in the brain sections of mice 1 and 7 days after transient occlusion of the medial cerebral artery labeled with Nissl staining. Note the infarcted region that appears white. (B) Quantification of the infarct size in mice 1 and 7 days post-tMCAo (unpaired t-test, p = 0.0522); n = 5 mice/group. (C) Neuroscore values in mice 1 day post-tMCAo; n = 5 mice. (D) Neuroscore in mice 7 days post-tMCAo; n = 5 mice. (EM) Representative confocal images of brain sections at 10× magnification (EG; scale bars: 1 mm) and related blood vessels at 20× magnification (HM; scale bars: 20 µm) of the naïve, 1d tMCAo, and 7d tMCAo mice labeled with the LEA lectin and the GLUT-1 antibody (counterstain: DAPI). (N) Quantification of the LEA lectin specificity (two-way ANOVA test, hemisphere effect, p = 0.0025; Tukey’s multiple comparisons test for the infarcted hemisphere: naïve vs. 1d tMCAo, p = 0.4239; naïve vs. 7d tMCAo, p = 0.0112; 1d tMCAo vs. 7d tMCAo, p = 0.1619; for the intact hemisphere: naïve vs. 1d tMCAo, p = 0.5030; naïve vs. 7d tMCAo, p = 0.9451; 1d tMCAo vs. 7d tMCAo, p = 0.6983; Sidak’s multiple comparisons test, infarcted vs. intact hemispheres: naïve, p = 0.6566; 1d tMCAo, p = 0.5601; 7d tMCAo, p = 0.0034); n = 5 mice/group. * = p < 0.05; ** = p < 0.01. (OQ) Representative confocal images of the LEA lectin and Iba1 signal overlapping in the infarcted hemisphere of the 1d tMCAo and 7d tMCAo mice compared to the naïve mice. Scale bars: 20 µm.

References

    1. Aird W.C. Discovery of the cardiovascular system: From Galen to William Harvey. J. Thromb. Haemost. 2011;9:118–129. doi: 10.1111/j.1538-7836.2011.04312.x. - DOI - PubMed
    1. Risau W. Mechanisms of angiogenesis. Nature. 1997;386:671–674. doi: 10.1038/386671a0. - DOI - PubMed
    1. Brown W.R., Thore C.R. Review: Cerebral microvascular pathology in ageing and neurodegeneration. Neuropathol. Appl. Neurobiol. 2011;37:56–74. doi: 10.1111/j.1365-2990.2010.01139.x. - DOI - PMC - PubMed
    1. Boero J.A., Ascher J., Arregui A., Rovainen C., Woolsey T.A. Increased brain capillaries in chronic hypoxia. J. Appl. Physiol. 1999;86:1211–1219. doi: 10.1152/jappl.1999.86.4.1211. - DOI - PubMed
    1. He Q.W., Li Q., Jin H.J., Zhi F., Suraj B., Zhu Y.Y., Xia Y.P., Mao L., Chen X.L., Hu B. MiR-150 Regulates Poststroke Cerebral Angiogenesis via Vascular Endothelial Growth Factor in Rats. CNS Neurosci. Ther. 2016;22:507–517. doi: 10.1111/cns.12525. - DOI - PMC - PubMed

LinkOut - more resources