. 2021 Oct 27;22(21):11604.
doi: 10.3390/ijms222111604.

Transcriptome Profiling of Cu Stressed Petunia Petals Reveals Candidate Genes Involved in Fe and Cu Crosstalk

Affiliations

Transcriptome Profiling of Cu Stressed Petunia Petals Reveals Candidate Genes Involved in Fe and Cu Crosstalk

Jinglei Wu et al. Int J Mol Sci. .

Abstract

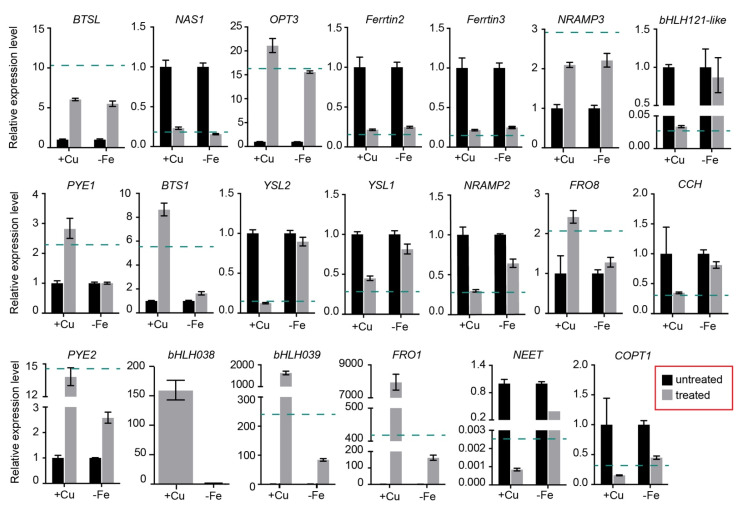
Copper (Cu) is an essential element for most living plants, but it is toxic for plants when present in excess. To better understand the response mechanism under excess Cu in plants, especially in flowers, transcriptome sequencing on petunia buds and opened flowers under excess Cu was performed. Interestingly, the transcript level of FIT-independent Fe deficiency response genes was significantly affected in Cu stressed petals, probably regulated by basic-helix-loop-helix 121 (bHLH121), while no difference was found in Fe content. Notably, the expression level of bHLH121 was significantly down-regulated in petals under excess Cu. In addition, the expression level of genes related to photosystem II (PSII), photosystem I (PSI), cytochrome b6/f complex, the light-harvesting chlorophyll II complex and electron carriers showed disordered expression profiles in petals under excess Cu, thus photosynthesis parameters, including the maximum PSII efficiency (FV/FM), nonphotochemical quenching (NPQ), quantum yield of the PSII (ΦPS(II)) and photochemical quenching coefficient (qP), were reduced in Cu stressed petals. Moreover, the chlorophyll a content was significantly reduced, while the chlorophyll b content was not affected, probably caused by the increased expression of chlorophyllide a oxygenase (CAO). Together, we provide new insight into excess Cu response and the Cu-Fe crosstalk in flowers.

Keywords: Fe deficiency response; RNA-seq; excess Cu; petal; petunia; photosynthesis.


Conflict of interest statement

The authors declare no conflict of interest.

Figures

Figure 1
Figure 1
Dry weight and element concentrations in stage 4 and stage 7 petunia petals in plants that were unexposed (Control), or exposed to 40 μM Cu (+Cu). (a) Dry weight of stage 4 and stage 7 petal upon exposure to excess Cu. Bars are mean ± SD (n = 6). (b) Cu, (c) Fe, (d) Zn and (e) Mn content in petunia petals under excess Cu. Bars represent mean ± SD (n = 4 × 3 petals). * indicates significant differences by Tukey’s HSD test (p < 0.05).
Figure 2
Figure 2
Differentially expressed genes (DEGs) in stage 4 and stage 7 petals after exposure to 40 μM Cu. (a) Venn diagram showing the number of DEGs, fold change > 2 and FDR < 0.05, in stage 4 and stage 7 petals. (b) Heatmap showing the log2-fold change of DEGs shared by stage 4 and stage 7 petals.
Figure 3
Figure 3
KEGG and Gene ontology (GO) enrichment analysis of transcripts significantly differently expressed in stage 4 and stage 7 petunia petal after exposure to excess Cu. (a) Enriched KEGG pathway in petunia petal upon excess Cu exposure by using p-value < 0.05 as a cut-off. (b) Enriched GO terms in molecular function ontology on level 3 to level 6 shared by stage 4 and stage 7 petal transcriptomes. Terms related to “oxidoreductase activity” and “metal cluster binding” are marked with colored backgrounds.
Figure 4
Figure 4
Expression pattern of genes relate to Cu transport and distribution in petunia petal under excess Cu. Blue box indicates down-regulated genes, whiter box indicates no significant difference after excess Cu treatment. FRO, ferric reductase oxidase; COPT, copper transporter; ZIP, zinc and iron regulated transporter proteins; HMA, heavy metal P-ATPase; CCH, copper chaperone; CCS, copper chaperone for superoxide dismutase; ATX1, antioxidant 1; PAA1, HMA6; PAA2, HMA8; ER, endoplasmic reticulum.
Figure 5
Figure 5
Schematic diagram of genes involved in Cu–Fe crosstalk in petunia petal: (a) expression profile of transcription factors involved in Fe homeostasis, (b) expression pattern of genes involved in Fe transport and distribution in petunia petals. bHLH, basic-helix-loop-helix; PYE, popeye; BTS, Brutus; BTSL, Brutus-like; NRAMP, Natural resistance-associated macrophage proteins; NAS, Nicotianamine synthases; FRO, ferric reductase oxidase; YSL, Yellow stripe-like proteins; OPT3, Oligopeptide transporter3; COPT1, copper transporter1.
Figure 6
Figure 6
Effects of excess Cu treatment on photosynthesis in petunia petals. (ad) Content of chlorophyll a (a), chlorophyll b (b), chlorophyll a+b (c) and chl a/b ratio (d) in stage 4 petunia petals. Bars are means ± SD (n = 5 petals). (e) Expression profiles of Fe–S metabolism related genes under the GO:0051536 item, which were enriched in stage 4 and stage 7 petals. (f) FV/FM, maximum potential PS II efficiency; (g) NPQ, non-photochemical quenching value; (h) ΦPS(II), actual PS II efficiency; and (i) qP, photochemical quenching value was measured in stage 4 petals under excess Cu. Bars are means ± SD (n = 6 petals). (j) CAT activity in petunia stage 4 petals upon Cu excess. Bars are mean ± SD (n = 3). * indicates significant differences (p < 0.05) using Tukey’s HSD test.
Figure 7
Figure 7
The relative expression level of genes involved in Fe and Cu homeostasis in petunia petals under Fe deficiency or excess Cu. Bars indicate the relative expression level determined by qRT-PCR in petunia petals exposed to 40 μM Cu (+Cu) or 0 μM Fe (-Fe). EF1α as the reference gene. Values (mean ± SD, n = 3) are normalized to the gene expression level in untreated petals (set as 1). Since bHLH038 was barely expressed in untreated petals (Cq value > 35), we used the relative expression value of -Fe as 1. The green dash line indicates the fold change value of genes in petunia stage 7 petal transcriptome.
Figure 8
Figure 8
Heatmap showing the expression profile of genes related to Fe homeostasis in petunia petals under Cu excess, petunia petals under Fe depletion, N. caerulescens shoots under Cd excess and Arabidopsis shoots under Fe deficiency. The value of petunia is log2 fold change of qRT-PCR. The log2 fold change of genes with fold change < 2 or FDR (p-value for Col) >0.05, all been marked as 0. * data was download from Halimaa et al. [42]. ** data was download from Schuler et al. [44]. *** data was download from Kastoori Ramamurthy et al. [21].

References

    1. Hirayama T., Kieber J.J., Hirayama N., Kogan M., Guzman P., Nourizadeh S., Alonso J.M., Dailey W.P., Dancis A., Ecker J.R. RESPONSIVE-TO-ANTAGONIST1, a Menkes/Wilson disease-related copper transporter, is required for ethylene signaling in Arabidopsis. Cell. 1999;97:383–393. doi: 10.1016/S0092-8674(00)80747-3. - DOI - PubMed
    1. Terry N., Low G. Leaf Chlorophyll Content and Its Relation to the Intracellular Localization of Iron. J. Plant Nutr. 1982;5:301–310. doi: 10.1080/01904168209362959. - DOI
    1. Shikanai T. PAA1, a P-Type ATPase of Arabidopsis, Functions in Copper Transport in Chloroplasts. Plant Cell. 2003;15:1333–1346. doi: 10.1105/tpc.011817. - DOI - PMC - PubMed
    1. Katoh S. A new copper protein from Chlorella ellisoidea. Nature. 1960;186:533–534. doi: 10.1038/186533a0. - DOI - PubMed
    1. Gorman D.S., Levine R.P. Cytochrome f and plastocyanin: Their sequence in the photosynthetic electron transport chain of Chlamydomonas reinhardi. Proc. Natl. Acad. Sci. USA. 1965;54:1665–1669. doi: 10.1073/pnas.54.6.1665. - DOI - PMC - PubMed

MeSH terms

LinkOut - more resources