. 2021 Oct 28;22(21):11642.
doi: 10.3390/ijms222111642.

Brainstem and Cortical Spreading Depolarization in a Closed Head Injury Rat Model

Affiliations

Brainstem and Cortical Spreading Depolarization in a Closed Head Injury Rat Model

Refat Aboghazleh et al. Int J Mol Sci. .

Abstract

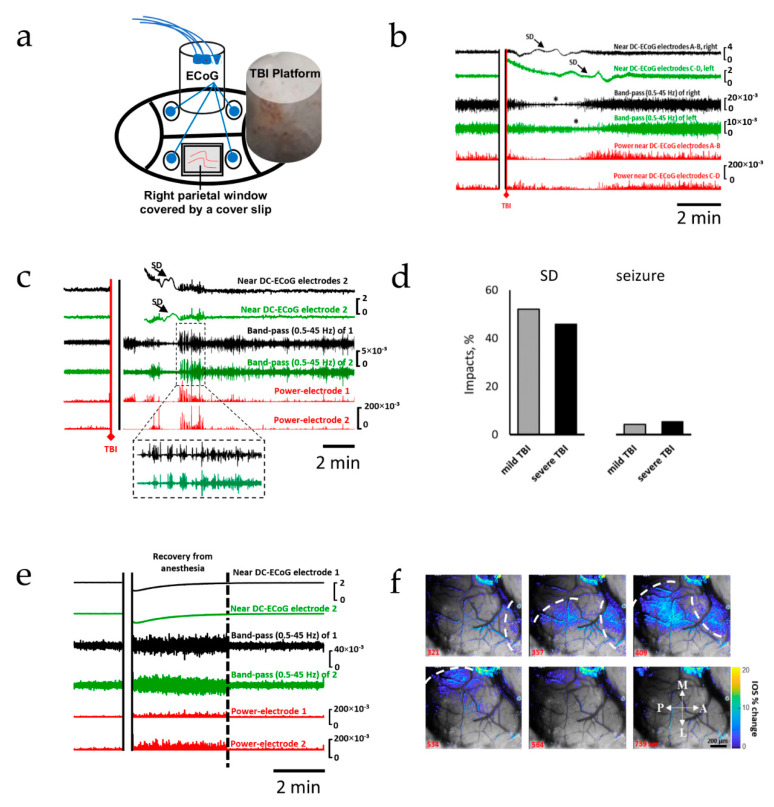
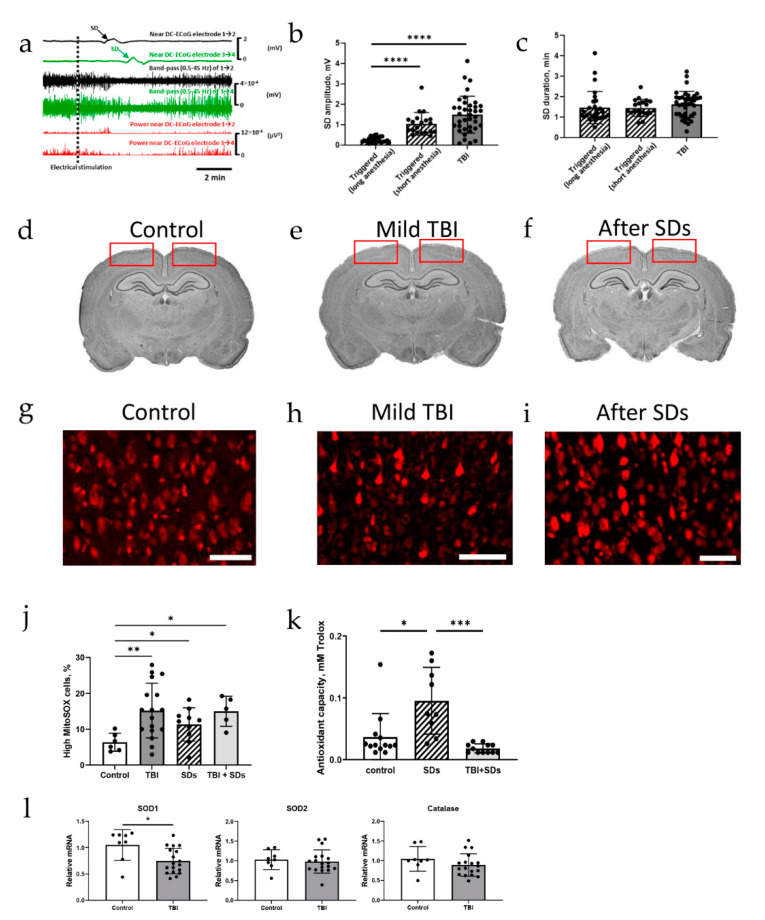
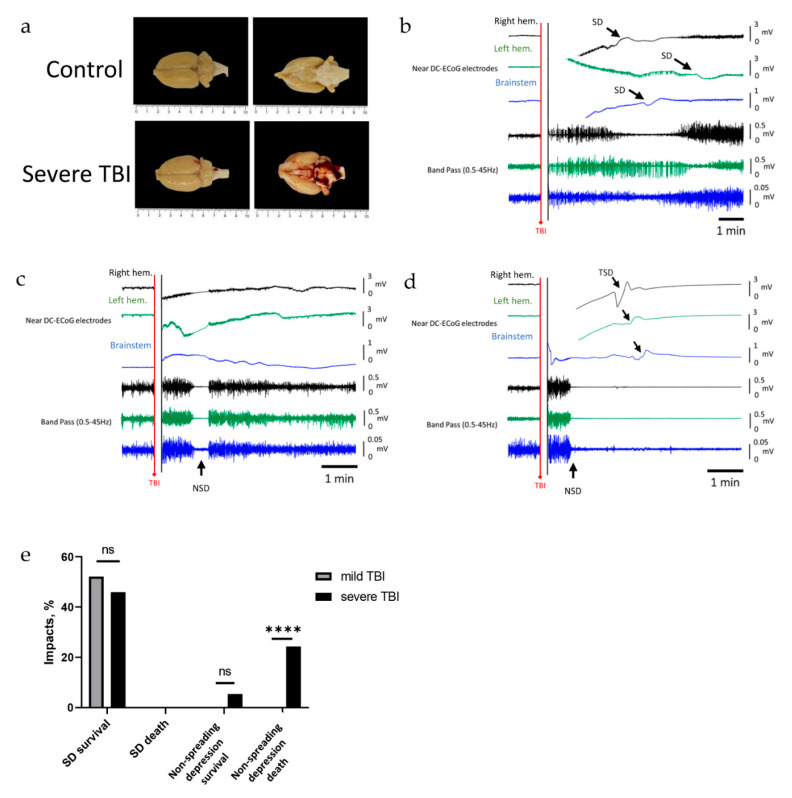
Traumatic brain injury (TBI) is the leading cause of death in young individuals, and is a major health concern that often leads to long-lasting complications. However, the electrophysiological events that occur immediately after traumatic brain injury, and may underlie impact outcomes, have not been fully elucidated. To investigate the electrophysiological events that immediately follow traumatic brain injury, a weight-drop model of traumatic brain injury was used in rats pre-implanted with epidural and intracerebral electrodes. Electrophysiological (near-direct current) recordings and simultaneous alternating current recordings of brain activity were started within seconds following impact. Cortical spreading depolarization (SD) and SD-induced spreading depression occurred in approximately 50% of mild and severe impacts. SD was recorded within three minutes after injury in either one or both brain hemispheres. Electrographic seizures were rare. While both TBI- and electrically induced SDs resulted in elevated oxidative stress, TBI-exposed brains showed a reduced antioxidant defense. In severe TBI, brainstem SD could be recorded in addition to cortical SD, but this did not lead to the death of the animals. Severe impact, however, led to immediate death in 24% of animals, and was electrocorticographically characterized by non-spreading depression (NSD) of activity followed by terminal SD in both cortex and brainstem.

Keywords: brainstem; cortical spreading depolarization; electrocorticography; oxidative stress; traumatic brain injury.


Conflict of interest statement

The authors declare no conflict of interest.

Figures

Figure 1
Figure 1
Spreading depolarization is the earliest and most common electrophysiological event after TBI. The upper two traces in each panel show raw ECoG recordings (band-pass: 0.02–100 Hz). The 3rd and 4th traces show band-passed (0.5–45 Hz) activity. Recordings from both the right (black) and left (green) hemispheres are shown. The 5th and 6th traces (red) show the squared activity (power near DC-ECoG). (a) Schematic representation of the general experimental setup. (b) Recording showing TBI-induced SDs recorded from both hemispheres. (c) Recording showing TBI-induced spreading depolarization with seizure activity immediately before and after SD; post-SD seizure is shown with expanded timescale. (d) Occurrence rates of SDs and seizures following mild and severe TBI. (e) Recording from a non-injured control; recovery from anesthesia is associated with a high-amplitude activity, which returns to pre-impact activity after regain of locomotion (dotted line). (f) Intravital microscopy showing changes in intrinsic optical signals during SD; changes in IOS are superimposed onto brain images; SDs propagated medially toward the midline; the dotted line represents the SD fronts. A: anterior; P: posterior; L: lateral; M: medial.
Figure 2
Figure 2
Changes in reactive oxygen species and antioxidant capacity after TBI or spreading depolarizations. (a) Recordings from both the right (black) and left (green) hemispheres, and power near DC-ECoG (red) of both hemispheres after electrical stimulation; SDs are triggered in both hemispheres. (b) Triggered SDs are lower in amplitude when the rat has been under anesthesia for a longer duration (p < 0.0001, Dunn’s test); TBI-induced SDs are higher in amplitude than triggered SDs (p < 0.0001, Dunn’s test); each dot represents 1 triggered SD or TBI impact. (c) Triggered SDs and TBI-induced SDs are equal in duration. (df) Cresyl staining showing no structural damage following mild TBI or triggered SDs; regions where MitoSOX fluorescence was measured are indicated by the red rectangles. (gj) MitoSOX staining results in high-fluorescent-intensity cells in fixed tissue; the percentage of high-MitoSOX cells is higher after mild TBI compared to controls (p = 0.0013, Dunnett’s test); SDs are associated with more MitoSOX fluorescence (p = 0.044, Dunnett’s test); SDs in TBI-exposed animals also show more MitoSOX fluorescence than controls (p = 0.0185, Dunnett’s test), with no difference compared with naïve animals exposed to SDs (p = 0.16, Tukey’s test); each dot represents 1 animal. Scale bar = 200 µm. (k) Antioxidant capacity increases after triggered SDs (p = 0.0189, Dunn’s test), unless triggered SDs were preceded by TBI (p = 0.38, Dunn’s test); each dot represents 1 animal. (l) SOD1 mRNA expression is decreased in repetitive mild TBI-impacted rats (p = 0.0105, unpaired T-test), but catalase (p = 0.22) and SOD2 (p = 0.68) mRNA expression are not affected by mild TBI; each dot represents 1 animal. * p < 0.05, ** p < 0.01, *** p < 0.001, and **** p < 0.0001.
Figure 3
Figure 3
The electrophysiological changes in brain hemispheres and brainstem following severe TBI. The first two traces represent raw ECoG recordings (band-pass: 0.02–100 Hz) from the right (black) and left (green) hemispheres, and the third trace (blue) is from the brainstem. Traces 4, 5, and 6 show brain activity (band-pass 0.5–45 Hz) of the first three ECoG traces, respectively. (a) Hemorrhages at the cortex and brainstem observed after severe TBI. (b) Recording after severe TBI shows SD and associated depression of activity in both cortical hemispheres and the brainstem. (c) Recording showing non-spreading depression of activity occurring simultaneously in both cortical hemispheres and the brainstem; activity returns and the rat survives. (d) Recording showing lasting non-spreading depression of activity followed by terminal spreading depolarizations (TSDs, arrows) in both cortical hemispheres and the brainstem, and death. (e) Occurrence rate of SDs and non-spreading depression in mild and severe TBI, and their association with TBI outcomes; non-spreading-depression-associated death occurs significantly more frequently (p < 0.0001, Fisher’s exact test) in severe TBI. **** p < 0.0001.
Figure 4
Figure 4
Flowchart of the study design. Schematic drawings show the location of ECoG recording and electrically triggering SDs, right parietal window for cortical monitoring, and constructed platforms for TBI.

References

    1. Laker S.R. Epidemiology of Concussion and Mild Traumatic Brain Injury. PM&R. 2011;3:S354–S358. doi: 10.1016/j.pmrj.2011.07.017. - DOI - PubMed
    1. Gardner R.C., Yaffe K. Epidemiology of Mild Traumatic Brain Injury and Neurodegenerative Disease. Mol. Cell. Neurosci. 2015;66:75–80. doi: 10.1016/j.mcn.2015.03.001. - DOI - PMC - PubMed
    1. Maas A.I.R., Menon D.K., Adelson P.D., Andelic N., Bell M.J., Belli A., Bragge P., Brazinova A., Büki A., Chesnut R.M., et al. Traumatic Brain Injury: Integrated Approaches to Improve Prevention, Clinical Care, and Research. Lancet Neurol. 2017;16:987–1048. doi: 10.1016/S1474-4422(17)30371-X. - DOI - PubMed
    1. Sharp D.J., Jenkins P.O. Concussion Is Confusing Us All. Pract. Neurol. 2015;15:172–186. doi: 10.1136/practneurol-2015-001087. - DOI - PMC - PubMed
    1. Shaw N.A. The Neurophysiology of Concussion. Prog. Neurobiol. 2002;67:281–344. doi: 10.1016/S0301-0082(02)00018-7. - DOI - PubMed