. 2021 Oct 29;22(21):11738.
doi: 10.3390/ijms222111738.

Chenodeoxycholic Acid Has Non-Thermogenic, Mitodynamic Anti-Obesity Effects in an In Vitro CRISPR/Cas9 Model of Bile Acid Receptor TGR5 Knockdown

Affiliations

Chenodeoxycholic Acid Has Non-Thermogenic, Mitodynamic Anti-Obesity Effects in an In Vitro CRISPR/Cas9 Model of Bile Acid Receptor TGR5 Knockdown

João S Teodoro et al. Int J Mol Sci. .

Abstract

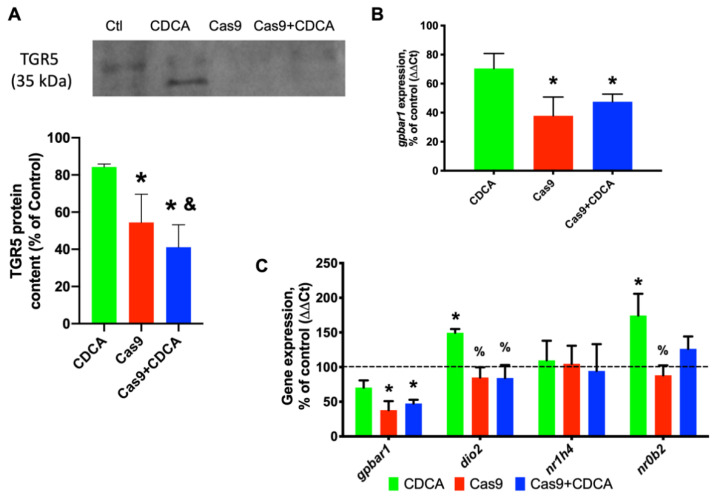
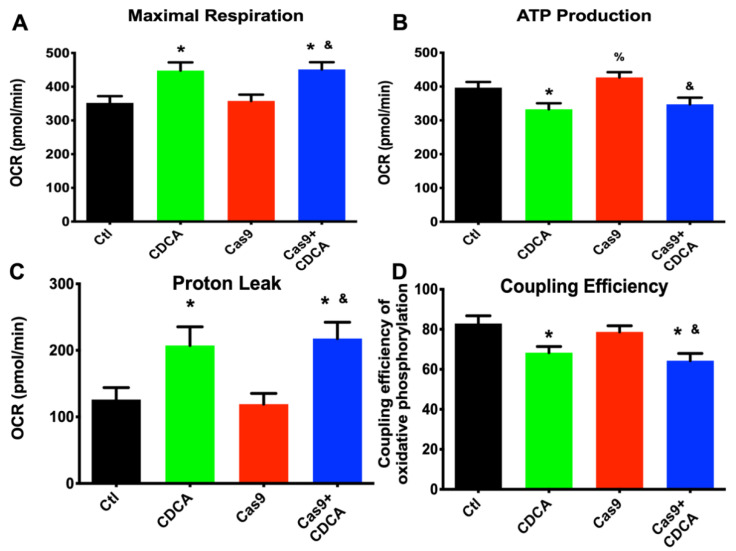
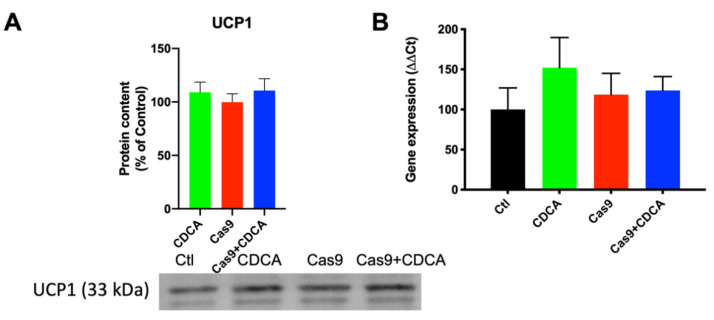
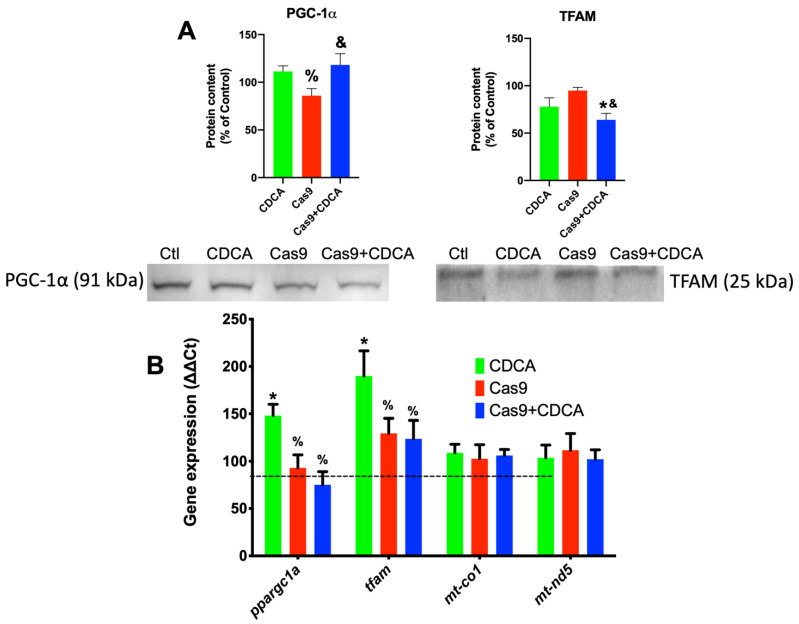
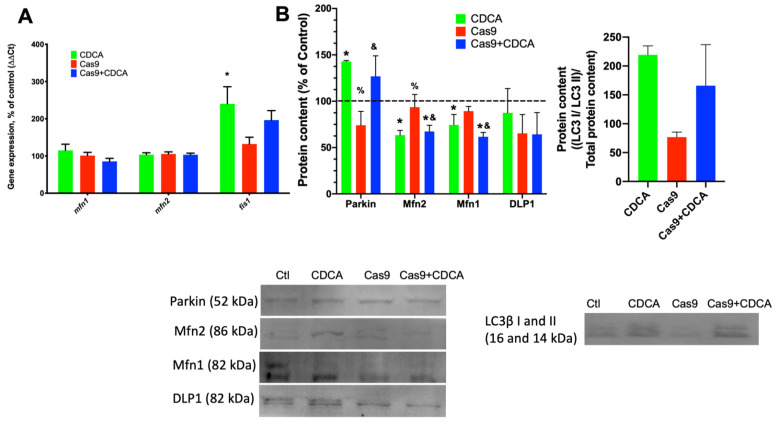
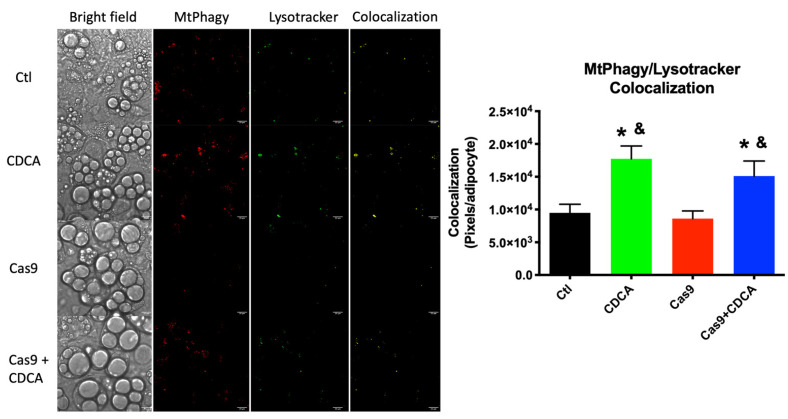
Bile acids (BA) have shown promising effects in animal models of obesity. However, the said effects are thought to rely on a thermogenic effect, which is questionably present in humans. A previous work has shown that the BA chenodeoxycholic acid (CDCA) can revert obesity and accelerate metabolism in animal and cell culture models. Thus, the aim of this study was to understand if this obesity reduction is indeed thermogenically-dependent. A CRISPR/Cas9 model of TGR5 (BA receptor) knockdown in 3T3-L1 adipocytes was developed to diminish thermogenic effects. Various parameters were assessed, including mitochondrial bioenergetics by Seahorse flux analysis, oxidative stress and membrane potential by fluorometry, intermediary metabolism by NMR, protein content assessment by Western Blot, gene expression by qPCR, and confocal microscopy evaluation of mitophagy. CDCA was still capable, for the most part, of reversing the harmful effects of cellular obesity, elevating mitophagy and leading to the reduction of harmed mitochondria within the cells, boosting mitochondrial activity, and thus energy consumption. In summary, CDCA has a non-thermogenic, obesity reducing capacity that hinges on a healthy mitochondrial population, explaining at least some of these effects and opening avenues of human treatment for metabolic diseases.

Keywords: 3T3-L1; CDCA; CRISPR/Cas9; TGR5; mitochondria; mitophagy.


Conflict of interest statement

The authors declare no conflict of interest. The funders had no role in the design of the study; in the collection, analyses, or interpretation of data; in the writing of the manuscript, or in the decision to publish the results.

Figures

Figure 1
Figure 1
Confirmation of the experimental model. (A) Western Blot representative image for TGR5 and quantification of protein content; (B) Gene expression (as percentage of control) for gpbar1, TGR5′s gene; and (C) Gene expression (as percentage of control) for the TGR5 downstream effector deiodinase 2 (D2, dio2), and the other BA receptor FXR (nr1h4) and its downstream gene, the small heterodimer protein (SHP, nr0b2). Data are derived from six independent experiments, and bars represent means ± SEM. * indicates a statistically significant difference vs. Control (p < 0.05); % indicates a statistically significant difference vs. CDCA (p < 0.05); & indicates a statistically significant difference vs. Cas9 (p < 0.05).
Figure 2
Figure 2
Seahorse respiration data obtained from 3T3-L1 adipocytes exposed to CDCA in the absence or presence of TGR5. (A) Maximal respiration; (B) ATP production; (C) Proton leak; (D) Oxidative phosphorylation coupling efficiency. Data are derived from 12 independent experiments, and bars represent means ± SEM. * indicates a statistically significant difference vs. Control (p < 0.05); % indicates a statistically significant difference vs. CDCA (p < 0.05); & indicates a statistically significant difference vs. Cas9 (p < 0.05).
Figure 3
Figure 3
UCP1 levels in 3T3-L1 adipocytes exposed to CDCA, in the absence or presence of TGR5. (A) Representative Western Blot for UCP1 and respective quantification; (B) Gene expression for ucp1. Data are derived from seven independent experiments, and bars represent means ± SEM (no statistical differences were found).
Figure 4
Figure 4
Gene expression and protein content for key elements of mitochondrial biogenesis in 3T3-L1 adipocytes exposed to CDCA in the absence or presence of TGR5. (A) Representative Western Blot for PGC-1α and TFAM; (B) Gene expression for PGC-1α (ppargc1a), TFAM (tfam), COX I (mt-co1), and mtND5 (mt-nd5). PGC-1a—Peroxisome proliferator-activated receptor gamma, coactivator-1alpha; TFAM—Transcription factor A, mitochondrial; COX I—Cytochrome c oxidase, subunit 1; mtND5—NADH-ubiquinone oxidoreductase, subunit 5. Data are derived from seven independent experiments, and bars represent means ± SEM. * indicates a statistically significant difference vs. Control (p < 0.05); % indicates a statistically significant difference vs. CDCA (p < 0.05); & indicates a statistically significant difference vs. Cas9 (p < 0.05).
Figure 5
Figure 5
Mitophagy evaluation on 3T3-L1 adipocytes exposed to CDCA in the absence or presence of TGR5. (A) Gene expression of mitodynamics-involved proteins mitofusins 1 and 2 (mfn1 and mfn2) and fission protein 1 (fis1); (B) Protein content of several players involved in mitophagy and mitochondrial fission and fusion. DLP1—Dynamin-like protein 1; Mfn1—Mitofusin 1; LC3—Light chain 3B; Mfn2—Mitofusin 2. Data are derived from 3 independent experiments, and bars represent means ± SEM. * indicates a statistically significant difference vs. Control (p < 0.05); % indicates a statistically significant difference vs. CDCA (p < 0.05); & indicates a statistically significant difference vs. Cas9 (p < 0.05).
Figure 6
Figure 6
Mitophagy evaluation on 3T3-L1 adipocytes exposed to CDCA in the absence or presence of TGR5. Fluorescence microscopy representative images of the various experimental conditions, when observed under white light or evaluating fluorescent signal of the two probes, MtPhagy and Lysotracker Green. A fourth panel indicates the fluorescence signals’ colocalization where it happens, where it is represented in yellow. Scale bars in microscopy photographs represent a distance of 22 µm. Microscopy figures contrast settings were all maxed solely to gain visual clarity and long after image analysis. Bars represent means ± SEM of at least 185 individually quantified adipocytes. * indicates a statistically significant difference vs. Control (p < 0.05); & indicates a statistically significant difference vs. Cas9 (p < 0.05).

References

    1. Abarca-Gómez L., Abdeen Z.A., Hamid Z.A., Abu-Rmeileh N.M., Acosta-Cazares B., Acuin C., Adams R.J., Aekplakorn W., Afsana K., Aguilar-Salinas C.A., et al. Worldwide Trends in Body-Mass Index, Underweight, Overweight, and Obesity from 1975 to 2016. Lancet. 2017;390:2627–2642. doi: 10.1016/S0140-6736(17)32129-3. - DOI - PMC - PubMed
    1. Pi-Sunyer F.X. The Obesity Epidemic: Pathophysiology and Consequences of Obesity. Obes. Res. 2002;10:202. doi: 10.1038/oby.2002.202. - DOI - PubMed
    1. Teodoro J.S., Rolo A.P., Jarak I., Palmeira C.M., Carvalho R.A. The Bile Acid Chenodeoxycholic Acid Directly Modulates Metabolic Pathways in White Adipose Tissue in Vitro: Insight into How Bile Acids Decrease Obesity. NMR Biomed. 2016;29:3583. doi: 10.1002/nbm.3583. - DOI - PubMed
    1. Teodoro J.S., Zouhar P., Flachs P., Bardova K., Janovska P., Gomes A.P., Duarte F.V., Varela A.T., Rolo A.P., Palmeira C.M., et al. Enhancement of Brown Fat Thermogenesis Using Chenodeoxycholic Acid in Mice. Int. J. Obes. 2014;38:1027–1034. doi: 10.1038/ijo.2013.230. - DOI - PubMed
    1. Watanabe M., Houten S.M., Wang L., Moschetta A., Mangelsdorf D.J., Heyman R.A., Moore D.D., Auwerx J. Bile Acids Lower Triglyceride Levels via a Pathway Involving FXR, SHP, and SREBP-1c. J. Clin. Investig. 2004;113:1408–1418. doi: 10.1172/JCI21025. - DOI - PMC - PubMed