

Inquiry into the Temperature Changes of Rock Massif Used in Energy Production in Relation to Season
- PMID: 34770334
- PMCID: PMC8587796
- DOI: 10.3390/s21217027
Inquiry into the Temperature Changes of Rock Massif Used in Energy Production in Relation to Season
Abstract
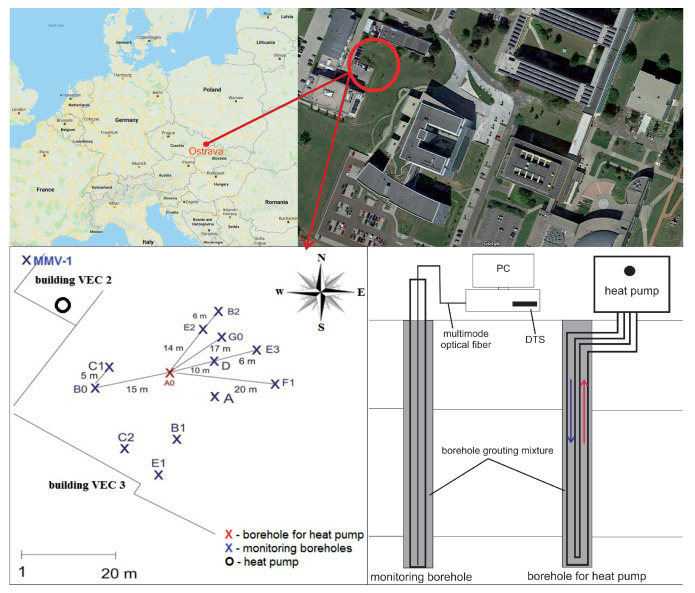
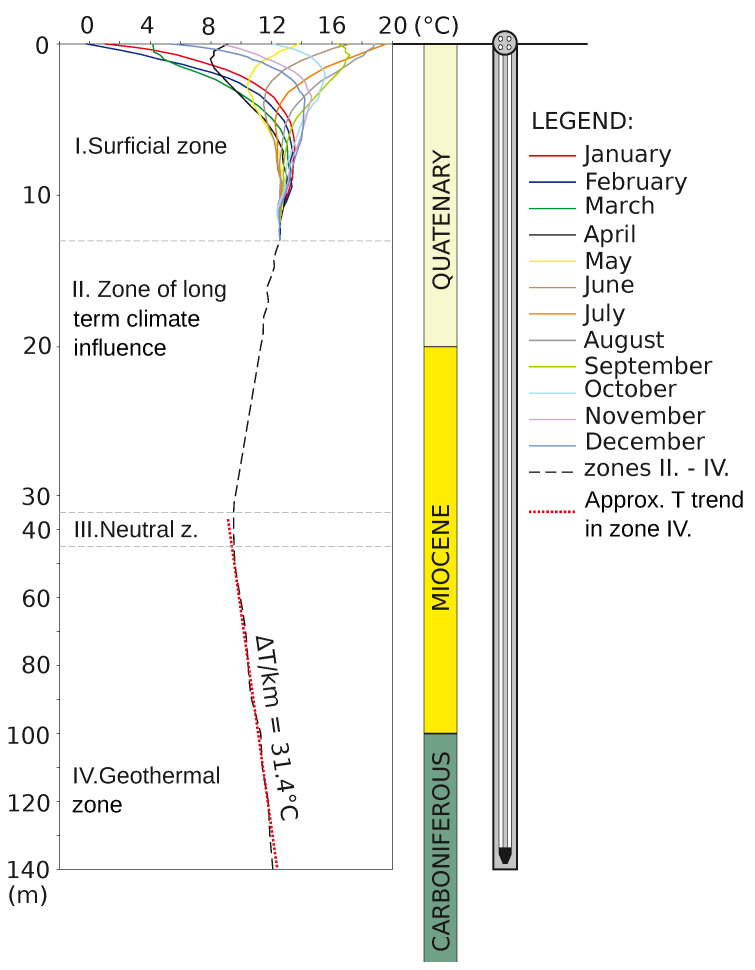
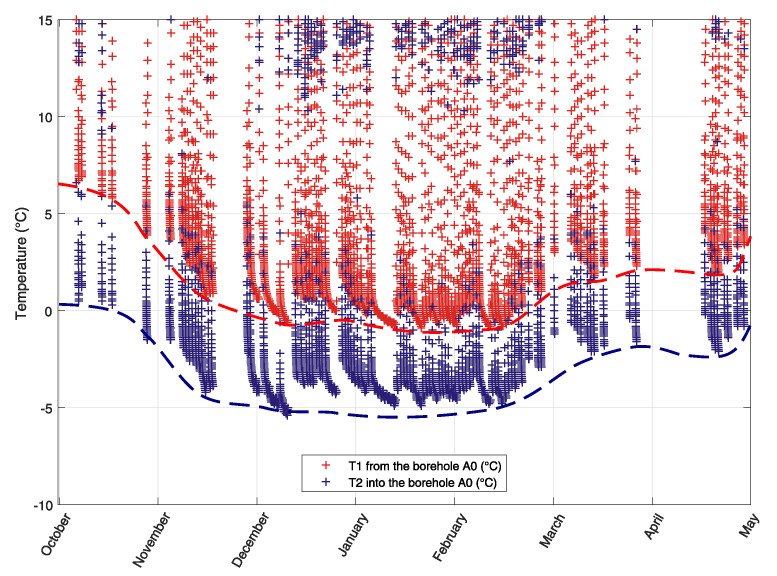
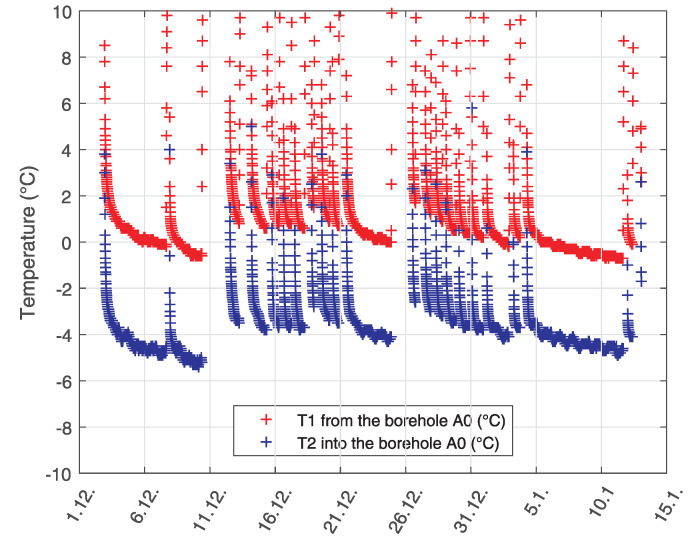
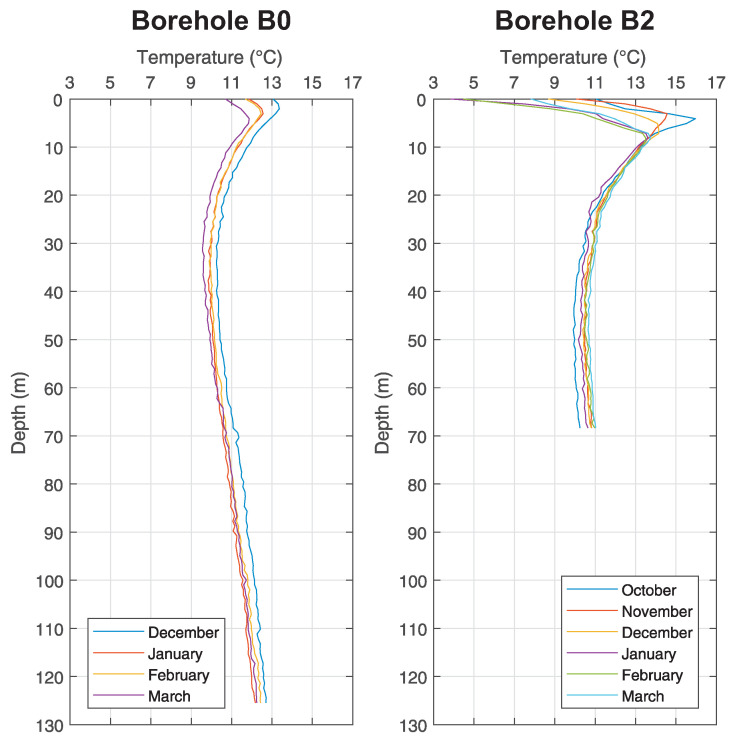
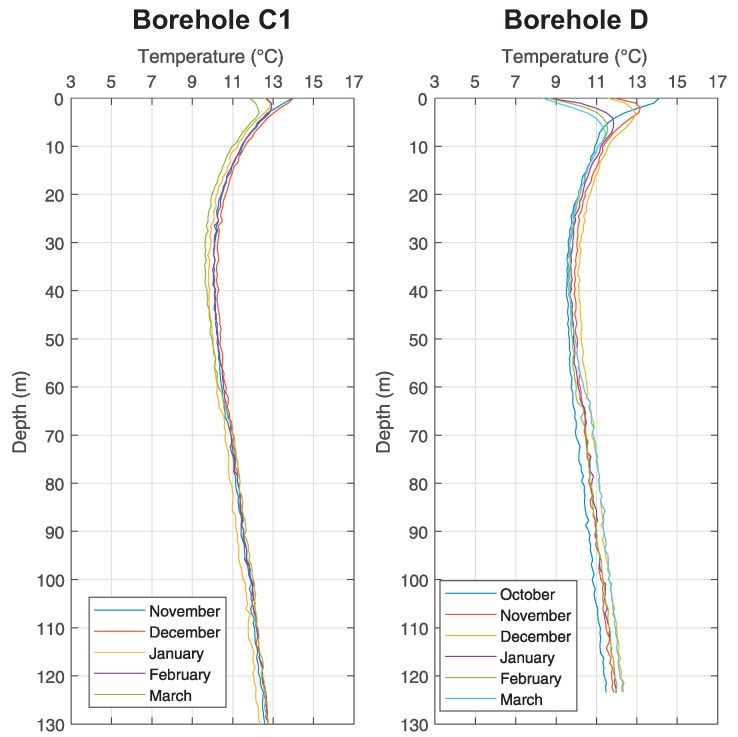
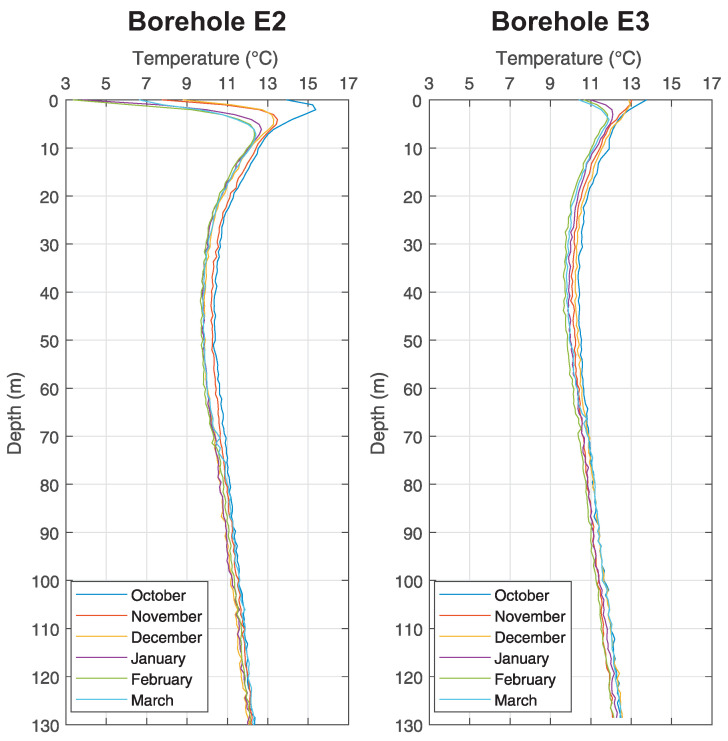
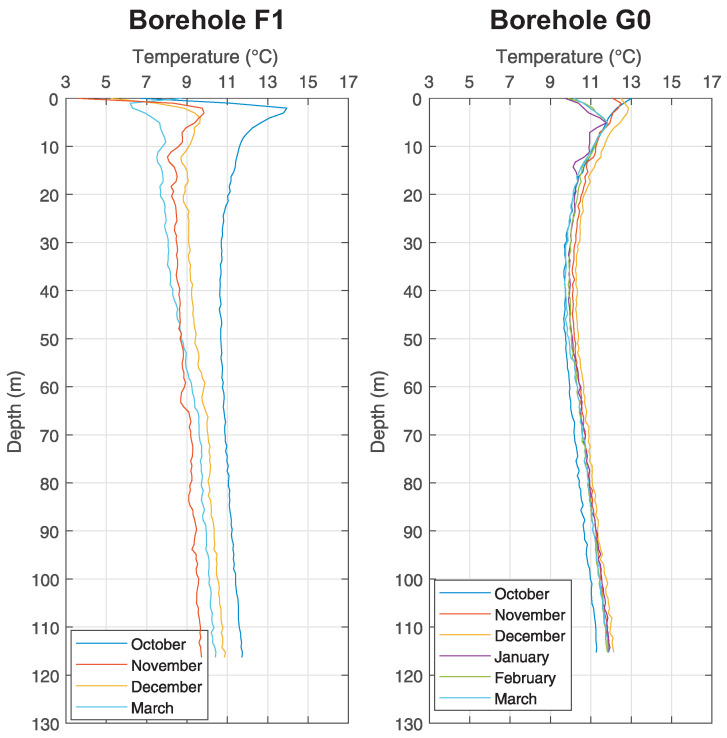
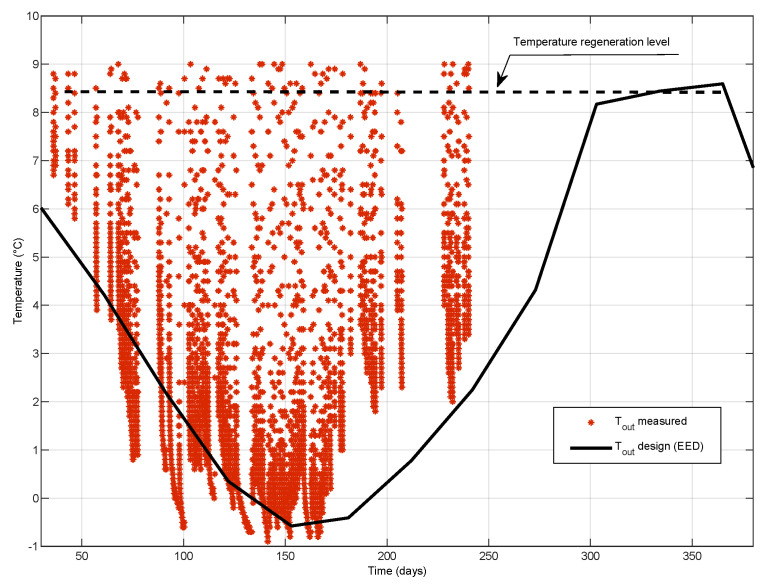
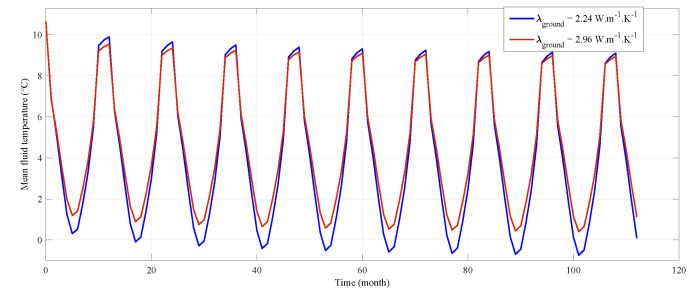
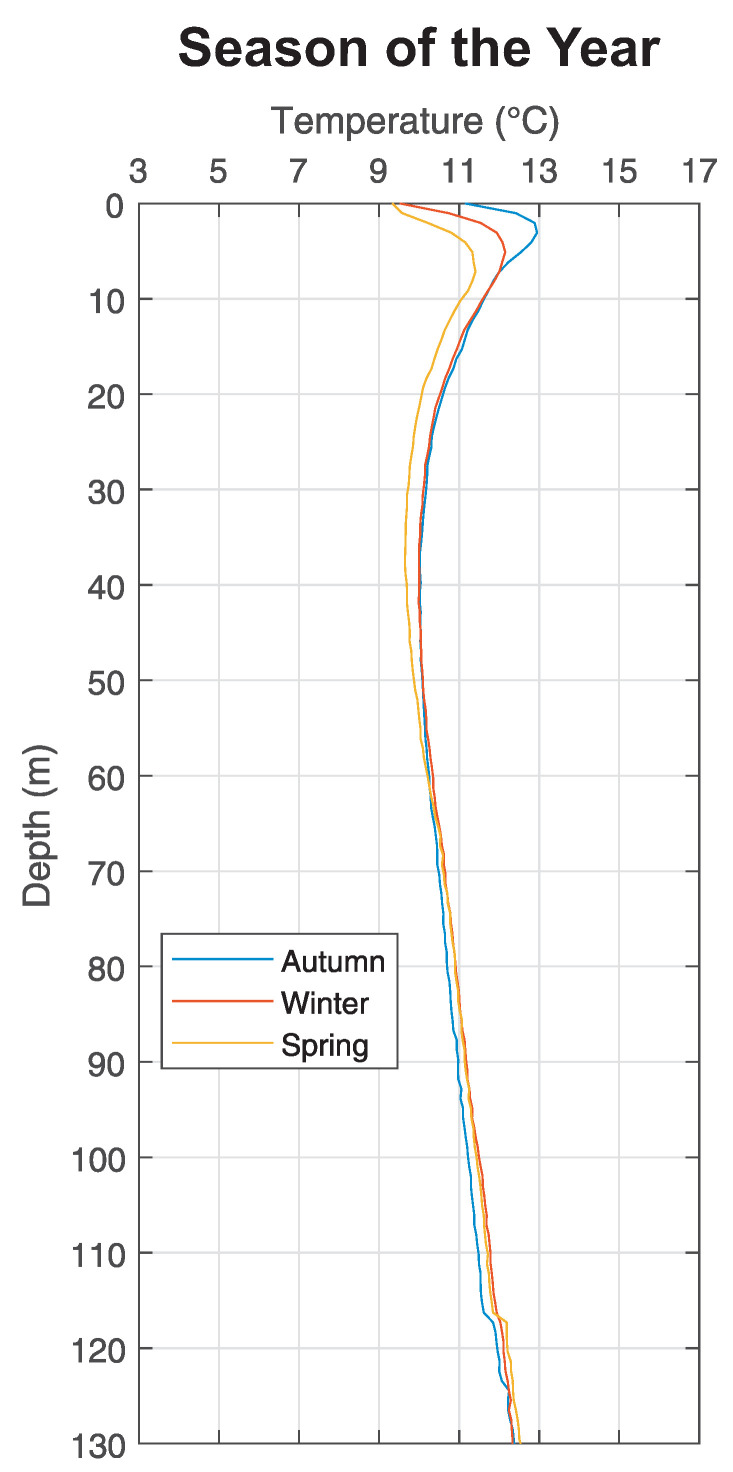
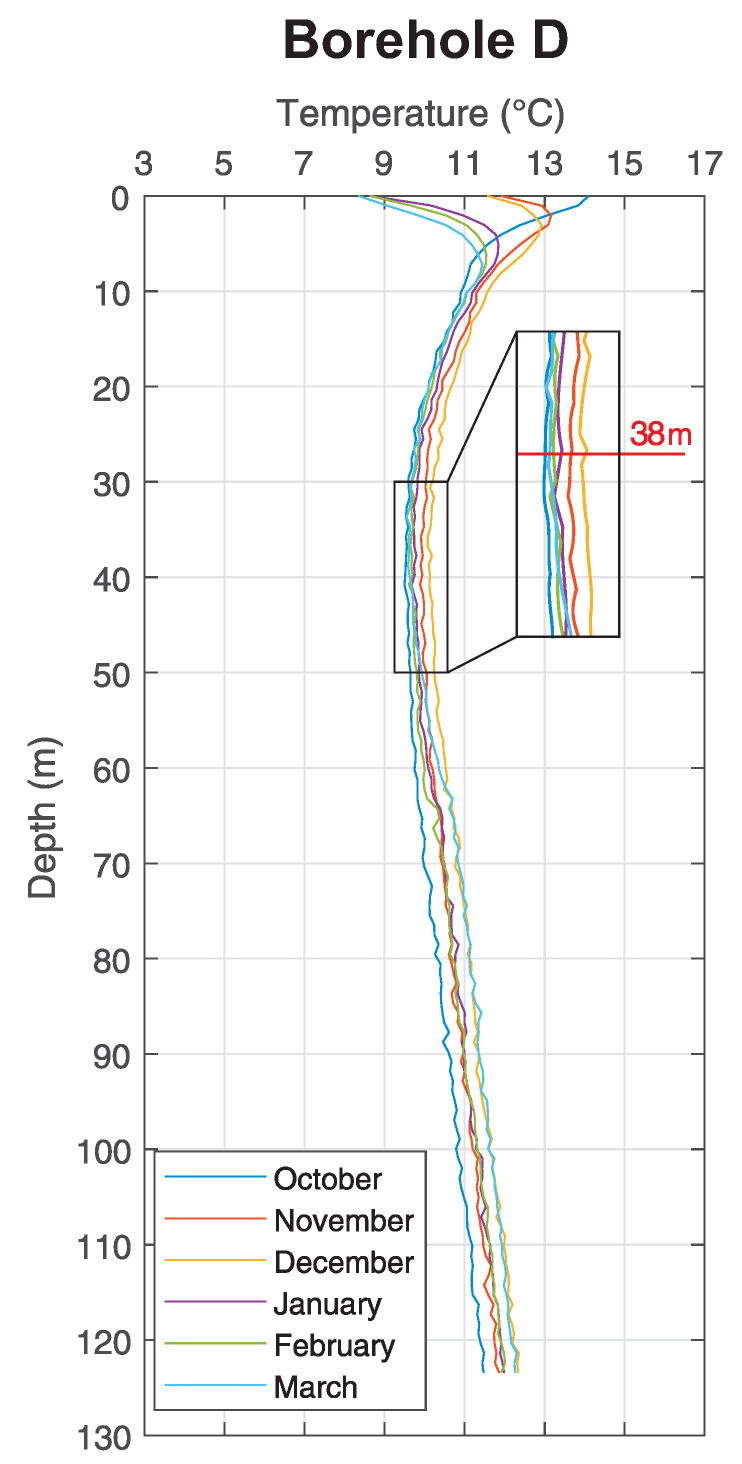
This research was undertaken to perform and evaluate the temperature measurement in the ground utilized as an energy source with the goal to determine whether significant temperature variations occur in the subsurface during the heating season. The research infrastructure situated on our University campus was used to assess any variations. The observations were made at the so called "Small Research Polygon" that consists of 8 monitoring boreholes (Borehole Heat Exchangers) situated around a borehole used as an energy source. During the heating season, a series of monthly measurements are made in the monitoring boreholes using a distributed temperature system (DTS). Raman back-scattered light is analysed using Optical Frequency Time Domain Reflectometry (OTDR). Our results indicate that no noticeable changes in temperature occur during the heating season. We have observed an influence of long-term variations of the atmospheric conditions up to the depth of a conventional BHE (≈100 m). The resulting uncertainty in related design input parameters (ground thermal conductivity) was evaluated by using a heat production simulation. Production data during one heating season at our research facilities were evaluated against the design of the system. It is possible to construct smaller geothermal installations with appropriate BHE design that will have a minimal impact on the temperature of the surrounding rock mass and the system performance.
Keywords: Raman-OTDR (DTS); borehole heat exchanger; ground source heat pump; ground temperature field; ground thermal conductivity; temperature measurement.
Conflict of interest statement
The authors declare no conflict of interest. The funders had no role in the design of the study; in the collection, analyses, or interpretation of data; in the writing of the manuscript, or in the decision to publish the results.
Figures
References
-
- Bujok P., Grycz D., Klempa M., Kunz A., Porzer M., Pytlik A., Rozehnal Z., Vojčinák P. Assessment of the influence of shortening the duration of TRT (thermal response test) on the precision of measured values. Energy. 2014;64:120–129. doi: 10.1016/j.energy.2013.11.079. - DOI
-
- Lazzari S., Priarone A., Zanchini E. Long-term performance of BHE (borehole heat exchanger) fields with negligible groundwater movement. Energy. 2010;35:4966–4974. doi: 10.1016/j.energy.2010.08.028. - DOI
-
- EGEC . Geothermal Market Report 2016. 6th ed. European Geothermal Energy Council; Brussels, Belgium: 2017.
-
- Bujok P. Metodika Projektování a Instalace Vrtaných Tepelných Výměníků Pro různě Velké systémy na Základě Stanovených Fyzikálních Vlastností Horninového Masivu. 2015. Project TA č. 01020932. (In Czech)
-
- Giordano N., Comina C., Mandrone G., Cagni A. Borehole thermal energy storage (BTES). First results from the injection phase of a living lab in Torino (NW Italy) Renew. Energy. 2016;86:993–1008. doi: 10.1016/j.renene.2015.08.052. - DOI
MeSH terms
Grants and funding
- SP2021/107/Ministry of Education, Youth and Sports of the Czech Republic
- SP2021/45/Ministry of Education, Youth and Sports of the Czech Republic
- SP2021/85/Ministry of Education, Youth and Sports of the Czech Republic
- SP2021/92/Ministry of Education, Youth and Sports of the Czech Republic
- CZ.1.07/2.3.00/20.0217/Ministry of Education, Youth and Sports of the Czech Republic
LinkOut - more resources
Full Text Sources
