. 2021 Oct 31;26(21):6615.
doi: 10.3390/molecules26216615.

Mesoporous Poly(melamine- co-formaldehyde) Particles for Efficient and Selective Phosphate and Sulfate Removal

Affiliations

Mesoporous Poly(melamine- co-formaldehyde) Particles for Efficient and Selective Phosphate and Sulfate Removal

Konstantin B L Borchert et al. Molecules. .

Abstract

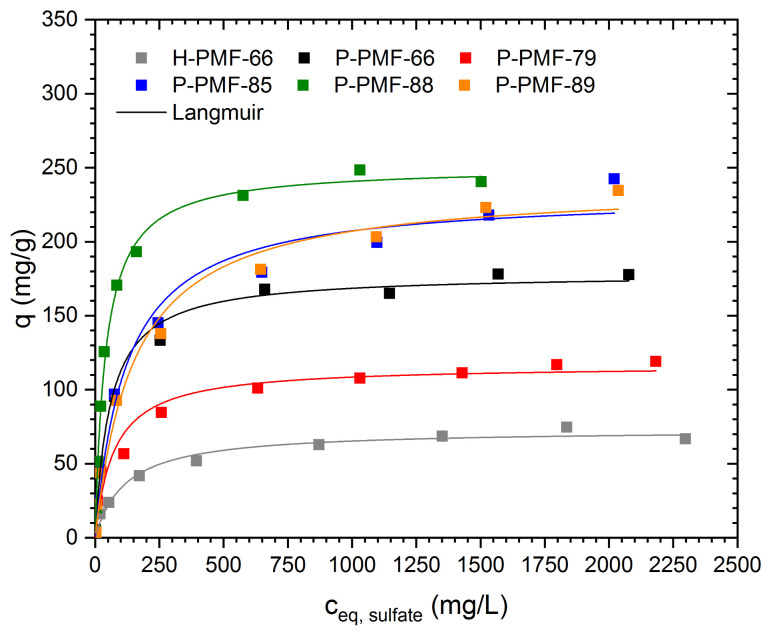
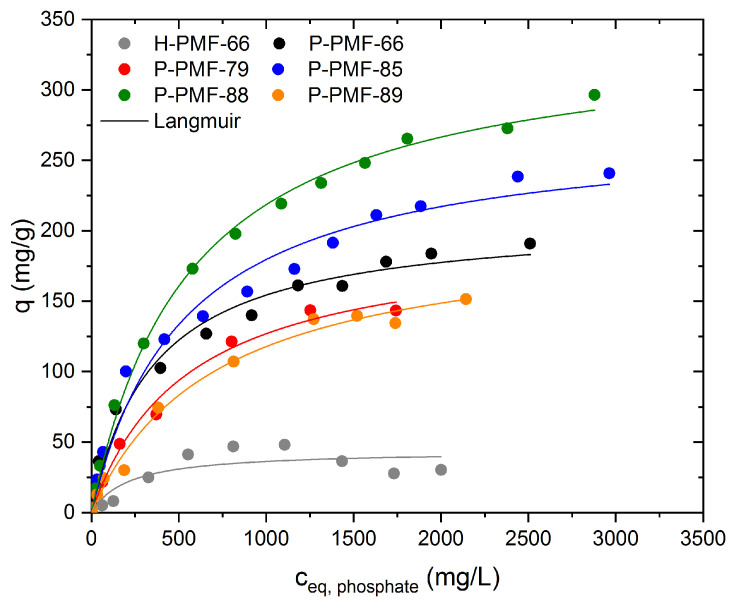
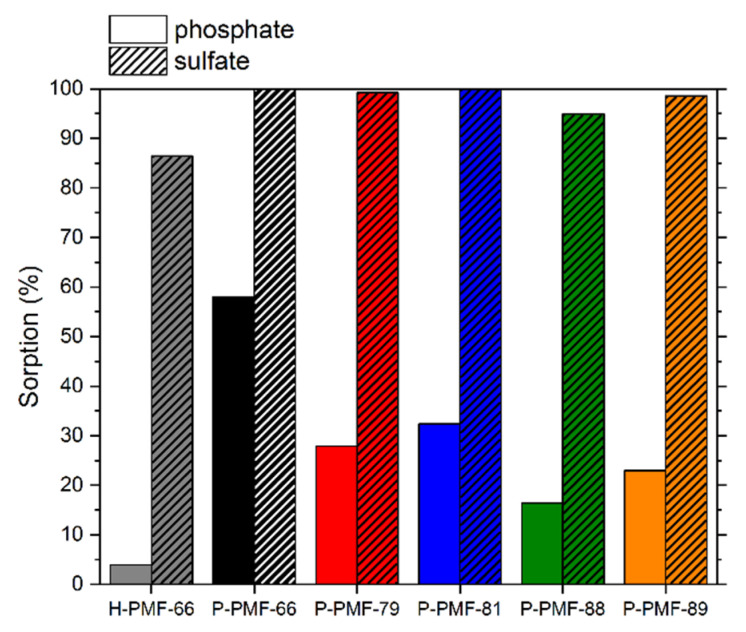
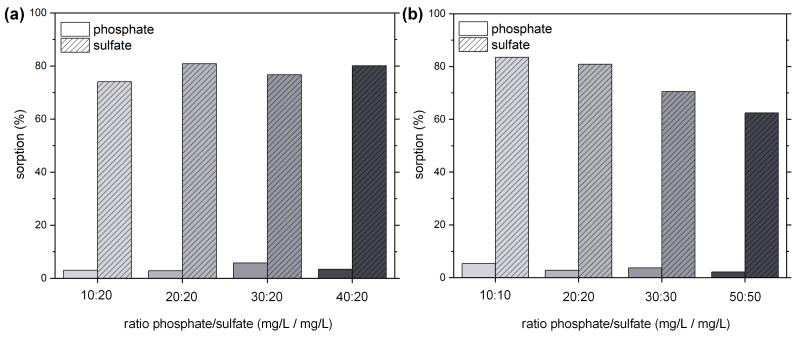
Due to the existence-threatening risk to aquatic life and entire ecosystems, the removal of oxyanions such as sulfate and phosphate from anthropogenic wastewaters, such as municipal effluents and acid mine drainage, is inevitable. Furthermore, phosphorus is an indispensable resource for worldwide plant fertilization, which cannot be replaced by any other substance. This raises phosphate to one of the most important mineral resources worldwide. Thus, efficient recovery of phosphate is essential for ecosystems and the economy. To face the harsh acidic conditions, such as for acid mine drainage, an adsorber material with a high chemical resistivity is beneficial. Poly(melamine-co-formaldehyde) (PMF) sustains these conditions whilst its very high amount of nitrogen functionalities (up to 53.7 wt.%) act as efficient adsorption sides. To increase adsorption capacities, PMF was synthesized in the form of mesoporous particles using a hard-templating approach yielding specific surface areas up to 409 m2/g. Different amounts of silica nanospheres were utilized as template and evaluated for the adsorption of sulfate and phosphate ions. The adsorption isotherms were validated by the Langmuir model. Due to their properties, the PMF particles possessed outperforming maximum adsorption capacities of 341 and 251 mg/g for phosphate and sulfate, respectively. Furthermore, selective adsorption of sulfate from mixed solutions of phosphate and sulfate was found for silica/PMF hybrid particles.

Keywords: hard templating; melamine–formaldehyde resin; oxyanion removal; porous resin particles; selectivity; silica; sorption; water treatment.


Conflict of interest statement

The authors declare no conflict of interest.

Figures

Figure 1
Figure 1
ATR-FTIR spectra of (a) H-PMF and (b) P-PMF samples. All spectra were normalized to the bending of the triazine ring at 812 cm−1 for comparability. The modes marked with a dashed line are 1 NH bending and ν C=N; 2 + 3 CH2 bending; 4 triazine bending; 5 ν Si–O.
Figure 2
Figure 2
Thermogravimetric analysis from (a) the H-PMF samples and (b) the P-PMF samples with PMF-66 shown in black, PMF-79 in red, PMF-85 in blue, PMF-88 in green and PMF-89 in orange.
Figure 3
Figure 3
(a) TEM image of H-PMF-66, (f) TEM image of P-PMF-66 and (k) SEM image of P-PMF-66; (b) TEM image of H-PMF-79; (g) TEM image of P-PMF-79 and (l) SEM image of P-PMF-79; (c) TEM image of H-PMF-85; (h) TEM image of P-PMF-85 and (m) SEM image of P-PMF-85; (d) TEM image of H-PMF-88; (i) TEM image of P-PMF-88 and (n) SEM image of P-PMF-88; (e) TEM image of H-PMF-89; (j) TEM image of P-PMF-89 and (o) SEM image of P-PMF-89.
Figure 4
Figure 4
(a) Particle size distributions of the unpurified reaction mixtures of H-PMF samples; (b) particle size distribution of the P-PMF samples and H-PMF-66 after purification. H-PMF-66 is shown in gray, H-PMF-79 in pink, H-PMF-85 in light blue, H-PMF-88 in light green, H-PMF-89 in light orange. P-PMF-66 is shown in black, P-PMF-79 in red, P-PMF-85 in blue, P-PMF-88 in dark green and P-PMF-89 in orange.
Figure 5
Figure 5
(a) Nitrogen (N2) de-/adsorption isotherms measured at 77 K for H-PMF samples; (b) carbon dioxide (CO2) de-/adsorption isotherms measured at 273 K for P-PMF samples; (c) nitrogen (N2) de-/adsorption isotherms measured at 77 K for P-PMF samples. Datapoints in the adsorption and desorption branch of the isotherms are indicated by filled and empty symbols, respectively. (d) Pore size distribution (PSD) analysis for the adsorption branch was calculated by using QSDFT (quenched solid state density functional theory) model for carbon with slit/cylindrical/sphere pores. H-PMF-66 is shown in gray, H-PMF-79 in pink, H-PMF-85 in light blue, H-PMF-88 in light green, H-PMF-89 in light orange P-PMF-66 is shown in black, P-PMF-79 in red, P-PMF-85 in blue, P-PMF-88 in dark green and P-PMF-89 in orange.
Figure 6
Figure 6
Sorption isotherms for sulfate ions onto H-PMF-66 (gray), P-PMF-66 (black), P-PMF-79 (red), P-PMF-85 (blue), P-PMF-88 (green) and P-PMF-89 (orange) with the corresponding Langmuir fits (solid lines). The corresponding pH values are displayed in Figures S7–S12. The fitting parameters are displayed in Table 3. The respective fitting comparison can be seen in Figure S13.
Figure 7
Figure 7
SEM image and SEM-EDX elemental mapping of P-PMF-88 after the adsorption of sulfate with ceq = 1502 mg/g SO42- with the elements C shown in red, N in yellow and S in dark green.
Figure 8
Figure 8
Sorption isotherms for phosphate ions onto H-PMF-66 (gray), P-PMF-66 (black), P-PMF-79 (red), P-PMF-85 (blue), P-PMF-88 (green) and P-PMF-89 (orange) with the corresponding Langmuir fits (solid lines). The corresponding pH values are displayed in Figures S7–S12. The fitting parameters are displayed in Table 4. The respective fitting comparison can be seen in Figure S14.
Figure 9
Figure 9
SEM image and SEM-EDX elemental mapping of P-PMF-88 after adsorption of phosphate with ceq = 1502 mg/g PO43− with the elements C shown in red, N in yellow and P in light green.
Figure 10
Figure 10
Percentage adsorption of PO43− (solid) and SO42− (striped) for H-PMF-66 and the P-PMF samples from a solution containing both 10 mg/L PO43− and 10 mg/L SO42−, whereby H-PMF-66 is shown in gray, PMF-66 in black, P-PMF-79 in red, P-PMF-85 in blue, P-PMF-88 in green and P-PMF-89 in orange. The respective pH0 and pHeq values can be seen in Figure S15.
Figure 11
Figure 11
Percentage adsorption of PO43− (solid) and SO42− (striped) for H-PMF-66 from (a) solutions containing both phosphate (at different concentrations) and 20 mg/L sulfate; (b) solutions of 1:1 ratios of phosphate and sulfate at different concentrations. The respective pH0 and pHeq values can be seen in Figures S16 and S17.

Similar articles

References

    1. Fatima T., Muntean A. Sulfate attack in sewer pipes: Derivation of a concrete corrosion model via two-scale convergence. Nonlinear Anal. Real World Appl. 2014;15:326–344. doi: 10.1016/j.nonrwa.2012.01.019. - DOI
    1. Katayev E.A., Ustynyuk Y.A., Sessler J.L. Receptors for tetrahedral oxyanions. Coord. Chem. Rev. 2006;250:3004–3037. doi: 10.1016/j.ccr.2006.04.013. - DOI
    1. Elphick J.R., Davies M., Gilron G., Canaria E.C., Lo B., Bailey H.C. An aquatic toxicological evaluation of sulfate: The case for considering hardness as a modifying factor in setting water quality guidelines. Environ. Toxicol. Chem. 2010;30:247–253. doi: 10.1002/etc.363. - DOI - PubMed
    1. Soucek D.J., Kennedy A.J. Effects of hardness, chloride, and acclimation on the acute toxicity of sulfate to freshwater invertebrates. Environ. Toxicol. Chem. 2005;24:1204–1210. doi: 10.1897/04-142.1. - DOI - PubMed
    1. Austigard Å.D., Svendsen K., Heldal K.K. Hydrogen sulphide exposure in waste water treatment. J. Occup. Med. Toxicol. 2018;13:10. doi: 10.1186/s12995-018-0191-z. - DOI - PMC - PubMed

LinkOut - more resources