Review
. 2021 Nov 4;26(21):6677.
doi: 10.3390/molecules26216677.

Globally Approved EGFR Inhibitors: Insights into Their Syntheses, Target Kinases, Biological Activities, Receptor Interactions, and Metabolism

Affiliations
Review

Globally Approved EGFR Inhibitors: Insights into Their Syntheses, Target Kinases, Biological Activities, Receptor Interactions, and Metabolism

Mohammed A S Abourehab et al. Molecules. .

Abstract

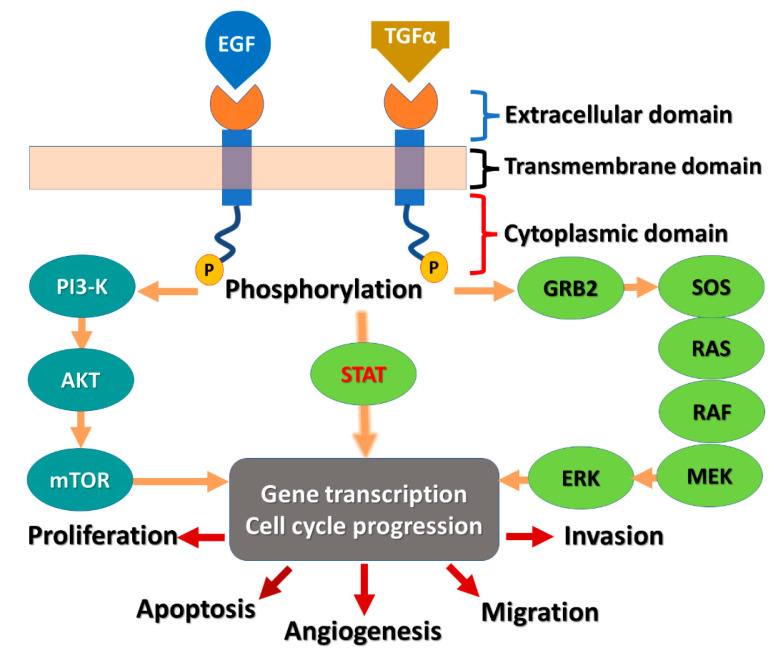
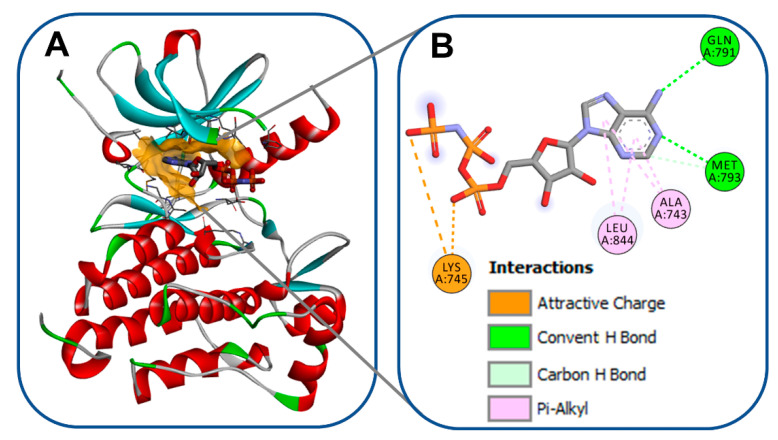
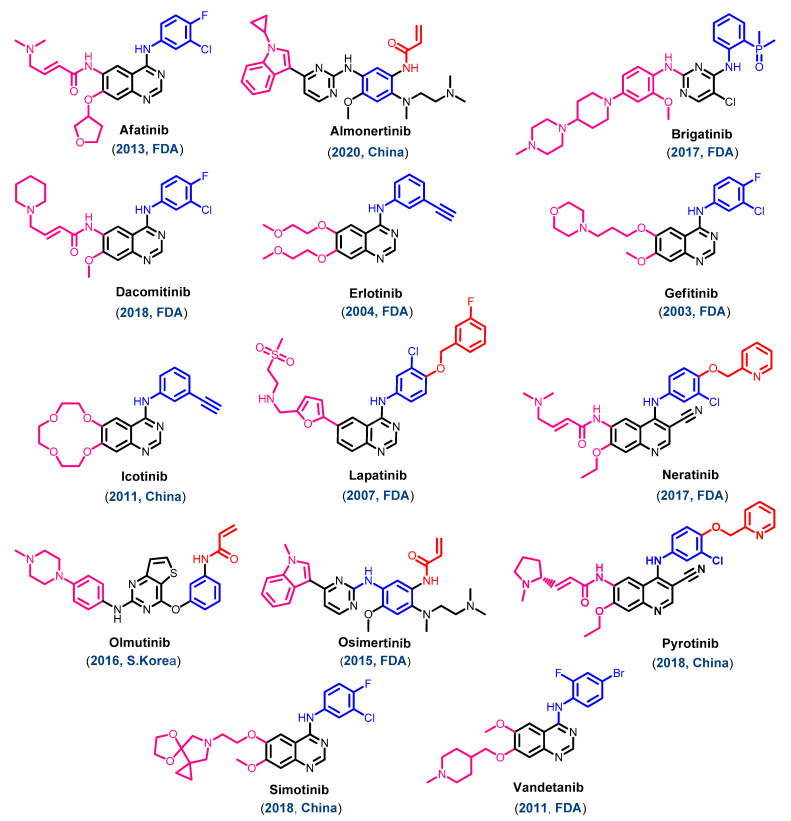
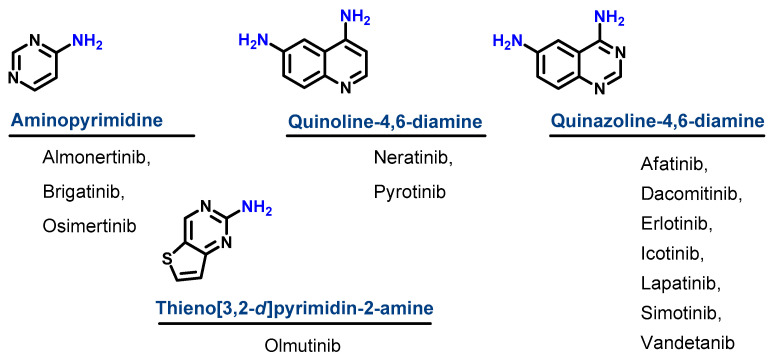
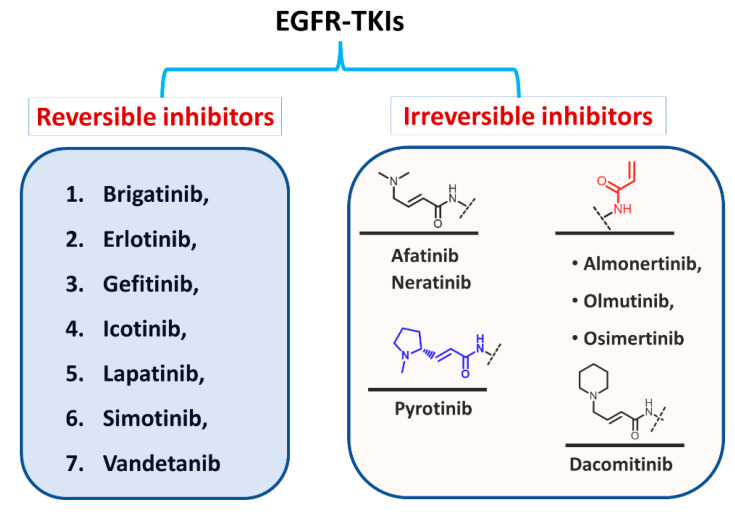
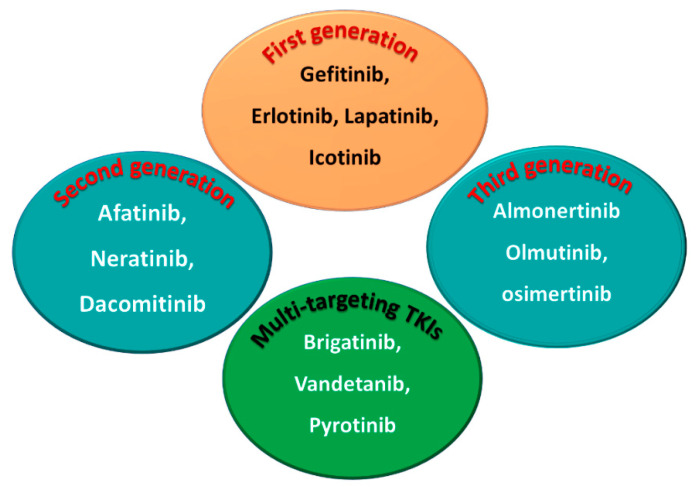
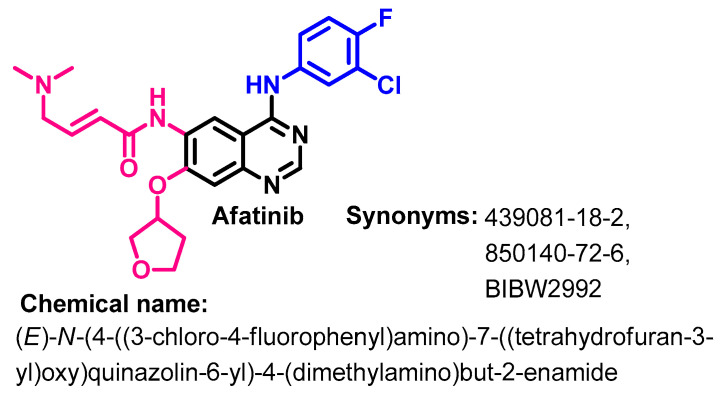
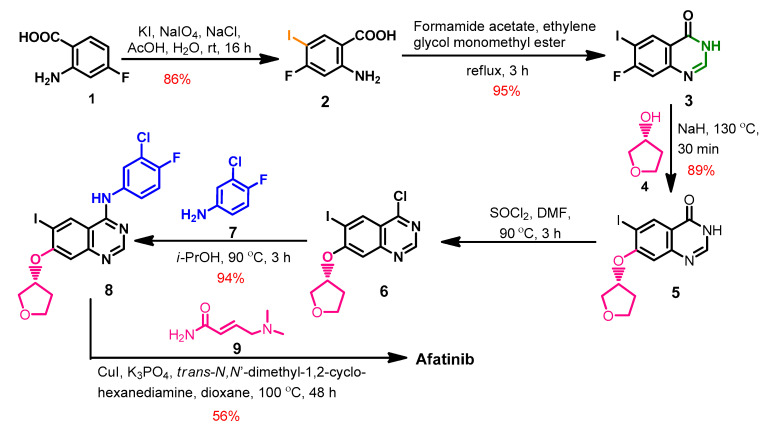
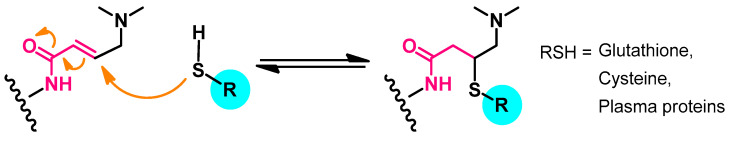
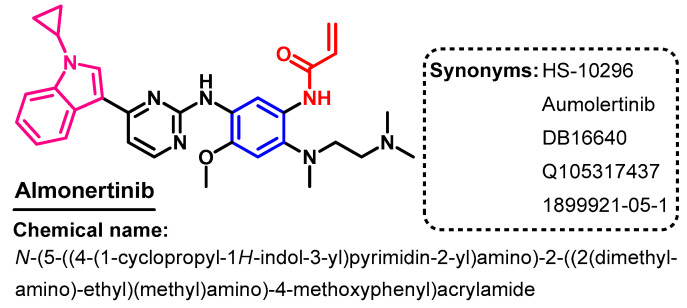
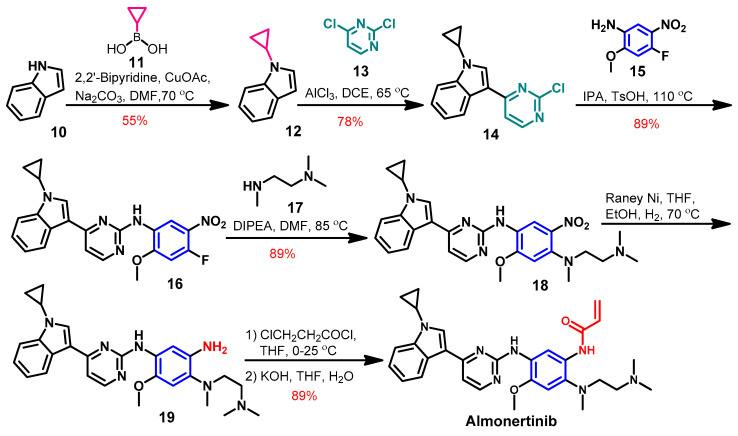
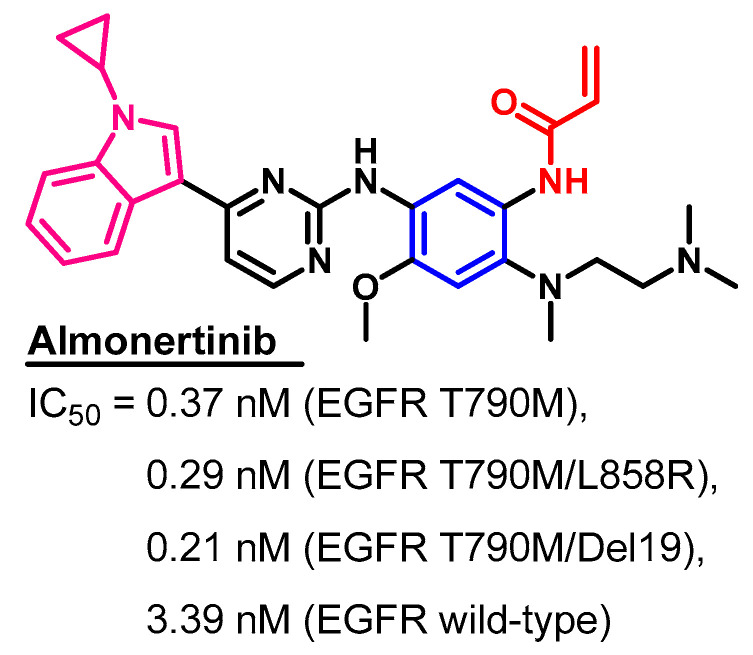
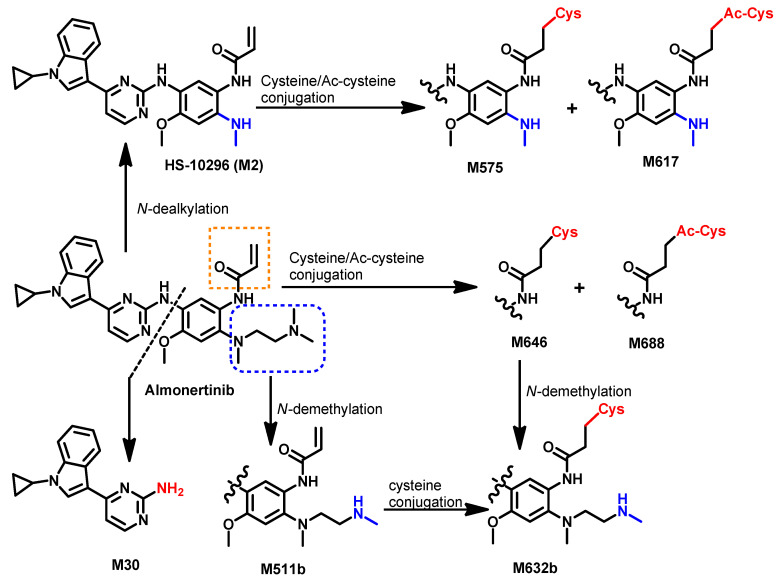
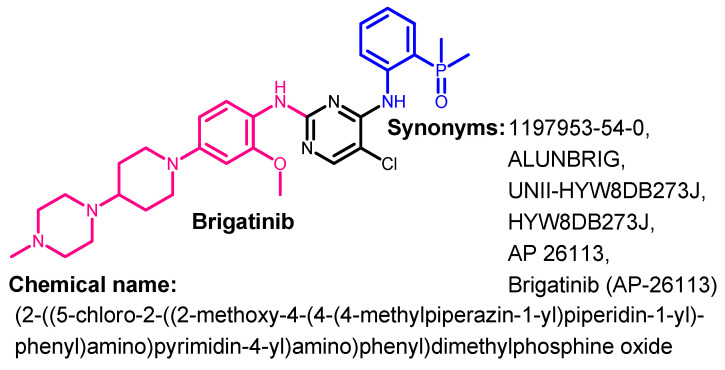
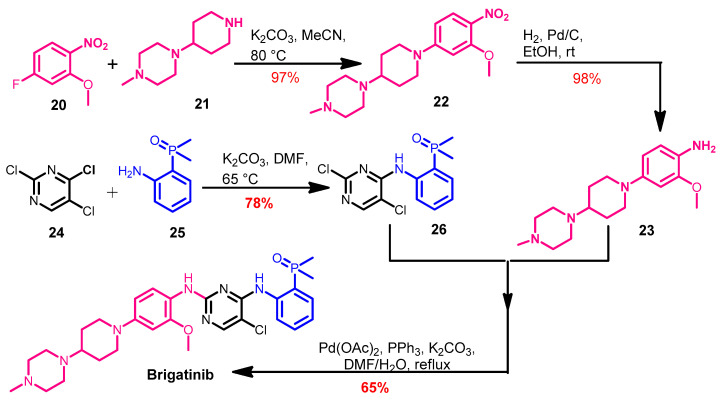
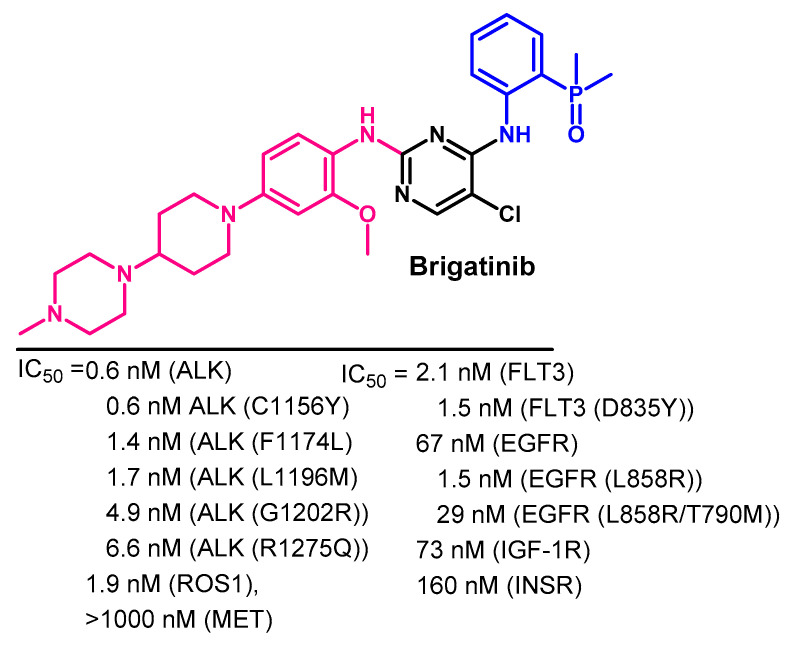
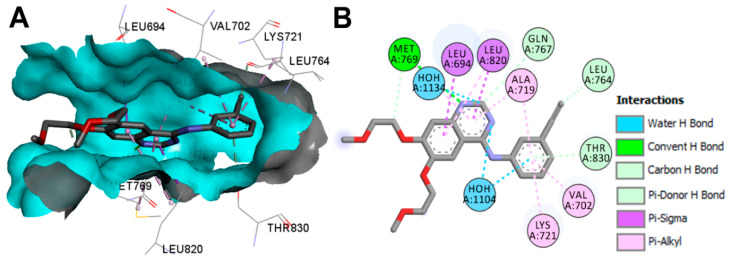
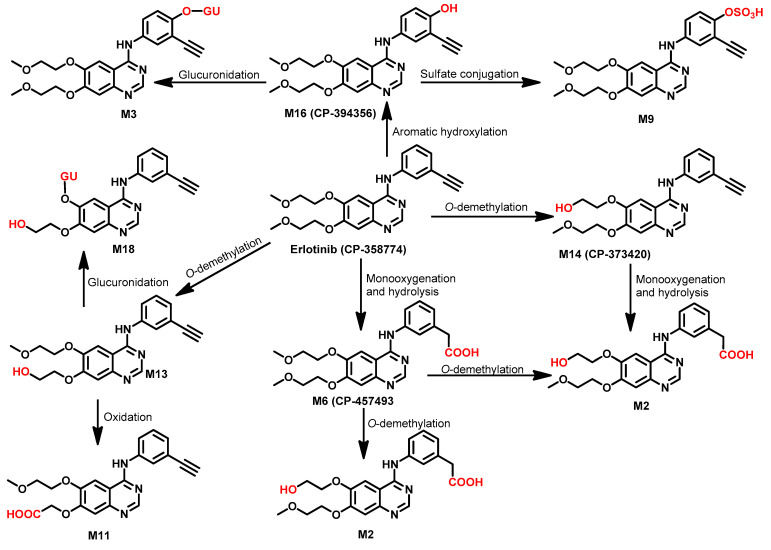
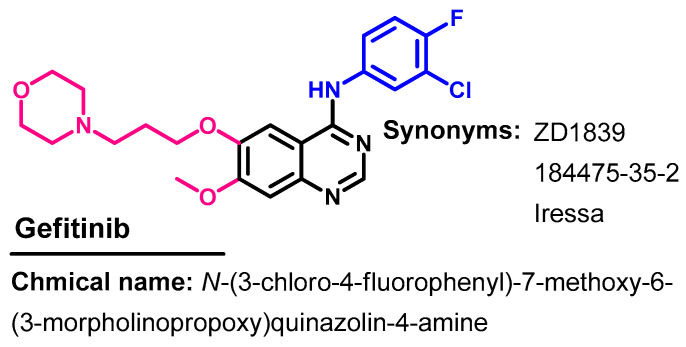
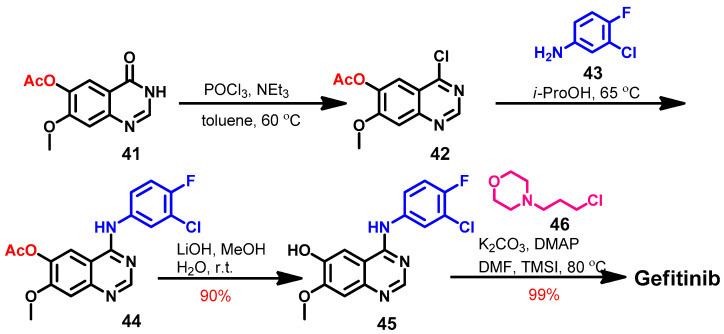
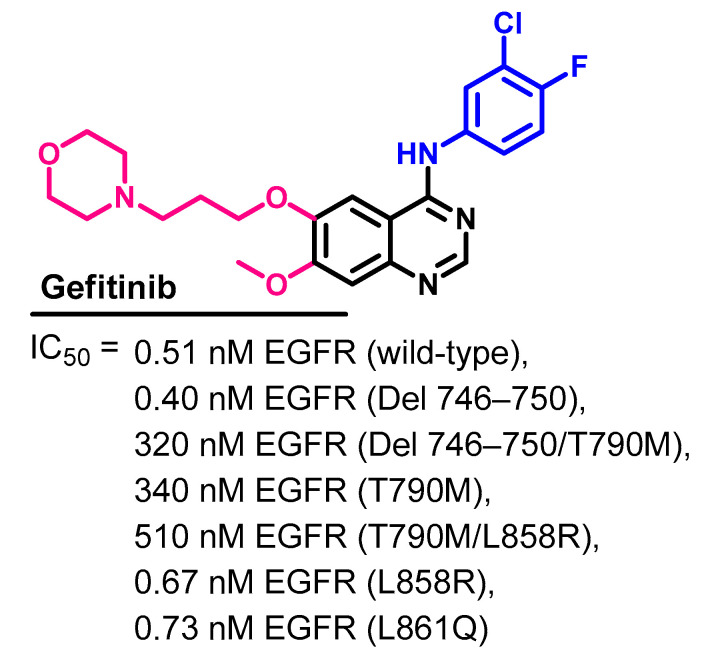
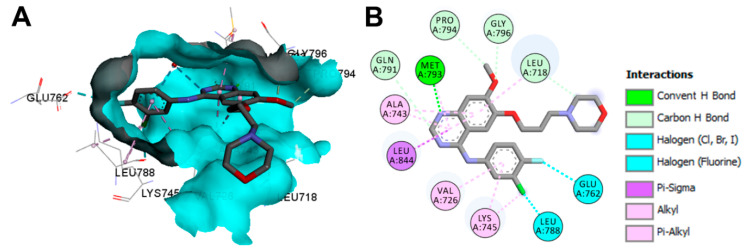
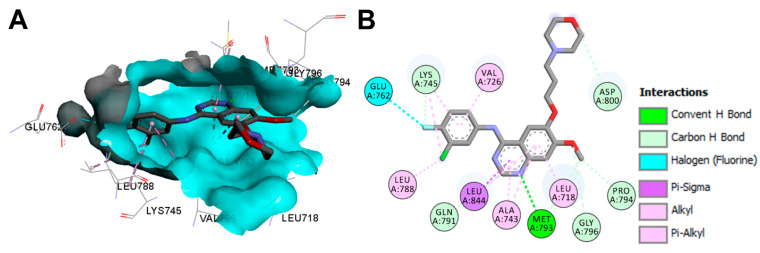
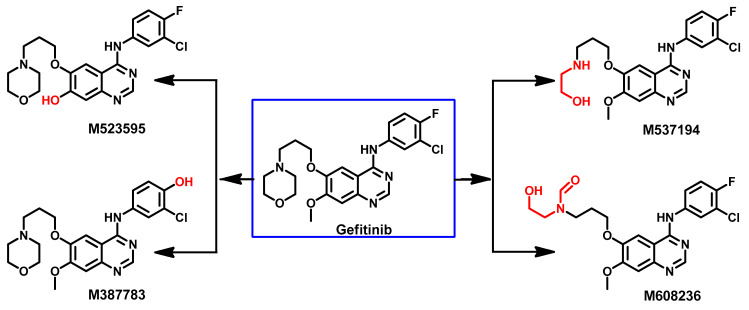
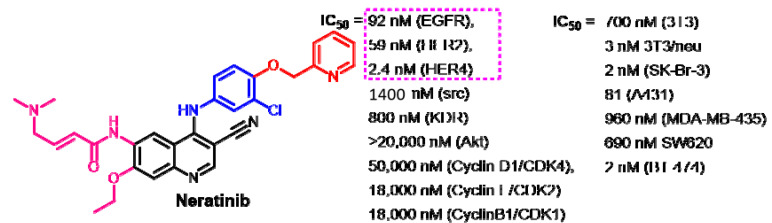
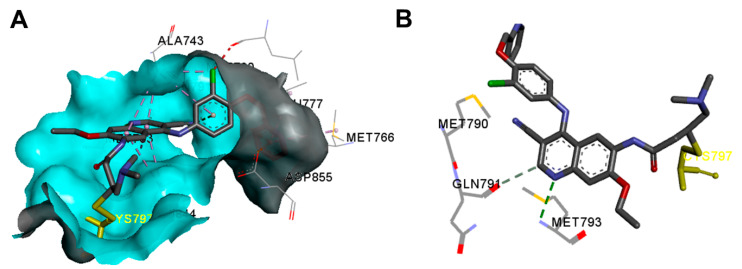
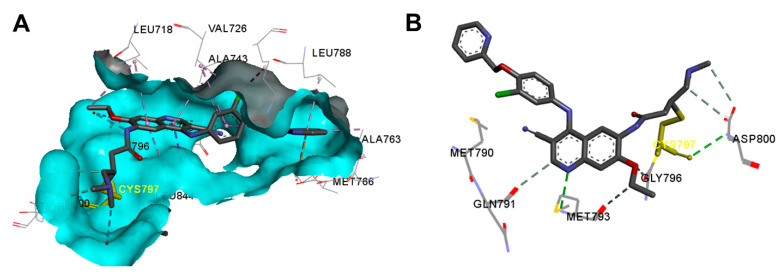
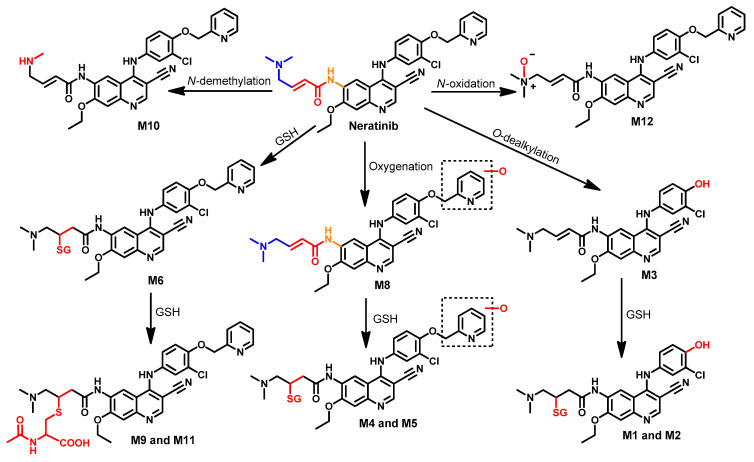
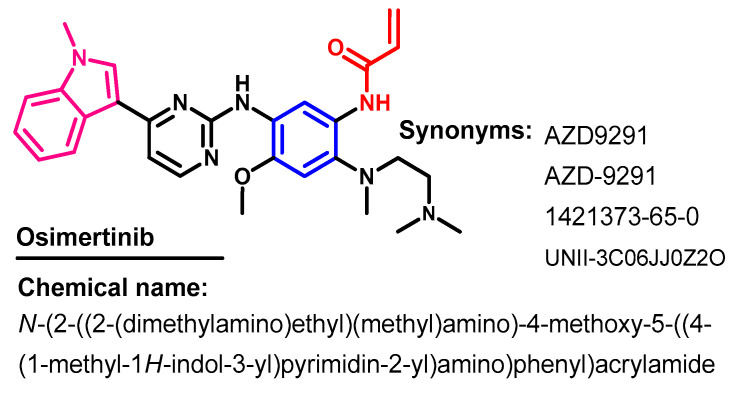
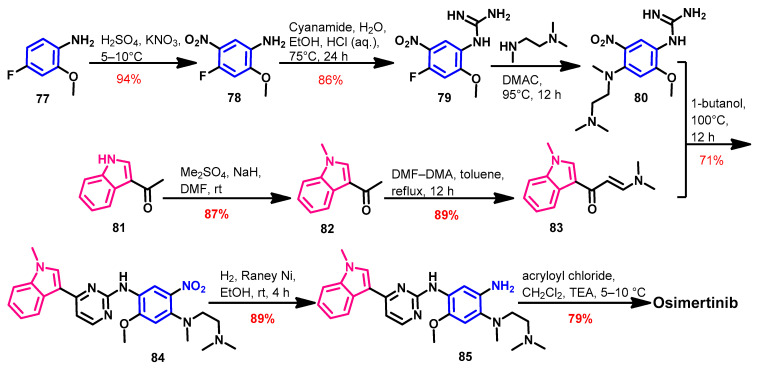
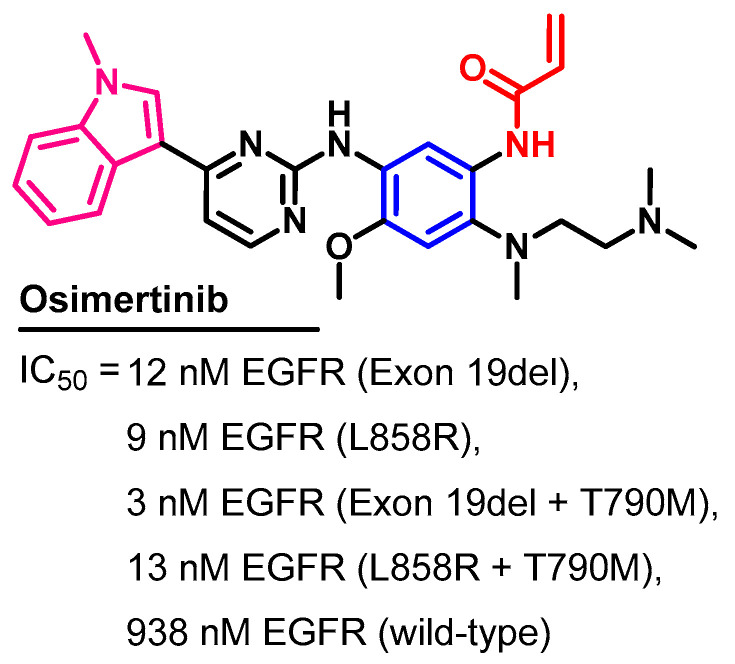
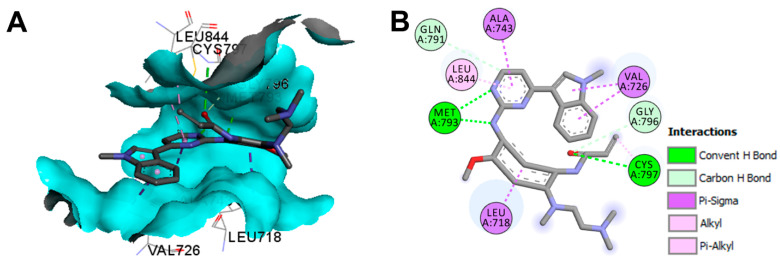
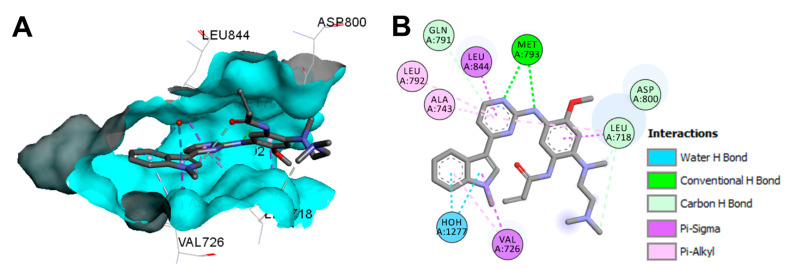
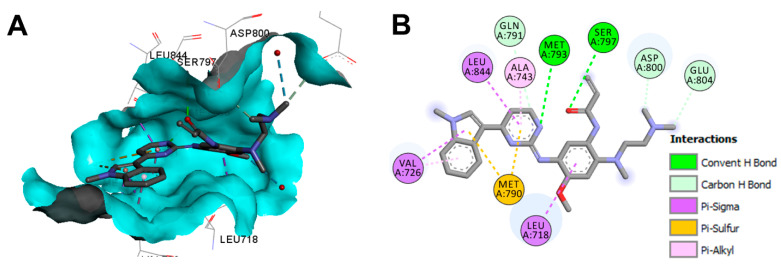
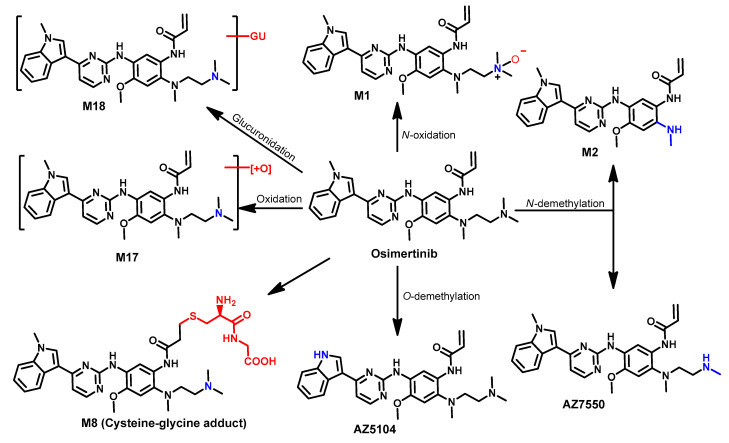
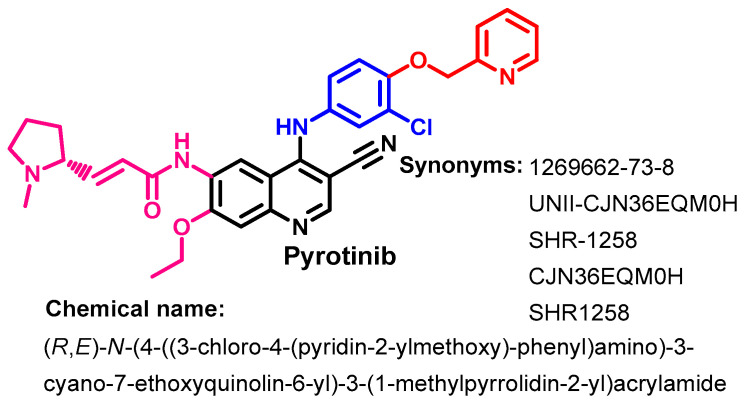
Targeting the EGFR with small-molecule inhibitors is a confirmed valid strategy in cancer therapy. Since the FDA approval of the first EGFR-TKI, erlotinib, great efforts have been devoted to the discovery of new potent inhibitors. Until now, fourteen EGFR small-molecule inhibitors have been globally approved for the treatment of different types of cancers. Although these drugs showed high efficacy in cancer therapy, EGFR mutations have emerged as a big challenge for these drugs. In this review, we focus on the EGFR small-molecule inhibitors that have been approved for clinical uses in cancer therapy. These drugs are classified based on their chemical structures, target kinases, and pharmacological uses. The synthetic routes of these drugs are also discussed. The crystal structures of these drugs with their target kinases are also summarized and their bonding modes and interactions are visualized. Based on their binding interactions with the EGFR, these drugs are also classified into reversible and irreversible inhibitors. The cytotoxicity of these drugs against different types of cancer cell lines is also summarized. In addition, the proposed metabolic pathways and metabolites of the fourteen drugs are discussed, with a primary focus on the active and reactive metabolites. Taken together, this review highlights the syntheses, target kinases, crystal structures, binding interactions, cytotoxicity, and metabolism of the fourteen globally approved EGFR inhibitors. These data should greatly help in the design of new EGFR inhibitors.

Keywords: EGFR; anticancer; kinase inhibitor; metabolism; synthesis.


Conflict of interest statement

Authors declare that there is no conflict of interest and have approved the manuscript.

Figures

Figure 1
Figure 1
Diagram of the EGFR receptor and the signaling cascade: AKT, protein kinase B; EGF, epidermal growth factor; EGFR, EGF receptor; ERK, extracellular signal-related kinase; GRB2, growth factor receptor-bound protein-2; MEK, mitogen-activated protein kinase-ERK kinase; mTOR, mammalian target of rapamycin; P13K, phosphatidylinositol 3-kinase; SOS, son of sevenless; STATs, signal transducers and activators of transcription; TGF-α, tumor growth factor-α.
Figure 2
Figure 2
Wild-type EGFR bound to AMPPNP (pdb: 3VJO): (A) 3D binding mode of AMPPNP, receptor shown as hydrogen bond surface; (B) 2D binding mode showing different types of interactions; the figure was generated using BIOVIA Discovery Studio Visualizer (V16.1.0.15350).
Figure 3
Figure 3
Chemical structure of the approved EGFR inhibitors.
Figure 4
Figure 4
Chemical classification of EGFR-TKIs.
Figure 5
Figure 5
Classification of EGFR-TKIs based on the nature of inhibition of EGFR.
Figure 6
Figure 6
First-, second-, and third-generation EGFR-TKIs and the multi-targeting inhibitors.
Figure 7
Figure 7
Chemical structure/name/synonyms of afatinib.
Scheme 1
Scheme 1
Synthesis route of afatinib.
Figure 8
Figure 8
Kinase inhibitory activities of afatinib.
Figure 9
Figure 9
Binding modes of afatinib (shown as sticks) into EGFR kinase (4G5J): (A) 3D binding mode, receptor shown as hydrogen bond surface; (B) 2D binding mode showing the covalent bond with Cys797 and the hydrogen bond interactions; the figure was generated using Discovery Studio Visualizer (V16.1.0.15350).
Figure 10
Figure 10
Binding modes of afatinib (shown as sticks) into EGFR kinase T790M (4G5P): (A) 3D binding mode, receptor shown as hydrogen bond surface; (B) 2D binding mode showing the covalent bond with Cys797 and the hydrogen bond interactions; the figure was generated using Discovery Studio Visualizer (V16.1.0.15350).
Figure 11
Figure 11
Mechanism of the irreversible inhibition of EGFR by afatinib.
Figure 12
Figure 12
The main metabolic pathway of afatinib.
Figure 13
Figure 13
Chemical structure/name/synonyms of almonertinib.
Scheme 2
Scheme 2
Synthesis of almonertinib; yield% was rounded up to the nearest integer.
Figure 14
Figure 14
Kinases inhibitory activities of almonertinib.
Figure 15
Figure 15
Proposed metabolic pathways of almonertinib.
Figure 16
Figure 16
Chemical structure/name/synonyms of brigatinib.
Scheme 3
Scheme 3
Synthesis of brigatinib.
Figure 17
Figure 17
Kinase inhibitory activities of brigatinib.
Figure 18
Figure 18
Binding modes of brigatinib (shown as sticks) into EGFR C797S (pdb: 7AEM): (A) 3D binding mode, receptor shown as hydrogen bond surface; (B) 2D binding mode showing different types of binding interactions; the figure was generated using Discovery Studio Visualizer (V16.1.0.15350).
Figure 19
Figure 19
Binding modes of brigatinib (shown as sticks) into ALK (pdb: 6MX8): (A) 3D binding mode; (B) 2D binding mode showing different types of binding interactions; the figure was generated using Discovery Studio Visualizer (V16.1.0.15350).
Figure 20
Figure 20
The proposed metabolic pathways and metabolites of brigatinib. The nitrile products, BGB609, BGB623, and BGB527, are KCN addition products that indicate the formation of the reactive iminium ion intermediates.
Figure 21
Figure 21
Chemical structure/name/synonyms of dacomitinib.
Scheme 4
Scheme 4
Synthesis of dacomitinib. T3P, 1-propanephosphonic acid cyclic anhydride.
Figure 22
Figure 22
Kinase inhibitory activities of dacomitinib.
Figure 23
Figure 23
Binding modes of dacomitinib (shown as sticks) into T790M EGFR kinase domain (pdb: 4I24): (A) 3D binding mode, receptor shown as hydrogen bond surface; (B) 2D binding mode showing different types of binding interactions; the figure was generated using Discovery Studio Visualizer (V16.1.0.15350).
Figure 24
Figure 24
The proposed metabolic pathways of dacomitinib. The nitrile product is a KCN addition product that indicates the formation of the reactive iminium ion intermediate.
Figure 25
Figure 25
Chemical structure/name/synonyms of erlotinib.
Scheme 5
Scheme 5
Synthesis of erlotinib.
Figure 26
Figure 26
Kinase inhibitory activities of erlotinib.
Figure 27
Figure 27
Binding modes of erlotinib (shown as sticks) into wild-type EGFR (pdb: 1M17): (A) 3D binding mode, receptor shown as hydrogen bond surface; (B) 2D binding mode showing different types of binding interactions; the figure was generated using Discovery Studio Visualizer (V16.1.0.15350).
Figure 28
Figure 28
Binding modes of erlotinib (shown as sticks) into the inactive EGFR (pdb: 4HJO): (A) 3D binding mode, receptor shown as hydrogen bond surface; (B) 2D binding mode showing different types of binding interactions; the figure was generated using Discovery Studio Visualizer (V16.1.0.15350).
Figure 29
Figure 29
Proposed metabolic pathways of erlotinib in human.
Figure 30
Figure 30
Chemical structure/name/synonyms of afatinib.
Scheme 6
Scheme 6
Synthesis of gefitinib.
Figure 31
Figure 31
Kinase inhibitory activities of gefitinib.
Figure 32
Figure 32
Binding modes of gefitinib (shown as sticks) into EGFR kinase domain (pdb: 2ITY): (A) 3D binding mode, receptor shown as hydrogen bond surface; (B) 2D binding mode showing different types of binding interactions; the figure was generated using Discovery Studio Visualizer (V16.1.0.15350).
Figure 33
Figure 33
Binding modes of gefitinib (shown as sticks) into EGFR kinase domain L858R mutation (pdb: 2ITZ): (A) 3D binding mode, receptor shown as hydrogen bond surface; (B) 2D binding mode showing different types of binding interactions; the figure was generated using Discovery Studio Visualizer (V16.1.0.15350).
Figure 34
Figure 34
Proposed metabolic pathways of gefitinib.
Figure 35
Figure 35
Proposed metabolic pathways of gefitinib.
Figure 36
Figure 36
Chemical structure/name/synonyms of icotinib.
Scheme 7
Scheme 7
Synthesis of icotinib.
Figure 37
Figure 37
Kinase inhibitory activity of icotinib.
Figure 38
Figure 38
Proposed metabolic pathways of icotinib by human liver microsomes.
Figure 39
Figure 39
Chemical structure/name/synonyms of icotinib.
Scheme 8
Scheme 8
Synthesis of lapatinib ditosylate monohydrate.
Figure 40
Figure 40
Kinases inhibitory activities of lapatinib.
Figure 41
Figure 41
Binding modes of lapatinib (shown as sticks) into EGFR kinase domain (pdb: 1XKK): (A) 3D binding mode, receptor shown as hydrogen bond surface; (B) 2D binding mode showing different types of binding interactions; the figure was generated using Discovery Studio Visualizer (V16.1.0.15350).
Figure 42
Figure 42
Proposed metabolic pathways of lapatinib.
Figure 43
Figure 43
Chemical structure/name/synonyms of neratinib.
Scheme 9
Scheme 9
Synthesis of neratinib using Wittig–Horner reaction.
Figure 44
Figure 44
Kinase inhibitory activities of neratinib against selected kinases and cancer cell lines.
Figure 45
Figure 45
Binding modes of neratinib (shown as sticks) into EGFR kinase domain T790M mutation (pdb: 2JIV): (A) 3D binding mode, receptor shown as hydrogen bond surface; (B) 2D binding mode showing the covalent bond with Cys797 and the hydrogen bond interactions; the figure was generated using Discovery Studio Visualizer (V16.1.0.15350).
Figure 46
Figure 46
Binding modes of neratinib (shown as sticks) into EGFR kinase domain T790M/L858R mutant (pdb: 3W2Q): (A) 3D binding mode, receptor shown as hydrogen bond surface; (B) 2D binding mode showing the covalent bond with Cys797 (yellow sticks) and the hydrogen bond interactions; the figure was generated using Discovery Studio Visualizer (V16.1.0.15350).
Figure 47
Figure 47
Proposed metabolic pathways of neratinib.
Figure 48
Figure 48
Chemical structure/name/synonyms of olmutinib.
Scheme 10
Scheme 10
Synthesis of olmutinib.
Figure 49
Figure 49
Kinases inhibitory activities of olmutinib.
Figure 50
Figure 50
Proposed phase I metabolic pathways of olmutinib.
Figure 51
Figure 51
Chemical structure, name, and synonyms of osimertinib.
Scheme 11
Scheme 11
Synthesis of osimertinib.
Figure 52
Figure 52
Kinase inhibitory activity (IC50 values) of osimertinib.
Figure 53
Figure 53
Binding modes of osimertinib (shown as sticks) into the wild-type EGFR kinase (pdb: 4ZAU): (A) 3D binding mode, receptor shown as hydrogen bond surface; (B) 2D binding mode showing different types of binding interactions; the figure was generated using Discovery Studio Visualizer (V16.1.0.15350).
Figure 54
Figure 54
Binding modes of osimertinib (shown as sticks) into EGFR 696-1022 T790M (pdb: 6JX0): (A) 3D binding mode, receptor shown as hydrogen bond surface; (B) 2D binding mode showing different types of binding interactions; the figure was generated using Discovery Studio Visualizer (V16.1.0.15350).
Figure 55
Figure 55
Binding modes of osimertinib (shown as sticks) into EGFR L858R/T790M/C797S (pdb: 6LUD): (A) 3D binding mode, receptor shown as hydrogen bond surface; (B) 2D binding mode showing different types of binding interactions; the figure was generated using Discovery Studio Visualizer (V16.1.0.15350).
Figure 56
Figure 56
Proposed metabolic pathways of osimertinib.
Figure 57
Figure 57
Chemical structure, name, and synonyms of pyrotinib.
Scheme 12
Scheme 12
Synthesis of pyrotinib; yield% was rounded up to the nearest integer.
Figure 58
Figure 58
Kinase inhibitory activities of pyrotinib and its principal metabolites (M1, M2, and M5).
Figure 59
Figure 59
The proposed metabolic pathways of pyrotinib.
Figure 60
Figure 60
General structure of [14C] pyrotinib plasma protein adducts showing the proposed fragmentation pathway and sites of cleavage; AA, amino acid.
Figure 61
Figure 61
Chemical structure/name/synonyms of simotinib.
Scheme 13
Scheme 13
Synthesis of simotinib.
Figure 62
Figure 62
Chemical structure/name/synonyms of vandetanib.
Scheme 14
Scheme 14
Synthesis of vandetanib.
Figure 63
Figure 63
Kinase inhibitory activity of vandetanib.
Figure 64
Figure 64
Two/three-dimensional binding mode of vandetanib (ZD6, pdb: 2IVU) bound to the phosphorylated RET tyrosine kinase domain: (A) 3D binding mode, receptor shown as hydrogen bond surface; (B) 2D binding mode of vandetanib showing different types of interaction with amino acids in RET; the figure was generated using Discovery Studio Visualizer (V16.1.0.15350).
Figure 65
Figure 65
Proposed metabolic pathways of vandetanib in healthy subjects.
Figure 66
Figure 66
Proposed metabolic pathways of vandetanib (in vitro and in vivo).

References

    1. Herbst R.S. Review of epidermal growth factor receptor biology. Int. J. Radiat. Oncol. Biol. Phys. 2004;59:21–26. doi: 10.1016/j.ijrobp.2003.11.041. - DOI - PubMed
    1. Lee N.Y., Hazlett T.L., Koland J.G. Structure and dynamics of the epidermal growth factor receptor C-terminal phosphorylation domain. Protein Sci. 2006;15:1142–1152. doi: 10.1110/ps.052045306. - DOI - PMC - PubMed
    1. Xu N., Fang W., Mu L., Tang Y., Gao L., Ren S., Cao D., Zhou L., Zhang A., Liu D., et al. Overexpression of wildtype EGFR is tumorigenic and denotes a therapeutic target in non-small cell lung cancer. Oncotarget. 2016;7:3884–3896. doi: 10.18632/oncotarget.6461. - DOI - PMC - PubMed
    1. Sigismund S., Avanzato D., Lanzetti L. Emerging functions of the EGFR in cancer. Mol. Oncol. 2018;12:3–20. doi: 10.1002/1878-0261.12155. - DOI - PMC - PubMed
    1. Vallbohmer D., Lenz H.-J. Epidermal growth factor receptor as a target for chemotherapy. Clin. Colorectal Cancer. 2005;5((Suppl. 1)):S19–S27. doi: 10.3816/CCC.2005.s.003. - DOI - PubMed

MeSH terms