

Skin Lesion Classification Based on Surface Fractal Dimensions and Statistical Color Cluster Features Using an Ensemble of Machine Learning Techniques
- PMID: 34771421
- PMCID: PMC8582408
- DOI: 10.3390/cancers13215256
Skin Lesion Classification Based on Surface Fractal Dimensions and Statistical Color Cluster Features Using an Ensemble of Machine Learning Techniques
Abstract
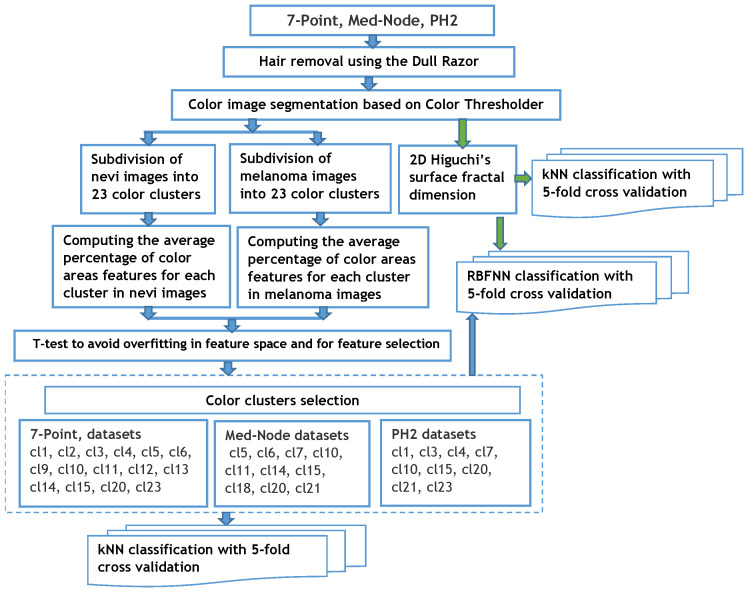
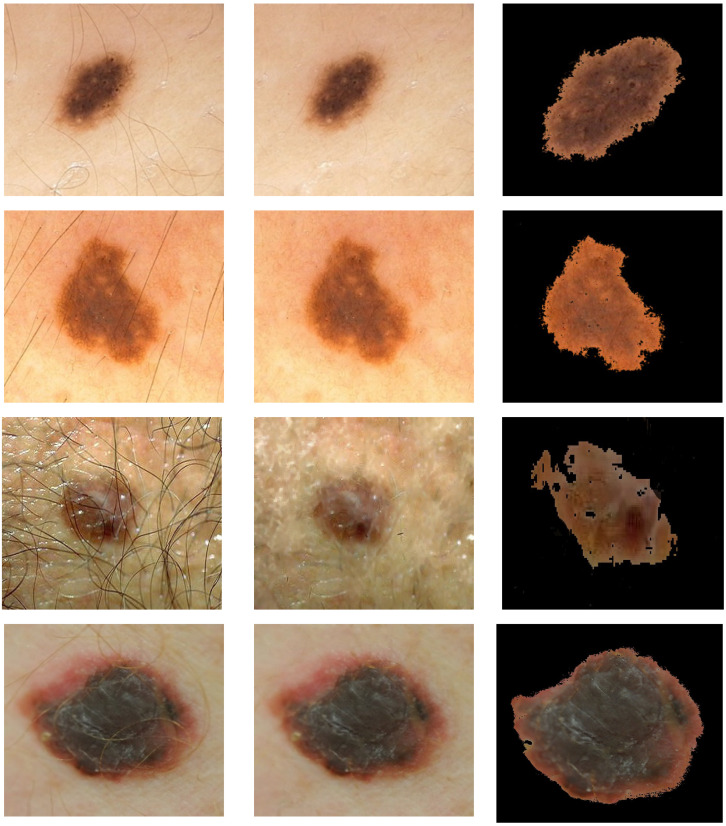
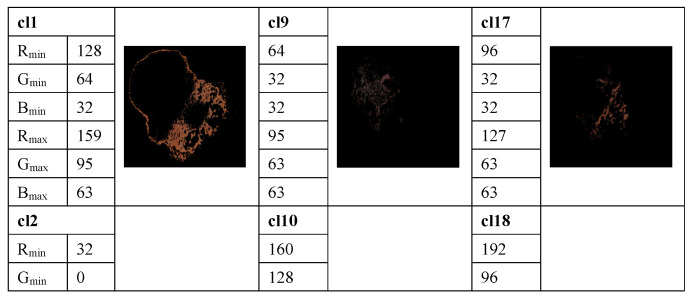
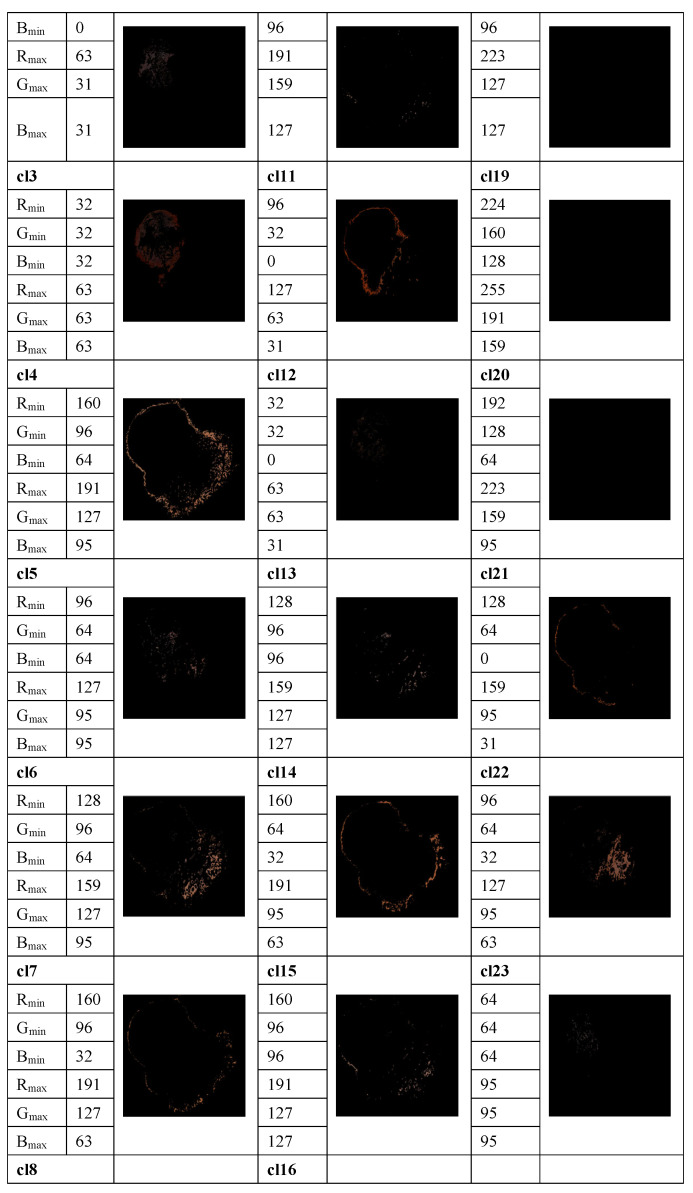
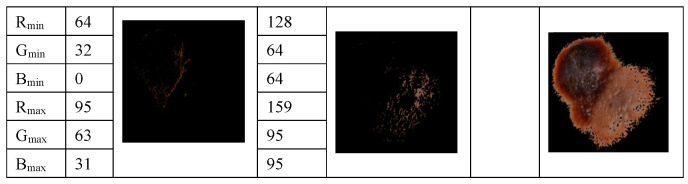
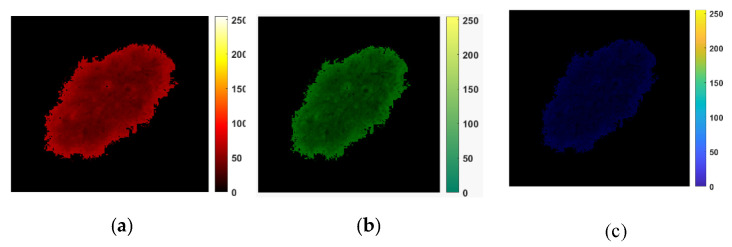
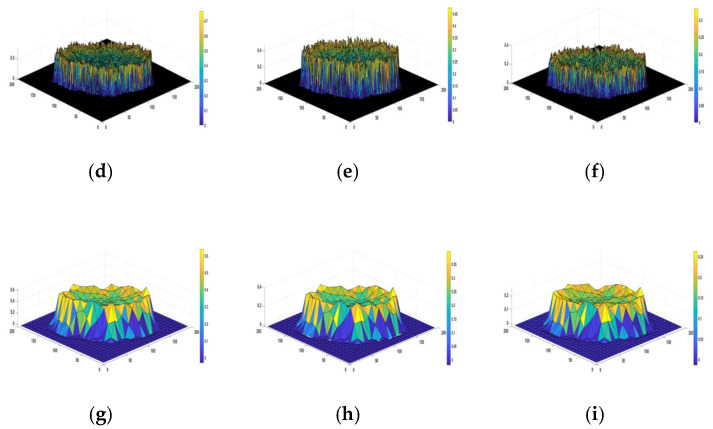
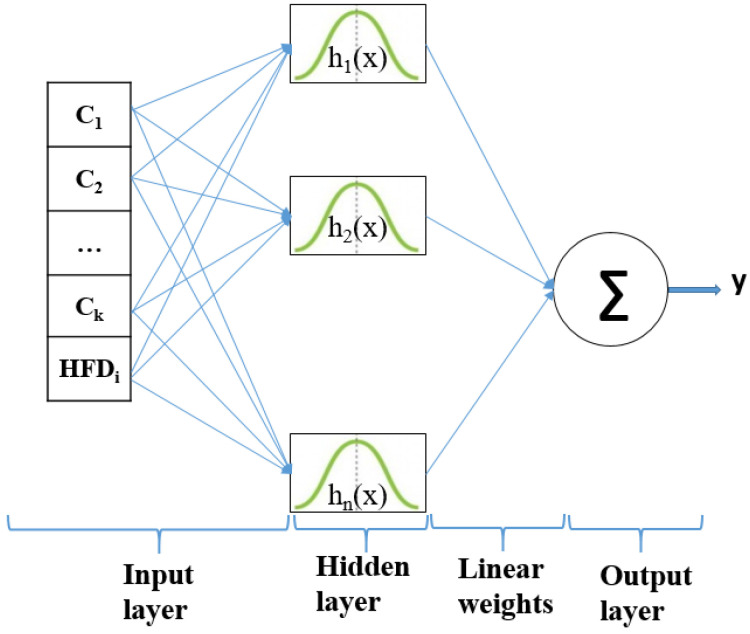
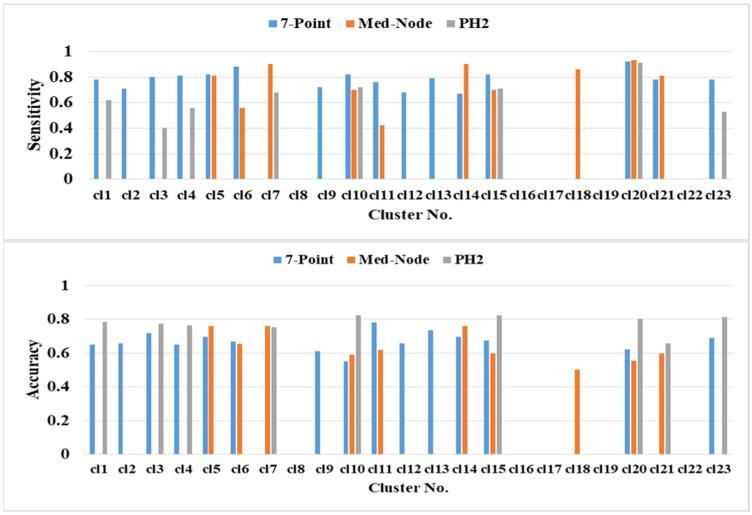
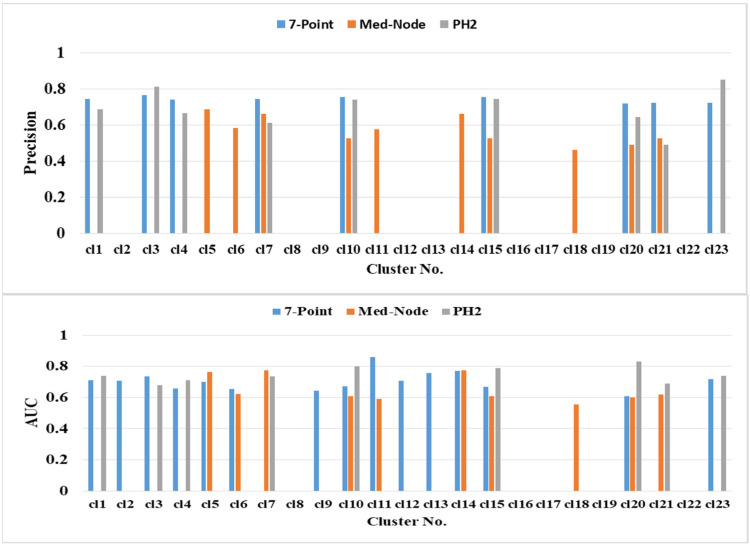
(1) Background: An approach for skin cancer recognition and classification by implementation of a novel combination of features and two classifiers, as an auxiliary diagnostic method, is proposed. (2) Methods: The predictions are made by k-nearest neighbor with a 5-fold cross validation algorithm and a neural network model to assist dermatologists in the diagnosis of cancerous skin lesions. As a main contribution, this work proposes a descriptor that combines skin surface fractal dimension and relevant color area features for skin lesion classification purposes. The surface fractal dimension is computed using a 2D generalization of Higuchi's method. A clustering method allows for the selection of the relevant color distribution in skin lesion images by determining the average percentage of color areas within the nevi and melanoma lesion areas. In a classification stage, the Higuchi fractal dimensions (HFDs) and the color features are classified, separately, using a kNN-CV algorithm. In addition, these features are prototypes for a Radial basis function neural network (RBFNN) classifier. The efficiency of our algorithms was verified by utilizing images belonging to the 7-Point, Med-Node, and PH2 databases; (3) Results: Experimental results show that the accuracy of the proposed RBFNN model in skin cancer classification is 95.42% for 7-Point, 94.71% for Med-Node, and 94.88% for PH2, which are all significantly better than that of the kNN algorithm. (4) Conclusions: 2D Higuchi's surface fractal features have not been previously used for skin lesion classification purpose. We used fractal features further correlated to color features to create a RBFNN classifier that provides high accuracies of classification.
Keywords: Higuchi fractal dimensions; Radial basis function neural network; k-nearest neighbor; skin cancer recognition.
Conflict of interest statement
The authors declare no conflict of interest.
Figures
Similar articles
-
Integration of morphological preprocessing and fractal based feature extraction with recursive feature elimination for skin lesion types classification.Comput Methods Programs Biomed. 2019 Sep;178:201-218. doi: 10.1016/j.cmpb.2019.06.018. Epub 2019 Jun 16. Comput Methods Programs Biomed. 2019. PMID: 31416550
-
Deep Learning Based Skin Lesion Segmentation and Classification of Melanoma Using Support Vector Machine (SVM).Asian Pac J Cancer Prev. 2019 May 25;20(5):1555-1561. doi: 10.31557/APJCP.2019.20.5.1555. Asian Pac J Cancer Prev. 2019. PMID: 31128062 Free PMC article.
-
Computer-assisted lip diagnosis on Traditional Chinese Medicine using multi-class support vector machines.BMC Complement Altern Med. 2012 Aug 16;12:127. doi: 10.1186/1472-6882-12-127. BMC Complement Altern Med. 2012. PMID: 22898352 Free PMC article.
-
K-complexes Detection in EEG Signals using Fractal and Frequency Features Coupled with an Ensemble Classification Model.Neuroscience. 2019 Dec 1;422:119-133. doi: 10.1016/j.neuroscience.2019.10.034. Epub 2019 Nov 1. Neuroscience. 2019. PMID: 31682947
-
Deep Learning Approaches Towards Skin Lesion Segmentation and Classification from Dermoscopic Images - A Review.Curr Med Imaging. 2020;16(5):513-533. doi: 10.2174/1573405615666190129120449. Curr Med Imaging. 2020. PMID: 32484086 Review.
Cited by
-
A Workflow for Computer-Aided Evaluation of Keloid Based on Laser Speckle Contrast Imaging and Deep Learning.J Pers Med. 2022 Jun 16;12(6):981. doi: 10.3390/jpm12060981. J Pers Med. 2022. PMID: 35743764 Free PMC article.
-
Enhanced detonators detection in X-ray baggage inspection by image manipulation and deep convolutional neural networks.Sci Rep. 2023 Aug 31;13(1):14262. doi: 10.1038/s41598-023-41651-y. Sci Rep. 2023. PMID: 37653113 Free PMC article.
-
Fractal Dimension Analysis of Melanocytic Nevi and Melanomas in Normal and Polarized Light-A Preliminary Report.Life (Basel). 2022 Jul 7;12(7):1008. doi: 10.3390/life12071008. Life (Basel). 2022. PMID: 35888097 Free PMC article.
-
Alzheimer's disease: new insight in assessing of amyloid plaques morphologies using multifractal geometry based on Naive Bayes optimized by random forest algorithm.Sci Rep. 2023 Oct 30;13(1):18568. doi: 10.1038/s41598-023-45972-w. Sci Rep. 2023. PMID: 37903890 Free PMC article.
-
AI in dermatology: a comprehensive review into skin cancer detection.PeerJ Comput Sci. 2024 Dec 5;10:e2530. doi: 10.7717/peerj-cs.2530. eCollection 2024. PeerJ Comput Sci. 2024. PMID: 39896358 Free PMC article.
References
-
- Australian Government Melanoma of the Skin Statistics. [(accessed on 29 March 2019)]; Available online: https://melanoma.canceraustralia.gov.au/statistics.
LinkOut - more resources
Full Text Sources
Research Materials
