. 2021 Oct 23;13(21):5323.
doi: 10.3390/cancers13215323.

Predict Early Recurrence of Resectable Hepatocellular Carcinoma Using Multi-Dimensional Artificial Intelligence Analysis of Liver Fibrosis

Affiliations

Predict Early Recurrence of Resectable Hepatocellular Carcinoma Using Multi-Dimensional Artificial Intelligence Analysis of Liver Fibrosis

I-Ting Liu et al. Cancers (Basel). .

Abstract

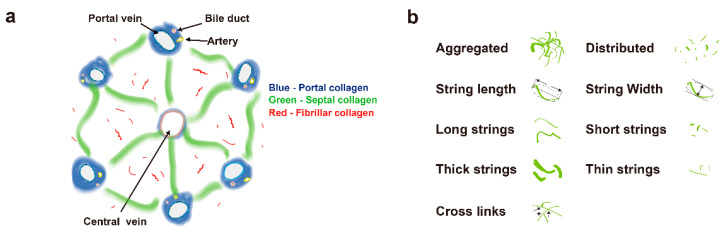
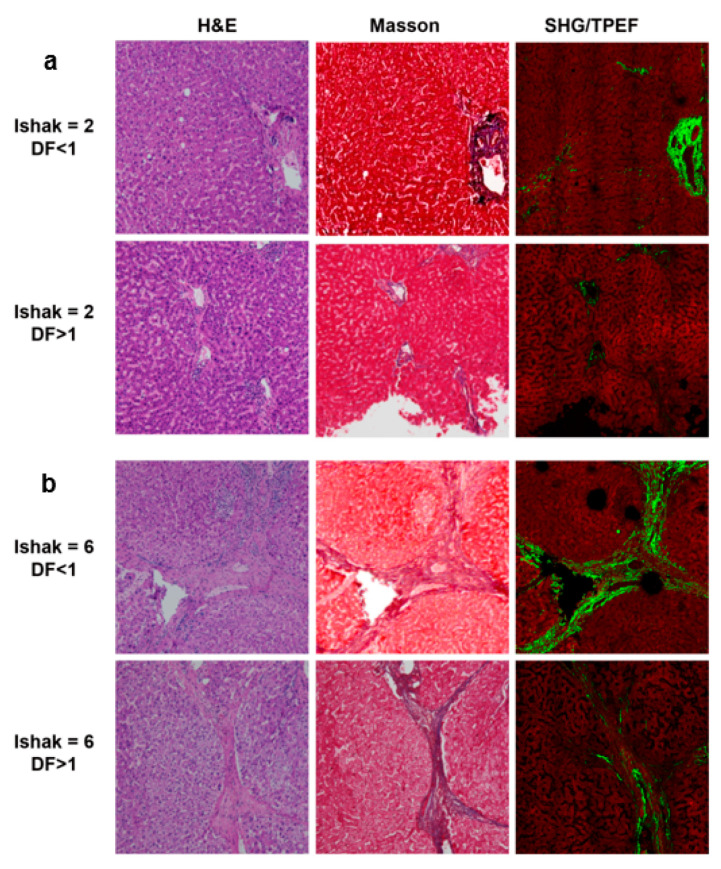
Background: Liver fibrosis is thought to be associated with early recurrence of hepatocellular carcinoma (HCC) after resection. To recognize HCC patients with higher risk of early recurrence, we used a second harmonic generation and two-photon excitation fluorescence (SHG/TPEF) microscopy to create a fully quantitative fibrosis score which is able to predict early recurrence.

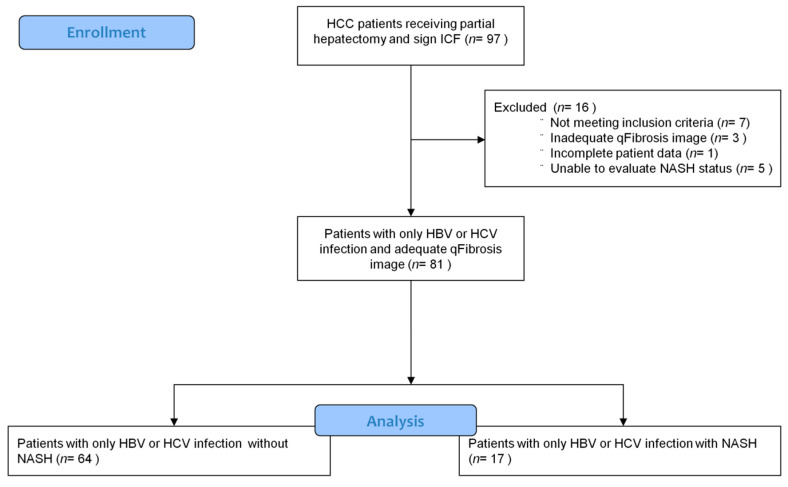
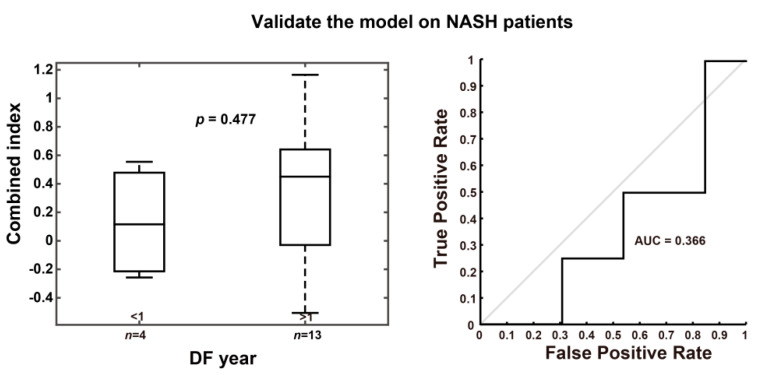
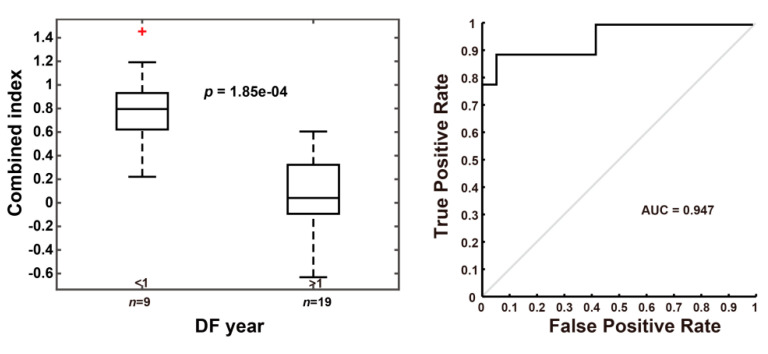
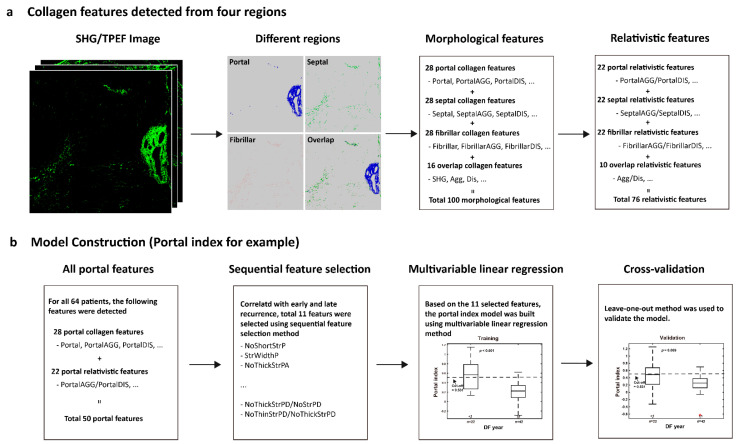
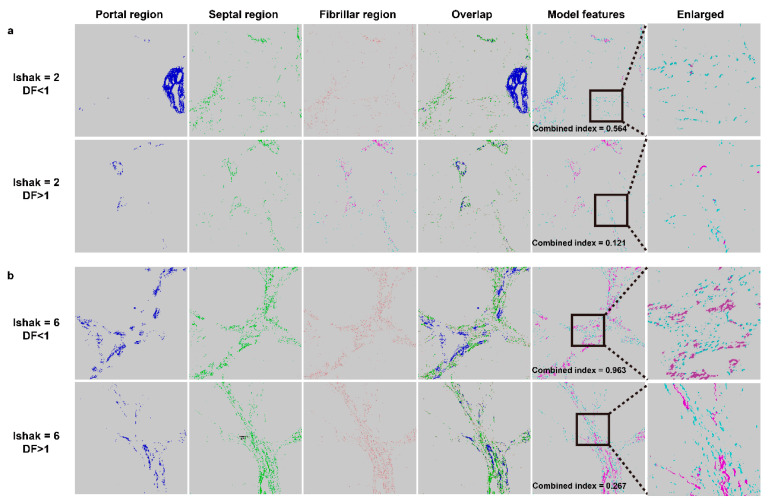
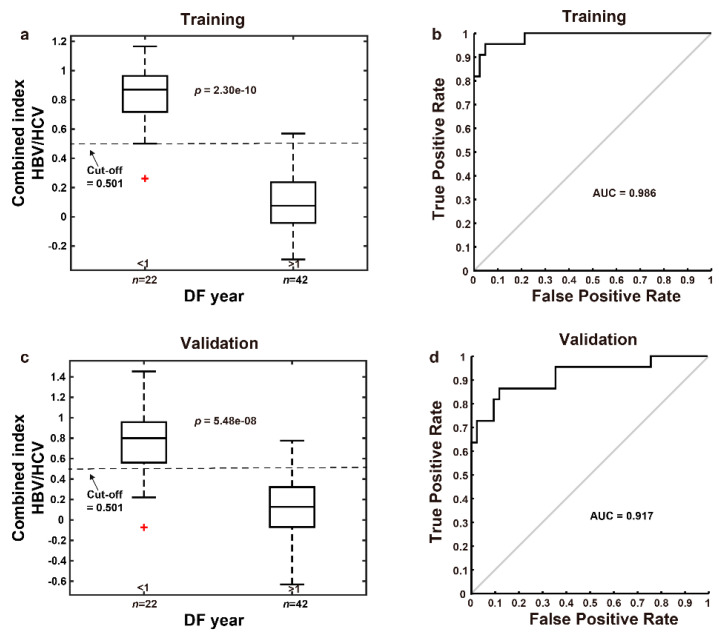
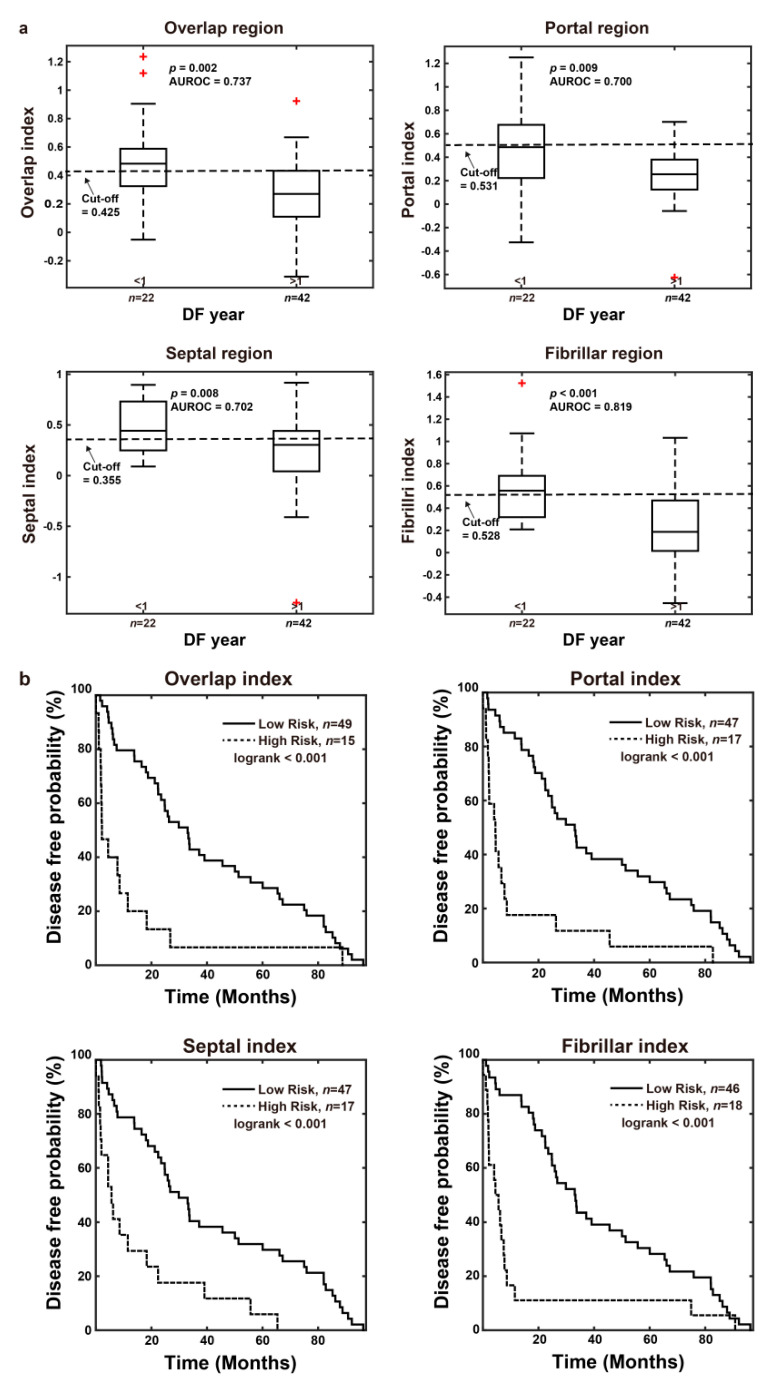
Methods: The study included 81 HCC patients receiving curative intent hepatectomy. Detailed fibrotic features of resected hepatic tissues were obtained by SHG/TPEF microscopy, and we used multi-dimensional artificial intelligence analysis to create a recurrence prediction model "combined index" according to the morphological collagen features of each patient's non-tumor hepatic tissues.

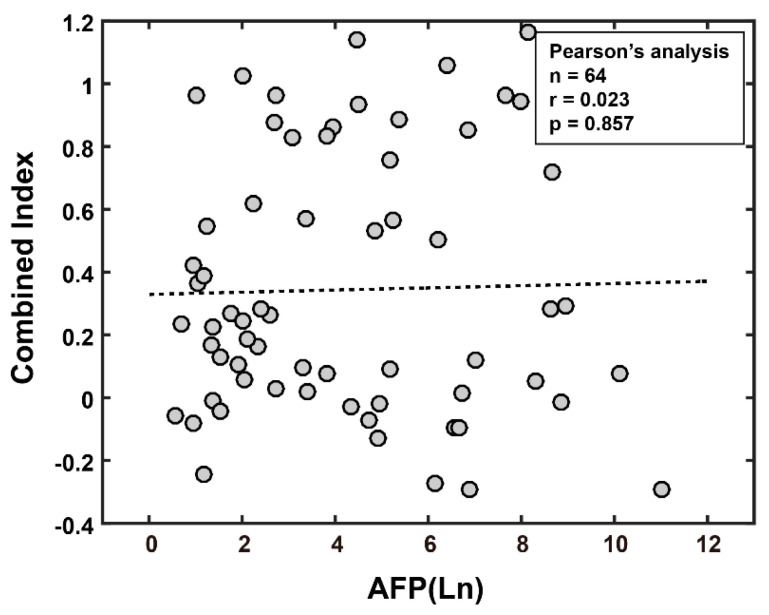
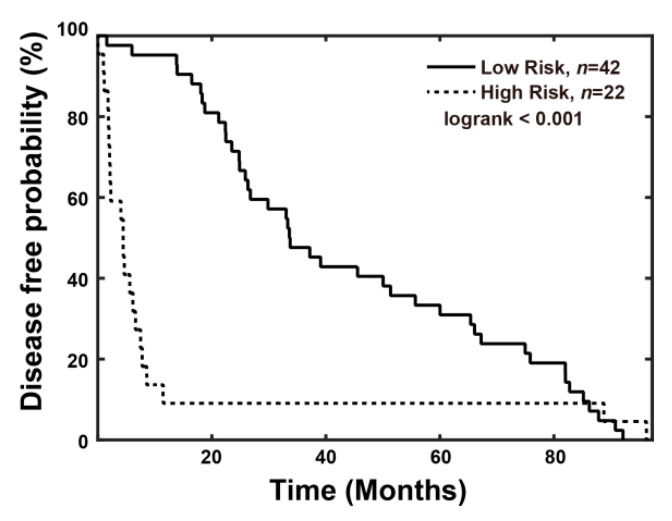
Results: Our results showed that the "combined index" can better predict early recurrence (area under the curve = 0.917, sensitivity = 81.8%, specificity = 90.5%), compared to alpha fetoprotein level (area under the curve = 0.595, sensitivity = 68.2%, specificity = 47.6%). Using a Cox proportional hazards analysis, a higher "combined index" is also a poor prognostic factor of disease-free survival and overall survival.

Conclusions: By integrating multi-dimensional artificial intelligence and SHG/TPEF microscopy, we may locate patients with a higher risk of recurrence, follow these patients more carefully, and conduct further management if needed.

Keywords: SHG/TPEF microscopy; artificial intelligence; hepatocellular carcinoma; liver fibrosis; recurrence.


Conflict of interest statement

The authors declare no conflict of interest. The funders had no role in the design of the study; in the collection, analyses, or interpretation of data; in the writing of the manuscript, or in the decision to publish the results.

Figures

Figure A1
Figure A1
Flowchart for patient enrollment (ICF: Informed Consent Form).
Figure A2
Figure A2
ROC curves for the prediction of early recurrence versus late recurrence for NASH patients.
Figure A3
Figure A3
ROC curves for the prediction of early recurrence versus late recurrence for cirrhosis patients. Note: The red plus sign represents outlier.
Figure A4
Figure A4
Correlation of AFP level and combined index. In patients after hepatectomy, there is poor correlation shown between the AFP level and combined index as determined with a Pearson’s analysis.
Figure 1
Figure 1
Schematic illustration of the studied collagen features for the prediction of early recurrence. (a) Representation of collagen in portal, septal, and fibrillar regions, which are denoted in blue, green, and red, respectively. (b) Representation of some features of collagen strings.
Figure 2
Figure 2
Flowchart of model construction. (a) Total 100 morphological features were detected from portal, septal, fibrillar, and overlap regions. Another 76 relativistic features were constructed based on the morphological features. (b) The method of portal index is for example. Sequential feature selection method was performed to reduce the dimensionality of data by selecting only a subset of collagen features. A total of 11 features were selected to build the model using multivariable linear regression method. To validate the prediction model, leave-one-out cross-validation method was used. The methods for septa index, fibrillar index, overlap index, and combined index are similar. For combined index, a total of 18 features were selected from 176 features to build the model.
Figure 3
Figure 3
H&E staining, Masson staining, and SHG/TPEF images in the HCC liver samples. (a) Ishak score = 2, disease free (DF) < 1 year and > 1 year. (b) Ishak score = 6, DF <1 year and >1 year.
Figure 4
Figure 4
Examples of different collagen regions. (a) Ishak score = 2, disease free (DF) < 1 year and > 1 year. (b) Ishak score = 6, DF < 1 year and > 1 year. Overlap region includes three collagen patterns (portal/septal/fibrillar). Model features shows two collagen features including aggregated (purple color) and distributed (blue-green color) collagen in septal region used was for the combined index, which is to predict early recurrence in patients with hepatocellular carcinoma after curative hepatectomy.
Figure 5
Figure 5
ROC curves for the prediction of early recurrence versus late recurrence for the HBV or HCV patients without NASH. (a) A combined index cut-off value of 0.501 is capable of differentiating between early and late recurrence in the training group. (b) ROC curve for combined index showed great predictive value of early recurrence (AUC = 0.986) in the training group. (c) The predicted combined index values for 64 patients were calculated by leave-one-out cross-validation method. (d) ROC curve for the combined index predicted by leave-one-out cross-validation method showed great predictive value of early recurrence (AUC = 0.917). Note: The red plus sign represents outlier.
Figure 6
Figure 6
Disease-free probability analysis for HCC patients. A significant difference was noted between the high-risk group (combined-index > 0.501) and low risk group (combined-index ≤0.501) (n = 22 and 42, p < 0.001).
Figure 7
Figure 7
The prediction of early recurrence using features in the overlap, portal, septal, and fibrillar regions by leave-one-out cross-validation method. The features of non-tumor liver in these regions show poorer predictive ability compared with the combined index. (a) Box plots. The cut off values were determined by the training data (n = 64). (b) Disease-free probability analysis. The high-risk group and low risk group were separated by the corresponding cut-off value. Note: The red plus sign represents outlier.

References

    1. Bray F., Ferlay J., Soerjomataram I., Siegel R.L., Torre L.A., Jemal A. Global cancer statistics 2018: GLOBOCAN estimates of incidence and mortality worldwide for 36 cancers in 185 countries. CA Cancer J. Clin. 2018;68:394–424. doi: 10.3322/caac.21492. - DOI - PubMed
    1. Shao Y.-Y., Wang S.-Y., Lin S.-M., Chen K.-Y., Tseng J.-H., Ho M.-C., Lee R.-C., Liang P.-C., Liao L.-Y., Huang K.-W., et al. Management consensus guideline for hepatocellular carcinoma: 2020 update on surveillance, diagnosis, and systemic treatment by the Taiwan Liver Cancer Association and the Gastroenterological Society of Taiwan. J. Formos. Med Assoc. 2021;120:1051–1060. doi: 10.1016/j.jfma.2020.10.031. - DOI - PubMed
    1. Chen D.-S. Hepatocellular carcinoma in Taiwan. Hepatol. Res. 2007;37:S101–S105. doi: 10.1111/j.1872-034X.2007.00170.x. - DOI - PubMed
    1. Anstee Q.M., Reeves H.L., Kotsiliti E., Govaere O., Heikenwalder M. From NASH to HCC: Current concepts and future challenges. Nat. Rev. Gastroenterol. Hepatol. 2019;16:411–428. doi: 10.1038/s41575-019-0145-7. - DOI - PubMed
    1. Farazi P., DePinho R. Hepatocellular carcinoma pathogenesis: From genes to environment. Nat. Rev. Cancer. 2006;6:674–687. doi: 10.1038/nrc1934. - DOI - PubMed

LinkOut - more resources