. 2021 Oct 26;13(21):5350.
doi: 10.3390/cancers13215350.

Molecular Classification of Breast Cancer Utilizing Long Non-Coding RNA (lncRNA) Transcriptomes Identifies Novel Diagnostic lncRNA Panel for Triple-Negative Breast Cancer

Affiliations

Molecular Classification of Breast Cancer Utilizing Long Non-Coding RNA (lncRNA) Transcriptomes Identifies Novel Diagnostic lncRNA Panel for Triple-Negative Breast Cancer

Hibah Shaath et al. Cancers (Basel). .

Abstract

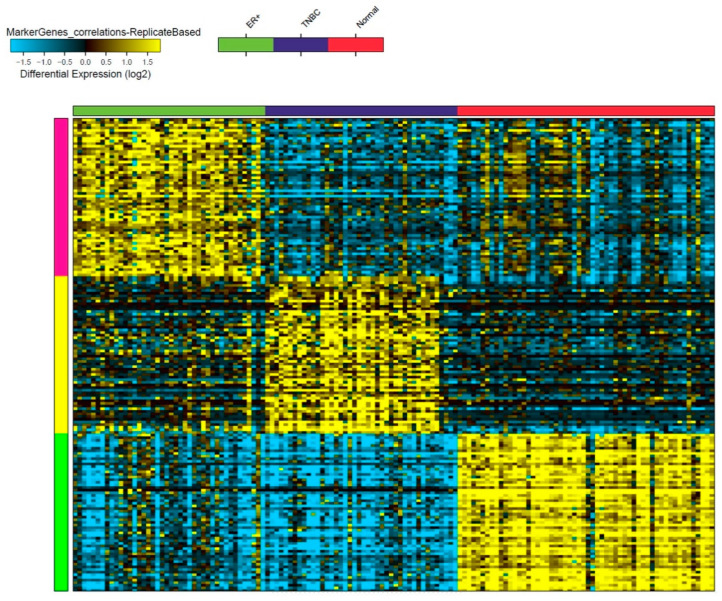
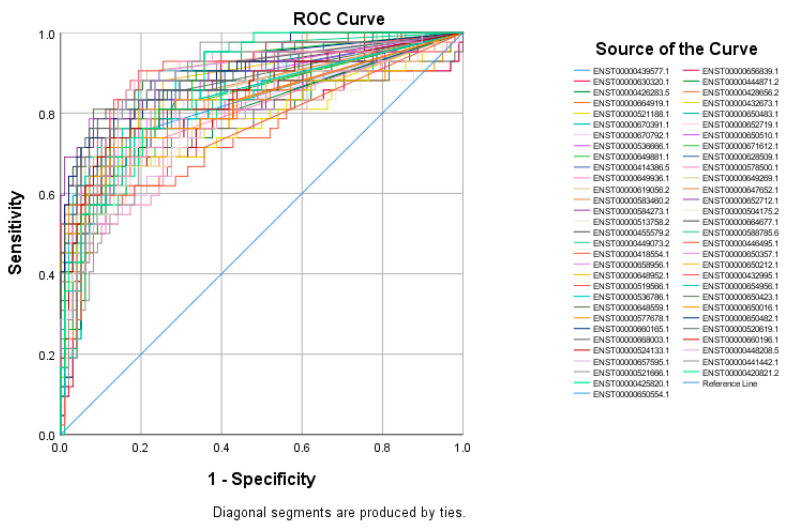
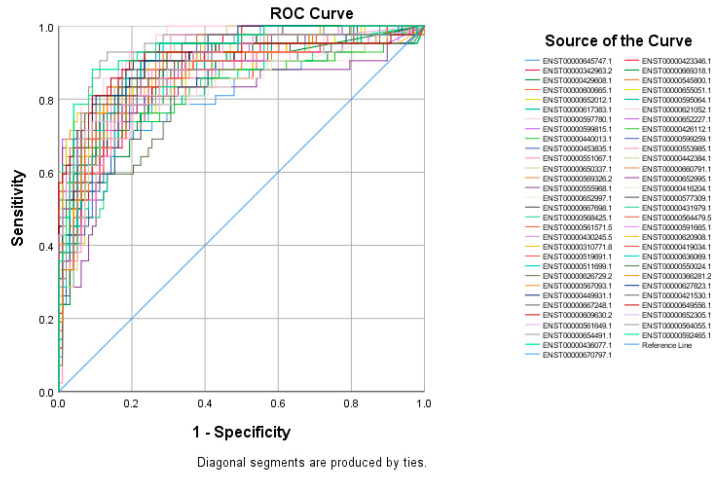
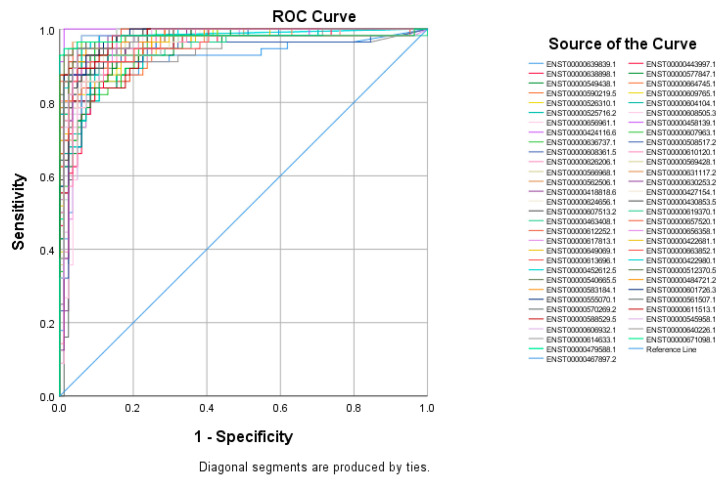
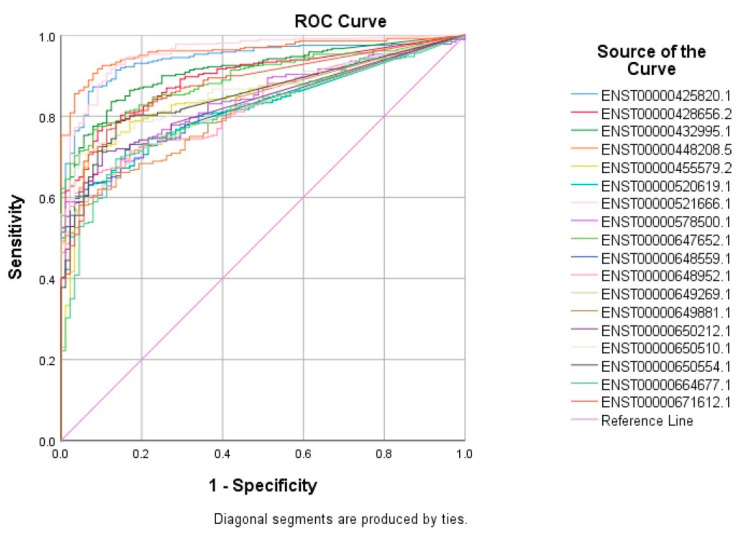
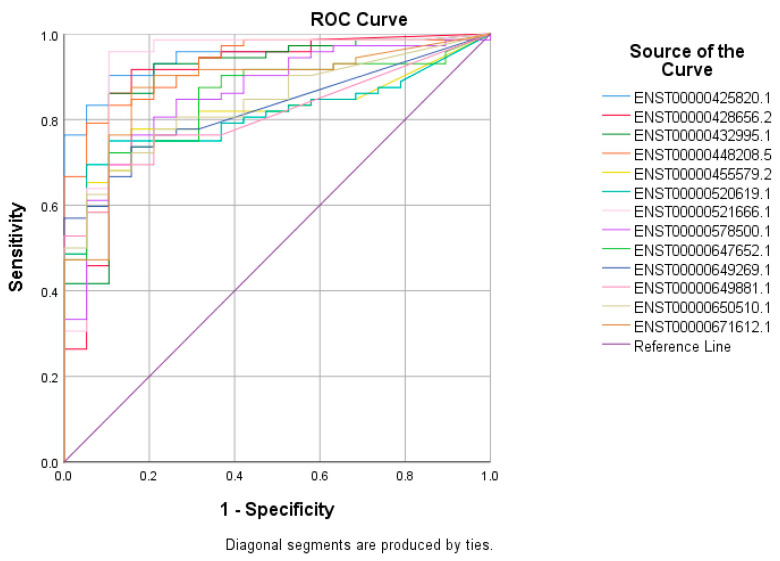
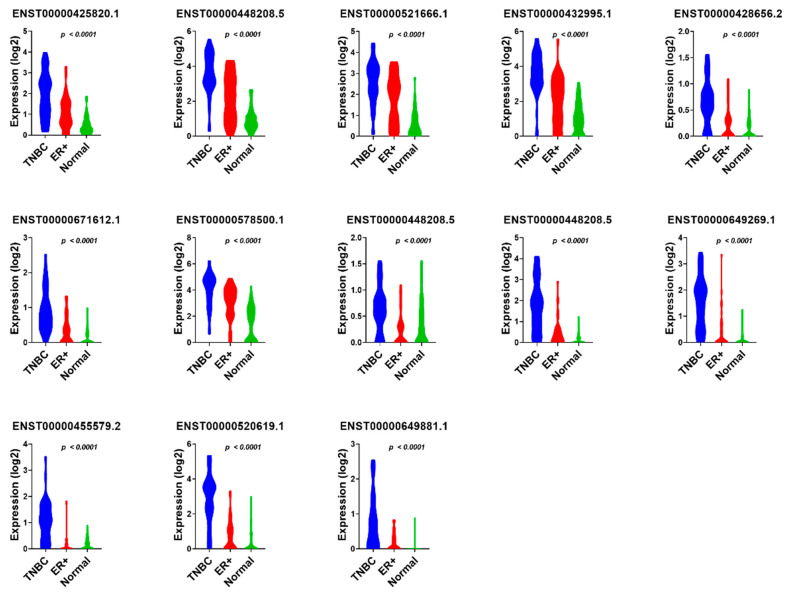
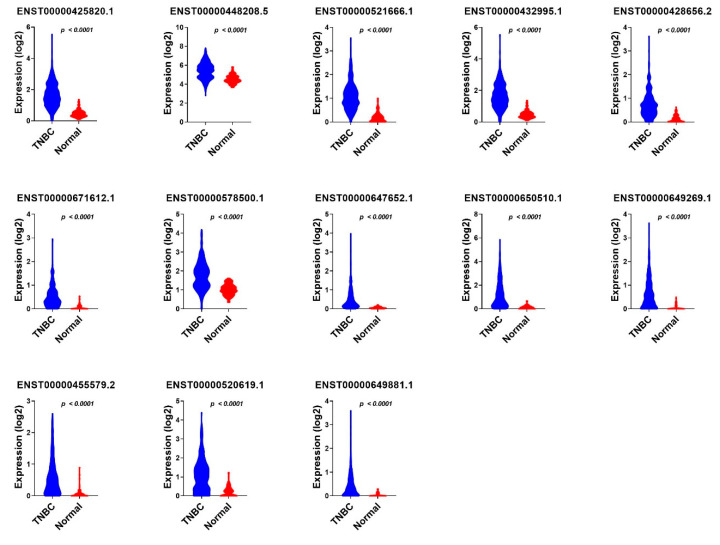
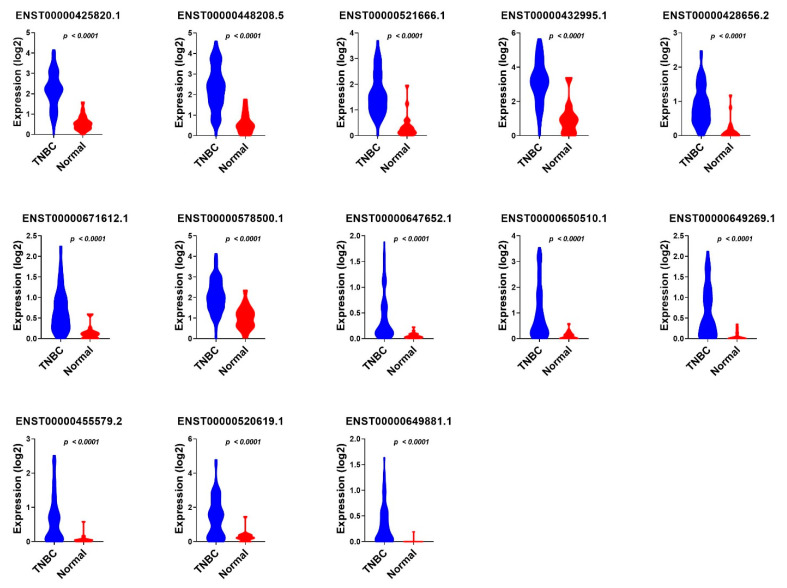
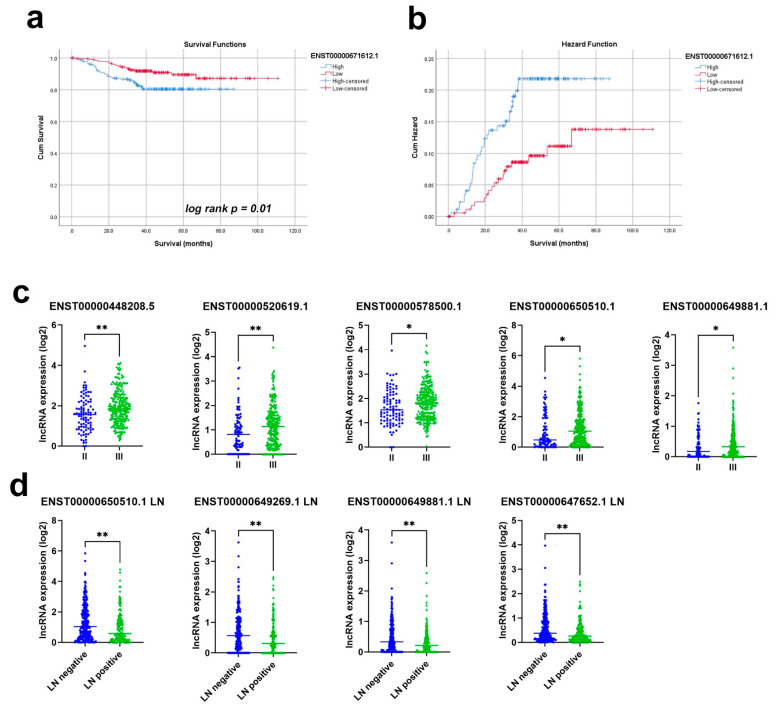
Breast cancer remains the world's most prevalent cancer, responsible for around 685,000 deaths globally despite international research efforts and advances in clinical management. While estrogen receptor positive (ER+), progesterone receptor positive (PR+), and human epidermal growth factor receptor positive (HER2+) subtypes are easily classified and can be targeted, there remains no direct diagnostic test for triple-negative breast cancer (TNBC), except for the lack of receptors expression. The identification of long non-coding RNAs (lncRNAs) and the roles they play in cancer progression has recently proven to be beneficial. In the current study, we utilize RNA sequencing data to identify lncRNA-based biomarkers associated with TNBC, ER+ subtypes, and normal breast tissue. The Marker Finder algorithm identified the lncRNA transcript panel most associated with each molecular subtype and the receiver operating characteristic (ROC) analysis was used to validate the diagnostic potential (area under the curve (AUC) of ≥8.0 and p value < 0.0001). Focusing on TNBC, findings from the discovery cohort were validated in an additional two cohorts, identifying 13 common lncRNA transcripts enriched in TNBC. Binary regression analysis identified a four lncRNA transcript signature (ENST00000425820.1, ENST00000448208.5, ENST00000521666.1, and ENST00000650510.1) with the highest diagnostic power for TNBC. The ENST00000671612.1 lncRNA transcript correlated with worse refractory free survival (RFS). Our data provides a step towards finding a novel diagnostic lncRNA-based panel for TNBC with potential therapeutic implications.

Keywords: TNBC; diagnosis; gene signature; lncRNA; long non-coding RNA; triple-negative breast cancer.


Conflict of interest statement

The authors declare no conflict of interest.

Figures

Figure 1
Figure 1
Identification of lncRNA-based biomarkers associated with TNBC, ER+, and normal breast tissue. Heatmap image depicting putative lncRNA-based markers associated with TNBC, ER+, and normal breast tissue, employing the marker discovery algorithm. Each column represents a sample while each row represents an lncRNA transcript. The first block of samples shown under the green x axis represents ER+ samples, the purple represents the TNBC samples, and the red represents the normal breast tissue samples. The expression of each lncRNA transcript is depicted according to the color scale (blue = downregulation and yellow = upregulation, differential expression (log2)).
Figure 2
Figure 2
ROC curves for putative lncRNA markers associated with TNBC. The top sixty identified lncRNA markers for TNBC using the marker finder algorithm were subjected to ROC analysis in SPSS. LncRNAs exhibiting an area under the curve of >0.8 and p < 0.0001 are included.
Figure 3
Figure 3
ROC curves for putative lncRNA markers associated with ER+ BC. The top sixty identified lncRNA markers for ER+ using the marker finder algorithm were subjected to ROC analysis in SPSS. LncRNAs exhibiting an area under the curve of >0.8 and p < 0.0001 are included.
Figure 4
Figure 4
ROC curves for putative lncRNA markers associated with normal breast tissue. The top sixty identified lncRNA markers for normal breast tissues from the marker finder algorithm were subjected to ROC analysis in SPSS. LncRNAs exhibiting an area under the curve of >0.8 and p < 0.0001 are included.
Figure 5
Figure 5
The validation of 18 common lncRNA markers in the second cohort of 360 TNBC samples and 88 normal breast tissue samples. A total of forty seven lncRNA transcripts identified from the marker finder algorithm were then validated in a second cohort of 360 TNBC samples and 88 normal breast tissue samples. LncRNAs exhibiting the values of >0.8 AUC and p < 0.0001 were retained.
Figure 6
Figure 6
The validation of 13 common lncRNA markers in a third cohort of 72 TNBC samples and 19 normal breast tissue samples. A total pf eighteen lncRNA transcripts identified from the marker finder algorithm which showed the values of >0.8 AUC and p < 0.0001 were then validated in a third cohort of 72 TNBC samples and 19 normal breast tissue samples, and the lncRNAs exhibiting the values of >0.8 AUC and p < 0.0001 were retained.
Figure 7
Figure 7
The expression value of 13 TNBC diagnostic lncRNA panels in TNBC compared to ER+ and normal breast tissue samples from the PRJNA251383 cohort. The expression values (log2) of TNBC (n = 42), ER+ (n = 42), and normal (n = 56) from the discovery cohort are presented as violin plots with the Anova p value indicated on each plot.
Figure 8
Figure 8
The expression value of 13 TNBC diagnostic lncRNA panels in TNBC compared to normal breast tissue samples from the PRJNA486023 cohort. The expression values (log2) of TNBC (n = 360) and normal (n = 88) from the first validation cohort are presented as violin plots with the Anova p value indicated on each plot.
Figure 9
Figure 9
The expression of 13 TNBC diagnostic lncRNA panels in TNBC compared to normal breast tissue samples from the PRJNA553096 cohort. The expression values (log2) from TNBC (n = 72) and normal (n = 19) from the second validation cohort are presented as violin plots with the Anova p value indicated on each plot.
Figure 10
Figure 10
Prognostic value of the identified thirteen lncRNA panels in TNBC. The Kaplan–Meier survival (a) and hazard (b) analysis based on the ENST00000671612.1 expression. (c) The expression of ENST00000448208.5; ENST00000520619.1; ENST00000578500.1; ENST00000650510.1; and ENST00000649881.1 in TNBC, with grade II compared to grade III. (d) The expression of ENST00000650510.1, ENST00000649269.1, ENST00000649881.1, and ENST00000647652.1 in TNBC patients with and without LN involvement. * p < 0.05, ** p < 0.005.

References

    1. Siegel R.L., Miller K.D., Fuchs H.E., Jemal A. Cancer Statistics, 2021. CA Cancer J. Clin. 2021;71:7–33. doi: 10.3322/caac.21654. - DOI - PubMed
    1. World Health Organisation Breast Cancer. (Online) Who.int. 2021. [(accessed on 25 October 2021)]. Available online: https://www.who.int/news-room/fact-sheets/detail/breast-cancer.
    1. Ramamoorthy P., Dandawate P., Jensen R.A., Anant S. Celastrol and Triptolide Suppress Stemness in Triple Negative Breast Cancer: Notch as a Therapeutic Target for Stem Cells. Biomedicines. 2021;9:482. doi: 10.3390/biomedicines9050482. - DOI - PMC - PubMed
    1. Grizzi G., Ghidini M., Botticelli A., Tomasello G., Ghidini A., Grossi F., Fusco N., Cabiddu M., Savio T., Petrelli F. Strategies for Increasing the Effectiveness of Aromatase Inhibitors in Locally Advanced Breast Cancer: An Evidence-Based Review on Current Options. Cancer Manag. Res. 2020;12:675–686. doi: 10.2147/CMAR.S202965. - DOI - PMC - PubMed
    1. Llombart-Cussac A., Cortes J., Pare L., Galvan P., Bermejo B., Martinez N., Vidal M., Pernas S., Lopez R., Munoz M., et al. HER2-enriched subtype as a predictor of pathological complete response following trastuzumab and lapatinib without chemotherapy in early-stage HER2-positive breast cancer (PAMELA): An open-label, single-group, multicentre, phase 2 trial. Lancet Oncol. 2017;18:545–554. doi: 10.1016/S1470-2045(17)30021-9. - DOI - PubMed