. 2021 Oct 28;13(21):5411.
doi: 10.3390/cancers13215411.

Individualized Proteogenomics Reveals the Mutational Landscape of Melanoma Patients in Response to Immunotherapy

Affiliations

Individualized Proteogenomics Reveals the Mutational Landscape of Melanoma Patients in Response to Immunotherapy

Marisa Schmitt et al. Cancers (Basel). .

Abstract

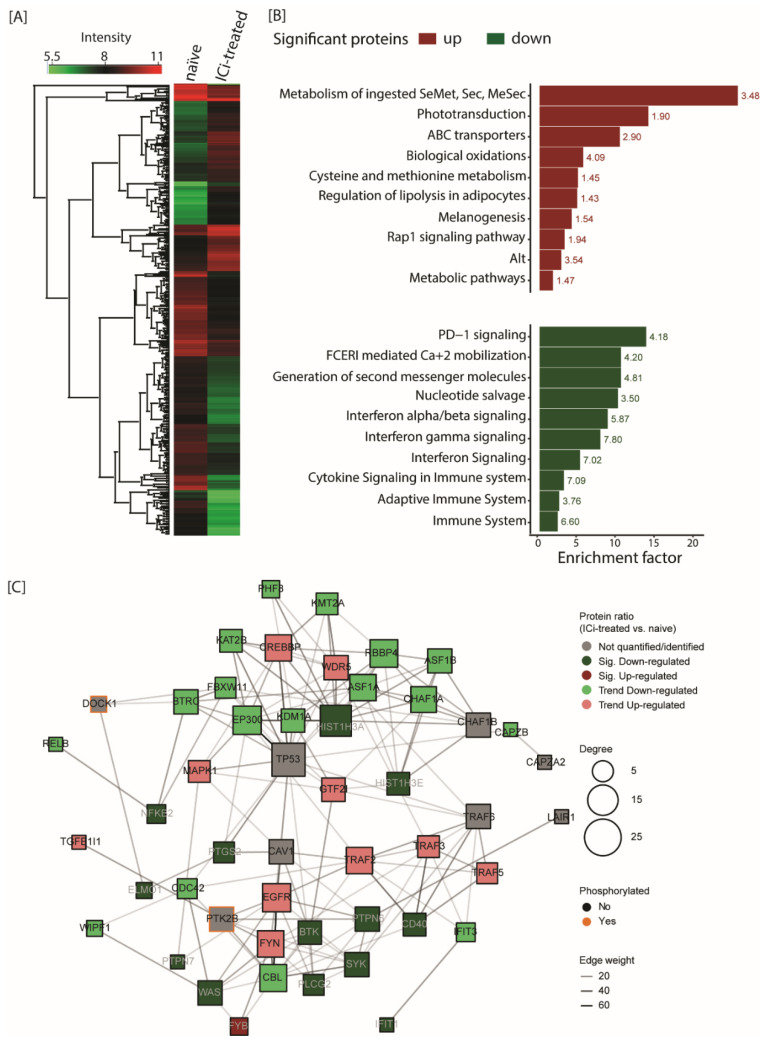
Immune checkpoint inhibitors are used to restore or augment antitumor immune responses and show great promise in the treatment of melanoma and other types of cancers. However, only a small percentage of patients are fully responsive to immune checkpoint inhibition, mostly due to tumor heterogeneity and primary resistance to therapy. Both of these features are largely driven by the accumulation of patient-specific mutations, pointing to the need for personalized approaches in diagnostics and immunotherapy. Proteogenomics integrates patient-specific genomic and proteomic data to study cancer development, tumor heterogeneity and resistance mechanisms. Using this approach, we characterized the mutational landscape of four clinical melanoma patients. This enabled the quantification of hundreds of sample-specific amino acid variants, among them many that were previously not reported in melanoma. Changes in abundance at the protein and phosphorylation site levels revealed patient-specific over-represented pathways, notably linked to melanoma development (MAPK1 activation) or immunotherapy (NLRP1 inflammasome). Personalized data integration resulted in the prediction of protein drug targets, such as the drugs vandetanib and bosutinib, which were experimentally validated and led to a reduction in the viability of tumor cells. Our study emphasizes the potential of proteogenomic approaches to study personalized mutational landscapes, signaling networks and therapy options.

Keywords: immunotherapy; mass spectrometry; melanoma; proteogenomics; whole exome sequencing.


Conflict of interest statement

The authors declare no conflict of interest.

Figures

Figure 1
Figure 1
The mutational landscape of melanoma patients in response to immunotherapy. (A) Schematic overview of the proteogenomic workflow. Whole blood and tumor tissue of four patients were used in this study. Metastatic tumor tissue was injected into an immune-deficient mouse to generate patient-derived xenografts (PDX). For whole exome sequencing, DNA was extracted from whole blood and metastatic tissue and sequenced on an Illumina sequencing instrument. Individualized protein databases and impact files were generated with an in-house bioinformatic pipeline. For the proteomic workflow, FFPE specimens from the same tissue as well as patient-derived xenografts tissue were used. Cells were lysed and proteins were digested using trypsin. The resulting peptide mixture from the PDX material was fractionated using an off-line RP HPLC operated at a high pH. Fractions were pooled and measured directly or applied to phosphopeptide enrichment using titanium dioxide (TiO2) prior to LC-MS/MS. MS raw data was processed with MaxQuant software and analysed by PCTi. (B) Clinical information of analyzed samples including the administered therapy, the progression-free survival (PFS), overall survival (OS), detection of variants in key oncogenes, cancer stage and clinical outcome. The PFS and OS were calculated based on the start of therapy and the numbers indicate the days after therapy started. (C) Overlap of non-synonymous nucleotide variants identified by WES of four melanoma patients (tumor tissue and blood). (D) Inner donut depicts the type of all non-synonymous nucleotide variants identified by WES including substitution, insertions, deletions and frameshifts. Outer donut represents the proportion of novel nucleotide variants identified in this study. (E) Overlap in identified nucleotide variants (from all patients) between WES-identified non-synonymous variants (blue), WES-identified non-synonymous somatic variants (brown), MS-identified reference variant peptides (orange), MS-identified alternate variant peptides (red) and MS-identified phosphorylated on variant site peptides (green). Numbers correspond to the size of the set or the percentage of the total. To allow a comparison between WES and MS identification, variants were counted at the nucleotide level (avoiding redundancy from protein isoforms). (F) Identified protein groups and variants by MS for each patient and sample type (PDX and FFPE) and the number of phosphorylation sites identified in the PDX samples. Identified alternate variant protein isoforms per patient are shown in black.
Figure 2
Figure 2
Comparison of tumor cells against melanocytes highlights patient-specific signaling pathways. (AD) Scatter plot of log2-transformed ratios for proteins quantified in the PDX samples versus melanocytes for patient IDs 101 (A), 110 (B), 111 (C) and 129 (D). Significant proteins containing identified alternate peptides are marked in the respective color (significance B, p-value ≤ 0.05). Proteins marked in black were also identified in the corresponding FFPE material for each patient ID. The top 3 over-represented Reactome pathways based on all significantly up- or down regulated proteins are depicted in the upper part of each panel (Fisher-Exact test, p-value ≤ 0.2). (E) Heatmap of over-represented pathways within each patient based on proteins containing alternate variant peptides. Results are based on the Fisher-Exact test (p-value ≤ 0.2). Color-coding indicates if a specific pathway was significantly over-represented in patient IDs 101 (blue), 110 (green), 111 (red) and 129 (orange).
Figure 3
Figure 3
Integration of genomics, proteomics and drug database prioritizes actionable targets. (A) The interaction signaling network for patient ID 110 was generated based on list of significantly regulated proteins (diamond) and phosphorylation sites (square). This schematic displays the distribution of nodes in function of their betweenness centrality and number of connections. Only the top 200 entries are displayed (ranked based on their interaction degree). Entries are colored based on whether they were up-regulated in PDX (light green) or FFPE (dark green). (B) The drugs, interacting with entries from the interaction signaling network of patient ID 110, are displayed based on their targets’ maximum variant impact score and how many connections their targets had. Color-coding corresponds to whether all of the drug targets were specific for PDX (light green), FFPE (dark green) or common to both sample types (grey). (C,D) Cell viability assay for fibroblasts (C) and cell line of patient ID 110 (D) treated with either fostamatinib (blue), trametinib (grey), vandetanib (yellow) or bosutinib (dark blue). Cells were cultured for 24 h, and then treated with the depicted drugs at the indicated concentrations (0, 0.635, 1.25 and 2.5 µM) or DMSO as the control. Cell viability was determined by MTS assay 96 h later. Results expressed as a percentage of the control represent the mean of six replicates. The error bar represents the standard deviations of replicates.
Figure 4
Figure 4
Differential protein expression between naïve and ICi-treated patients. (A) Heat map of significantly regulated proteins between naïve and ICi-treated patients (Sig. B, FDR ≤ 0.05). Color code depicts log10-transformed IBAQ intensities of proteins for each group. (B) Pathway over-representation of significantly regulated proteins between naïve and ICi-treated patients (Sig. B with FDR ≤ 0.05; Fisher-Exact test with FDR ≤ 0.02). Pathways over-represented based on up- and down-regulated proteins are displayed in red and green, respectively. The text on the right of each bar corresponds to the over-representation of the −log10 p-value. (C) Interaction network of immune related proteins significantly changed between ICi-treated and naïve patients, as well as their direct protein interactors. Only the top 50 entries are displayed (ranked based on their interaction degree). Entries are colored based on their direction of regulation between ICi-treated and naïve patients; i.e., not quantified (grey), down-regulation trend (light green), significant down-regulation (dark green), up-regulation trend (light red) and significant up-regulation (dark red). Entries that were also found to be phosphorylated are displayed with an orange stroke. Node size is proportional to the node number of connections (degree).

Similar articles

  • Proteogenomic Landscape of Breast Cancer Tumorigenesis and Targeted Therapy.
    Krug K, Jaehnig EJ, Satpathy S, Blumenberg L, Karpova A, Anurag M, Miles G, Mertins P, Geffen Y, Tang LC, Heiman DI, Cao S, Maruvka YE, Lei JT, Huang C, Kothadia RB, Colaprico A, Birger C, Wang J, Dou Y, Wen B, Shi Z, Liao Y, Wiznerowicz M, Wyczalkowski MA, Chen XS, Kennedy JJ, Paulovich AG, Thiagarajan M, Kinsinger CR, Hiltke T, Boja ES, Mesri M, Robles AI, Rodriguez H, Westbrook TF, Ding L, Getz G, Clauser KR, Fenyö D, Ruggles KV, Zhang B, Mani DR, Carr SA, Ellis MJ, Gillette MA; Clinical Proteomic Tumor Analysis Consortium. Krug K, et al. Cell. 2020 Nov 25;183(5):1436-1456.e31. doi: 10.1016/j.cell.2020.10.036. Epub 2020 Nov 18. Cell. 2020. PMID: 33212010 Free PMC article.
  • A proteogenomic approach to target neoantigens in solid tumors.
    Verma A, Halder A, Marathe S, Purwar R, Srivastava S. Verma A, et al. Expert Rev Proteomics. 2020 Nov-Dec;17(11-12):797-812. doi: 10.1080/14789450.2020.1881889. Expert Rev Proteomics. 2020. PMID: 33491499 Review.
  • Pan-cancer proteogenomics characterization of tumor immunity.
    Petralia F, Ma W, Yaron TM, Caruso FP, Tignor N, Wang JM, Charytonowicz D, Johnson JL, Huntsman EM, Marino GB, Calinawan A, Evangelista JE, Selvan ME, Chowdhury S, Rykunov D, Krek A, Song X, Turhan B, Christianson KE, Lewis DA, Deng EZ, Clarke DJB, Whiteaker JR, Kennedy JJ, Zhao L, Segura RL, Batra H, Raso MG, Parra ER, Soundararajan R, Tang X, Li Y, Yi X, Satpathy S, Wang Y, Wiznerowicz M, González-Robles TJ, Iavarone A, Gosline SJC, Reva B, Robles AI, Nesvizhskii AI, Mani DR, Gillette MA, Klein RJ, Cieslik M, Zhang B, Paulovich AG, Sebra R, Gümüş ZH, Hostetter G, Fenyö D, Omenn GS, Cantley LC, Ma'ayan A, Lazar AJ, Ceccarelli M, Wang P; Clinical Proteomic Tumor Analysis Consortium. Petralia F, et al. Cell. 2024 Feb 29;187(5):1255-1277.e27. doi: 10.1016/j.cell.2024.01.027. Epub 2024 Feb 14. Cell. 2024. PMID: 38359819 Free PMC article.
  • Proteogenomic Profiling of Treatment-Naïve Metastatic Malignant Melanoma.
    Kuras M, Betancourt LH, Hong R, Szadai L, Rodriguez J, Horvatovich P, Pla I, Eriksson J, Szeitz B, Deszcz B, Welinder C, Sugihara Y, Ekedahl H, Baldetorp B, Ingvar C, Lundgren L, Lindberg H, Oskolas H, Horvath Z, Rezeli M, Gil J, Appelqvist R, Kemény LV, Malm J, Sanchez A, Szasz AM, Pawłowski K, Wieslander E, Fenyö D, Nemeth IB, Marko-Varga G. Kuras M, et al. Cancers (Basel). 2025 Feb 27;17(5):832. doi: 10.3390/cancers17050832. Cancers (Basel). 2025. PMID: 40075679 Free PMC article.
  • Biological Factors behind Melanoma Response to Immune Checkpoint Inhibitors.
    Olbryt M, Rajczykowski M, Widłak W. Olbryt M, et al. Int J Mol Sci. 2020 Jun 6;21(11):4071. doi: 10.3390/ijms21114071. Int J Mol Sci. 2020. PMID: 32517213 Free PMC article. Review.

Cited by

References

    1. Rajasagi M., Shukla S.A., Fritsch E.F., Keskin D.B., DeLuca D., Carmona E., Zhang W., Sougnez C., Cibulskis K., Sidney J., et al. Systematic identification of personal tumor-specific neoantigens in chronic lymphocytic leukemia. Blood. 2014;124:453–462. doi: 10.1182/blood-2014-04-567933. - DOI - PMC - PubMed
    1. Chapman P.B., Hauschild A., Robert C., Haanen J.B., Ascierto P., Larkin J., Dummer R., Garbe C., Testori A., Maio M., et al. Improved survival with vemurafenib in melanoma with BRAF V600E mutation. N. Engl. J. Med. 2011;364:2507–2516. doi: 10.1056/NEJMoa1103782. - DOI - PMC - PubMed
    1. Flaherty K.T., Robert C., Hersey P., Nathan P., Garbe C., Milhem M., Demidov L.V., Hassel J.C., Rutkowski P., Mohr P., et al. Improved Survival with MEK Inhibition in BRAF-Mutated Melanoma. N. Engl. J. Med. 2012;367:107–114. doi: 10.1056/NEJMoa1203421. - DOI - PubMed
    1. Davies H., Bignell G.R., Cox C., Stephens P., Edkins S., Clegg S., Teague J., Woffendin H., Garnett M.J., Bottomley W., et al. Mutations of the BRAF gene in human cancer. Nature. 2002;417:949–954. doi: 10.1038/nature00766. - DOI - PubMed
    1. Allen E.M.V., Wagle N., Sucker A., Treacy D.J., Johannessen C.M., Goetz E.M., Place C.S., Taylor-Weiner A., Whittaker S., Kryukov G.V., et al. The genetic landscape of clinical resistance to RAF inhibition in metastatic melnaoma. Cancer Discov. 2014;4:94–109. doi: 10.1158/2159-8290.CD-13-0617. - DOI - PMC - PubMed