. 2021 Nov 4;13(21):5545.
doi: 10.3390/cancers13215545.

The Immune Landscape of Colorectal Cancer

Affiliations

The Immune Landscape of Colorectal Cancer

Artur Mezheyeuski et al. Cancers (Basel). .

Abstract

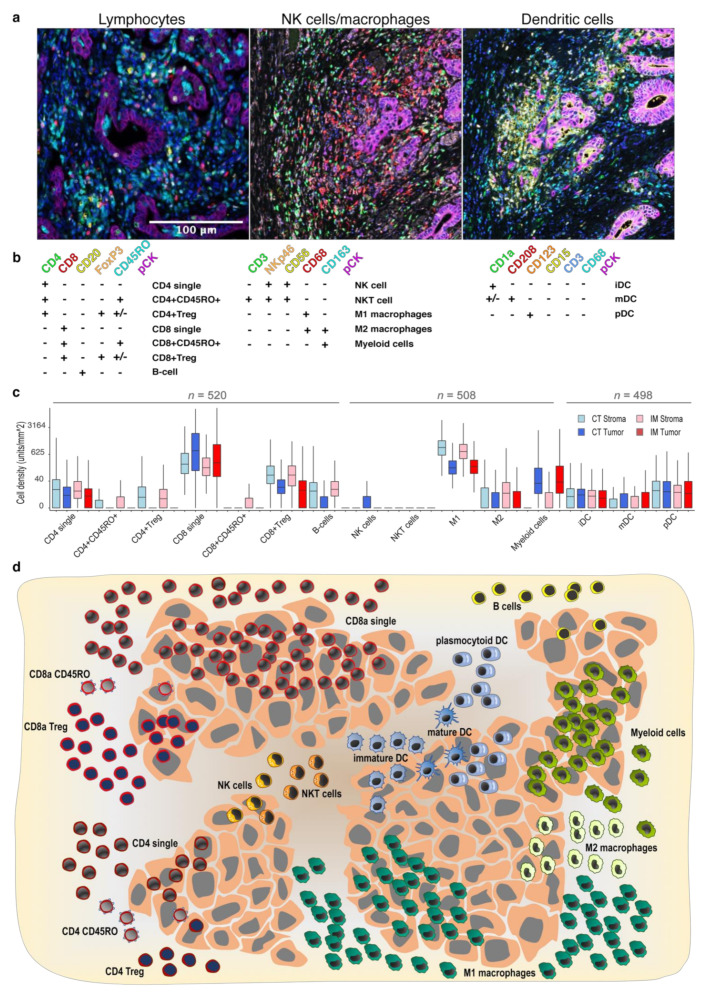
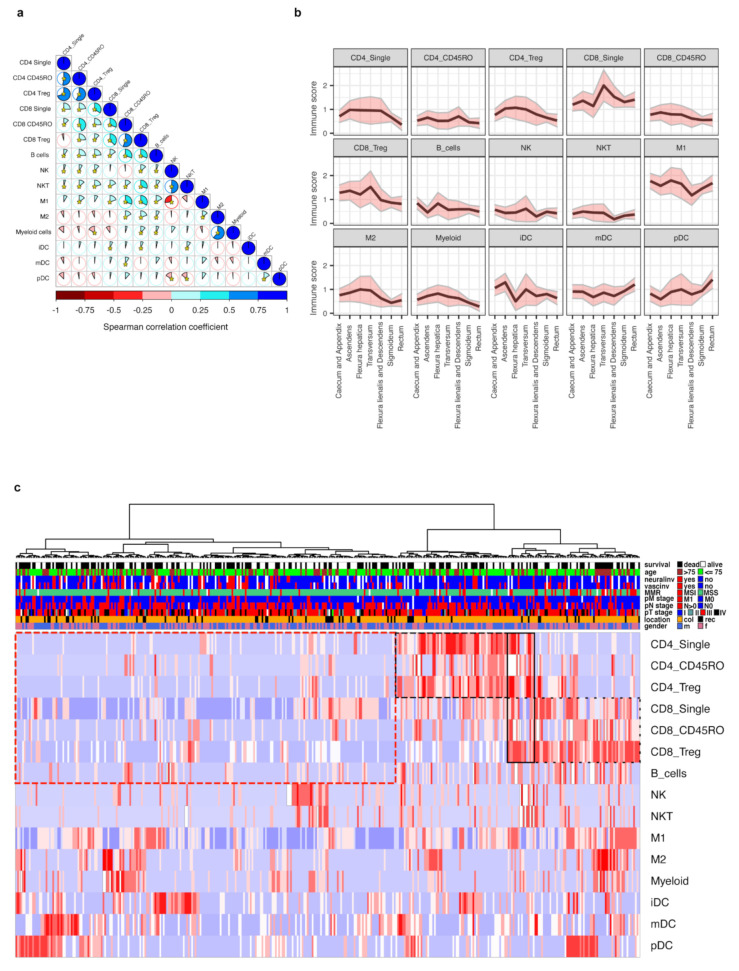
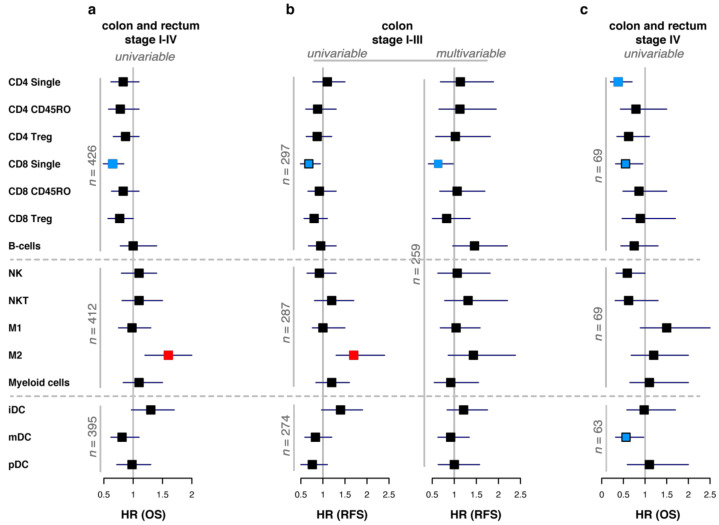
While the clinical importance of CD8+ and CD3+ cells in colorectal cancer (CRC) is well established, the impact of other immune cell subsets is less well described. We sought to provide a detailed overview of the immune landscape of CRC in the largest study to date in terms of patient numbers and in situ analyzed immune cell types. Tissue microarrays from 536 patients were stained using multiplexed immunofluorescence panels, and fifteen immune cell subclasses, representing adaptive and innate immunity, were analyzed. Overall, therapy-naïve CRC patients clustered into an 'inflamed' and a 'desert' group. Most T cell subsets and M2 macrophages were enriched in the right colon (p-values 0.046-0.004), while pDC cells were in the rectum (p = 0.008). Elderly patients had higher infiltration of M2 macrophages (p = 0.024). CD8+ cells were linked to improved survival in colon cancer stages I-III (q = 0.014), while CD4+ cells had the strongest impact on overall survival in metastatic CRC (q = 0.031). Finally, we demonstrated repopulation of the immune infiltrate in rectal tumors post radiation, following an initial radiation-induced depletion. This study provides a detailed analysis of the in situ immune landscape of CRC paving the way for better diagnostics and providing hints to better target the immune microenvironment.

Keywords: colorectal cancer; immune landscape; multiplex; tumor immunology.


Conflict of interest statement

The authors declare no conflict of interest.

Figures

Figure 1
Figure 1
Characterization of immune cell subsets in the tumor and stroma compartments at the invasive margin and core of the tumor of primary CRC. (a) Representative images of the multiplex staining with three immune panels; (b) scheme of the immune marker combinations used to define the subgroups of immune cells; (c) immune cell densities in Tumor and Stroma compartments in Central Tumor (CT) and Invasive Margin (IM) (boxes show median values and interquartile range, and numbers represent cell counts per mm2, cube root transformed); and (d) illustration of the mean immune cell infiltration in tumor center in tumor and stromal compartment.
Figure 2
Figure 2
The immune scores interrelations, distribution across different clinical and pathological groups and unsupervised hierarchical clustering. (a) Graphical representation of Spearman’s correlation matrix between immune scores. Pie charts and the intensity of shading represent the strength of correlation (Spearman correlation coefficient), blue color indicates direct while red color indicates inverse correlation. Asterisks indicate statistical significance (p < 0.05). (b) Immune scores mean levels (black line) and 95% confidence intervals (pink areas limited by gray lines) at specific primary tumor locations. For additional data, see Table S2. (c) Unsupervised hierarchical cluster analysis of immune scores. Cases were clustered based on the levels of immune scores. A total of 373 cases with complete immune score data from therapy-naïve patients were available. Clusters with enriched CD4 or CD8 cells are marked by dashed black line, while the cluster with low lymphocyte level is marked by dashed red line. For additional data, see Table S3.
Figure 3
Figure 3
Immune scores predict patient survival. Forest plot of hazard ratios (HR) for immune scores in the univariable and multivariable Cox regression models. Filled squares indicate HR and whiskers represent 95% CI. Blue-colored squares indicate statistically significant (p < 0.05 and, where applicable, FDR q < 0.05) associations of the respective immune score with improved survival, while red squares represent association with reduced survival. Blue-colored squares with black contour indicate that the association was statistically significant in an individual test (p < 0.05) but lost statistical significance after adjustment for multiple testing (FDR q ≥ 0.05). (a) Univariable associations of immune scores with OS in a complete cohort of therapy-naïve patients. For detailed information see Table S5. (b) Association of immune scores with RFS in stage I–III colon cancer. Left panel illustrates the result of the univariable Cox regression models. Right panel illustrates the result of the multivariable Cox regression model, adjusted to clinicopathological parameters: pT, pN stages, tumor differentiation, patient age, surgery type (elective or acute), and adjuvant treatment. For detailed information see Supplementary Tables S6 and S7. (c) Univariable associations of immune scores with OS in stage IV therapy-naïve colorectal cancer patients. For detailed information, see Table S8.
Figure 4
Figure 4
Immune infiltration in rectal cancers is restored after RT/CRT pre-treatment and delayed surgery, while vasculature is changed. (a) Radar plots of immune scores in therapy-naïve colon cancer patients (green) and rectal cancer patients (brown). (b) Immune infiltrate levels for patients who had primary surgery (white), radiation therapy followed by immediate surgery (<21 days), or delayed surgery after (chemo)radiotherapy. Numbers represent cell counts per mm2, cube root transformed. Boxes show median values and interquartile range of the ratios, whiskers represent 1.5 IQR. Wilcoxon signed-rank test with Pratt method assuming asymptotic distribution was used for statistical analysis. Statistically significant differences: * p < 0.05, ** p < 0.01 and *** p < 0.001; not statistically significant differences: n.s.

References

    1. Sung H., Ferlay J., Siegel R.L., Laversanne M., Soerjomataram I., Jemal A., Bray F. Global Cancer Statistics 2020: GLOBOCAN Estimates of Incidence and Mortality Worldwide for 36 Cancers in 185 Countries. CA Cancer J. Clin. 2021;71:209–249. doi: 10.3322/caac.21660. - DOI - PubMed
    1. Guinney J., Dienstmann R., Wang X., De Reynies A., Schlicker A., Soneson C., Marisa L., Roepman P., Nyamundanda G., Angelino P., et al. The consensus molecular subtypes of colorectal cancer. Nat. Med. 2015;21:1350–1356. doi: 10.1038/nm.3967. - DOI - PMC - PubMed
    1. Galon J., Fridman W.H., Pages F. The adaptive immunologic microenvironment in colorectal cancer: A novel perspective. Cancer Res. 2007;67:1883–1886. doi: 10.1158/0008-5472.CAN-06-4806. - DOI - PubMed
    1. Mlecnik B., Tosolini M., Kirilovsky A., Berger A., Bindea G., Meatchi T., Bruneval P., Trajanoski Z., Fridman W.H., Pages F., et al. Histopathologic-based prognostic factors of colorectal cancers are associated with the state of the local immune reaction. J. Clin. Oncol. 2011;29:610–618. doi: 10.1200/JCO.2010.30.5425. - DOI - PubMed
    1. Pages F., Mlecnik B., Marliot F., Bindea G., Ou F.S., Bifulco C., Lugli A., Zlobec I., Rau T.T., Berger M.D., et al. International validation of the consensus Immunoscore for the classification of colon cancer: A prognostic and accuracy study. Lancet. 2018;391:2128–2139. doi: 10.1016/S0140-6736(18)30789-X. - DOI - PubMed