

Metabolomic Analysis of Actinic Keratosis and SCC Suggests a Grade-Independent Model of Squamous Cancerization
- PMID: 34771721
- PMCID: PMC8582912
- DOI: 10.3390/cancers13215560
Metabolomic Analysis of Actinic Keratosis and SCC Suggests a Grade-Independent Model of Squamous Cancerization
Abstract
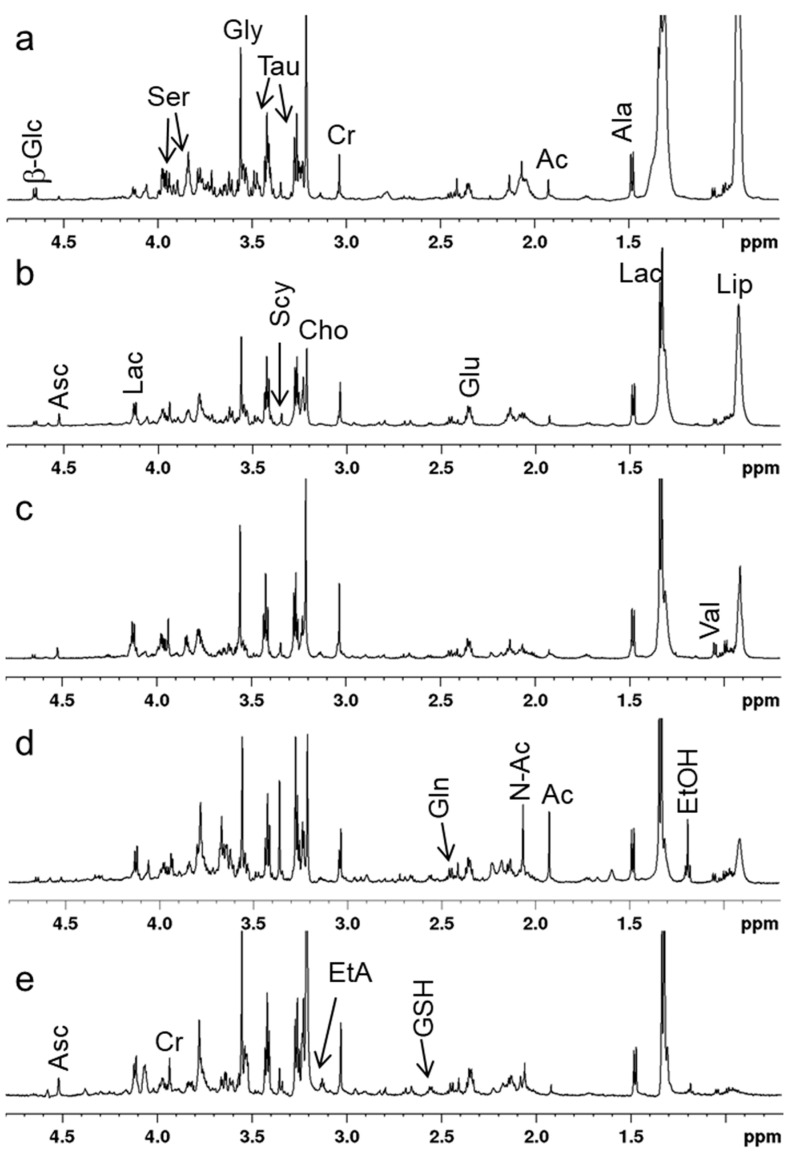
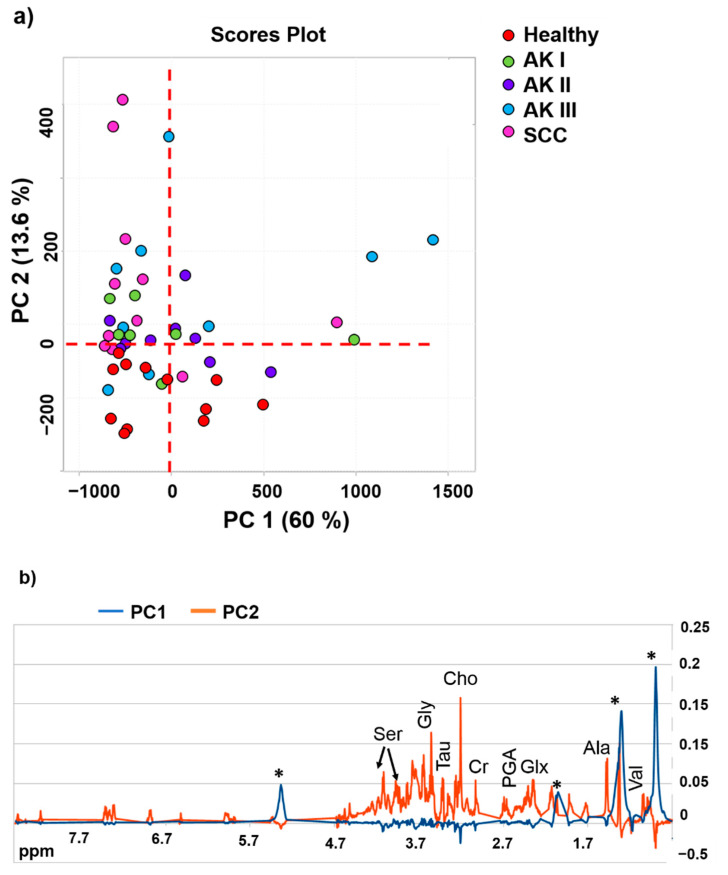
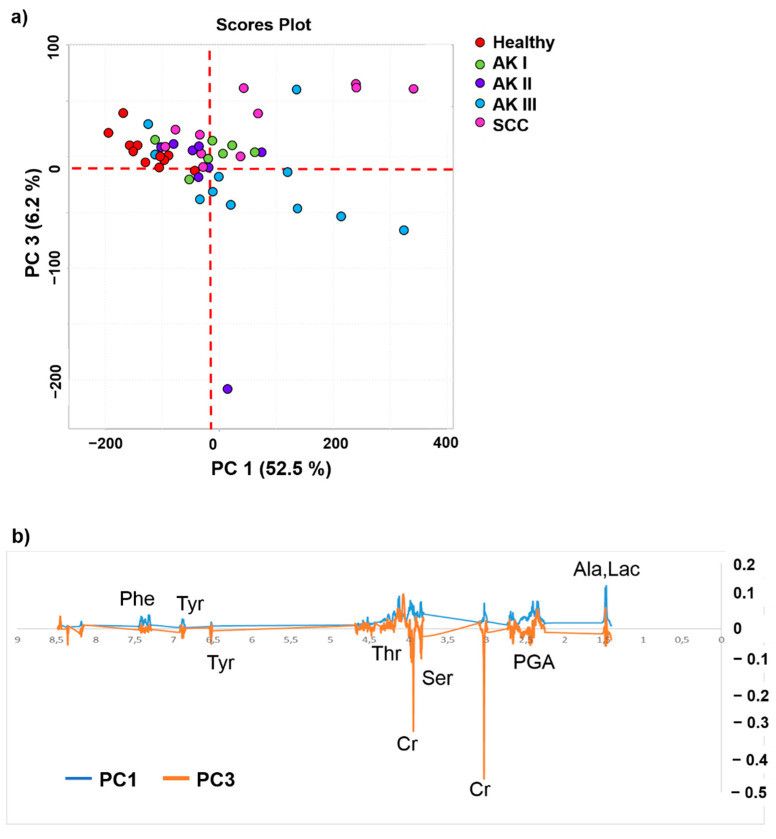
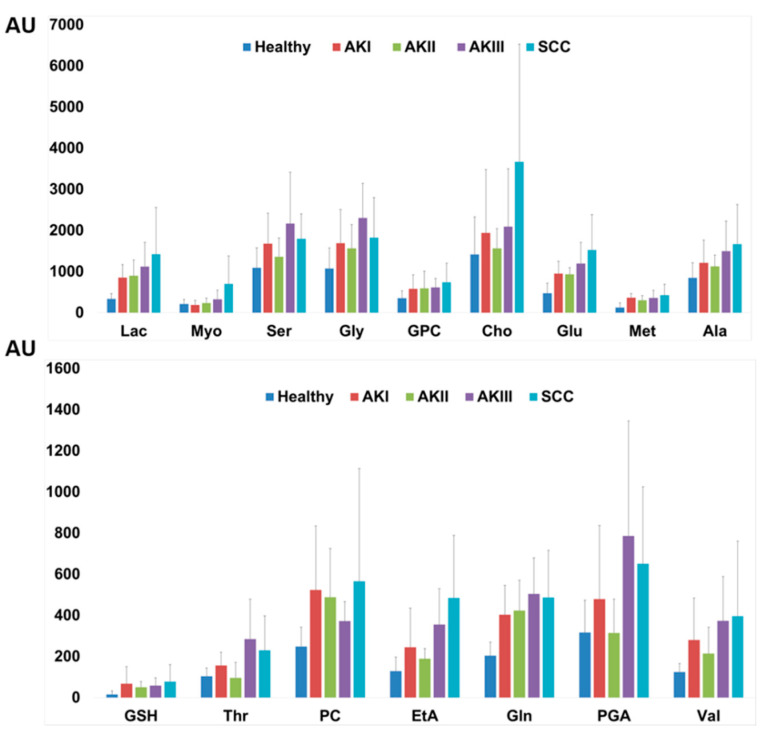
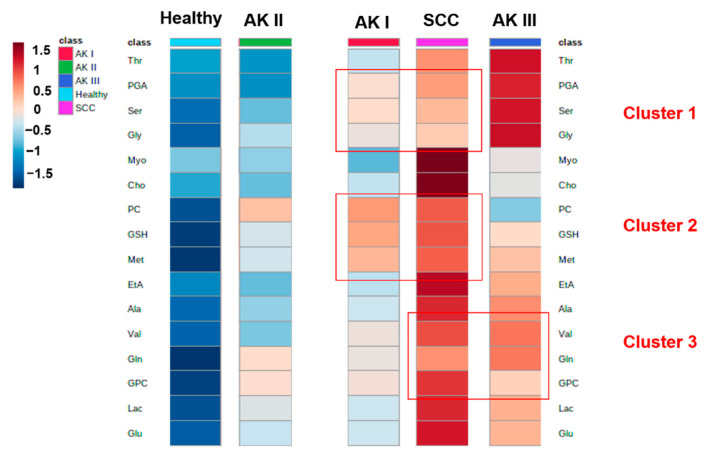
Background-Actinic keratoses (AKs) are the most common sun-induced precancerous lesions that can progress to squamocellular carcinoma (SCC). Recently, the grade-independent association between AKs and SCC has been suggested; however, the molecular bases of this potential association have not been investigated. This study has assessed the metabolomic fingerprint of AK I, AK II, AK III and SCC using high resolution magic angle spinning (HR-MAS) nuclear magnetic resonance (NMR) spectroscopy in order to evaluate the hypothesis of grade-independent association between AK and SCC. Association between AKs and SCCs has also been evaluated by histopathology. Methods-Metabolomic data were obtained through HR-MAS NMR spectroscopy. The whole spectral profiles were analyzed through multivariate statistical analysis using MetaboAnalyst 5.0. Histologic examination was performed on sections stained with hematoxylin and eosin; statistical analysis was performed using STATA software version 14. Results-A group of 35 patients affected by AKs and/or SCCs and 10 healthy controls were enrolled for metabolomics analysis. Histopathological analysis was conducted on 170 specimens of SCCs and AKs (including the ones that underwent metabolomic analysis). SCCs and AK I were found to be significantly associated in terms of the content of some metabolites. Moreover, in the logistic regression model, the presence of parakeratosis in AKs appeared to be less frequently associated with SCCs, while AKs with hypertrophy had a two-fold higher risk of being associated with SCC. Conclusions-Our findings, derived from metabolomics and histopathological data, support the notion that AK I are different from healthy skin and share some different features with SCCs. This may further support the expanding notion that all AKs should be treated independently from their clinical appearance or histological grade because they may be associated with SCC.
Keywords: actinic keratosis; biomarkers; histology; human skin metabolomics; metabolomic NMR profiling; squamous cell carcinoma.
Conflict of interest statement
The authors declare no conflict of interest.
Figures
References
-
- Rubió-Casadevall J., Hernandez-Pujol A., Ferreira-Santos M., Morey-Esteve G., Vilardell L., Osca-Gelis G., Vilar-Coromina N., Marcos-Gragera R. Trends in incidence and survival analysis in non-melanoma skin cancer from 1994 to 2012 in Girona, Spain: A population-based study. Cancer Epidemiol. 2016;45:6–10. doi: 10.1016/j.canep.2016.09.001. - DOI - PubMed
LinkOut - more resources
Full Text Sources
Research Materials
