

Topological Analysis of γH2AX and MRE11 Clusters Detected by Localization Microscopy during X-ray-Induced DNA Double-Strand Break Repair
- PMID: 34771723
- PMCID: PMC8582740
- DOI: 10.3390/cancers13215561
Topological Analysis of γH2AX and MRE11 Clusters Detected by Localization Microscopy during X-ray-Induced DNA Double-Strand Break Repair
Abstract
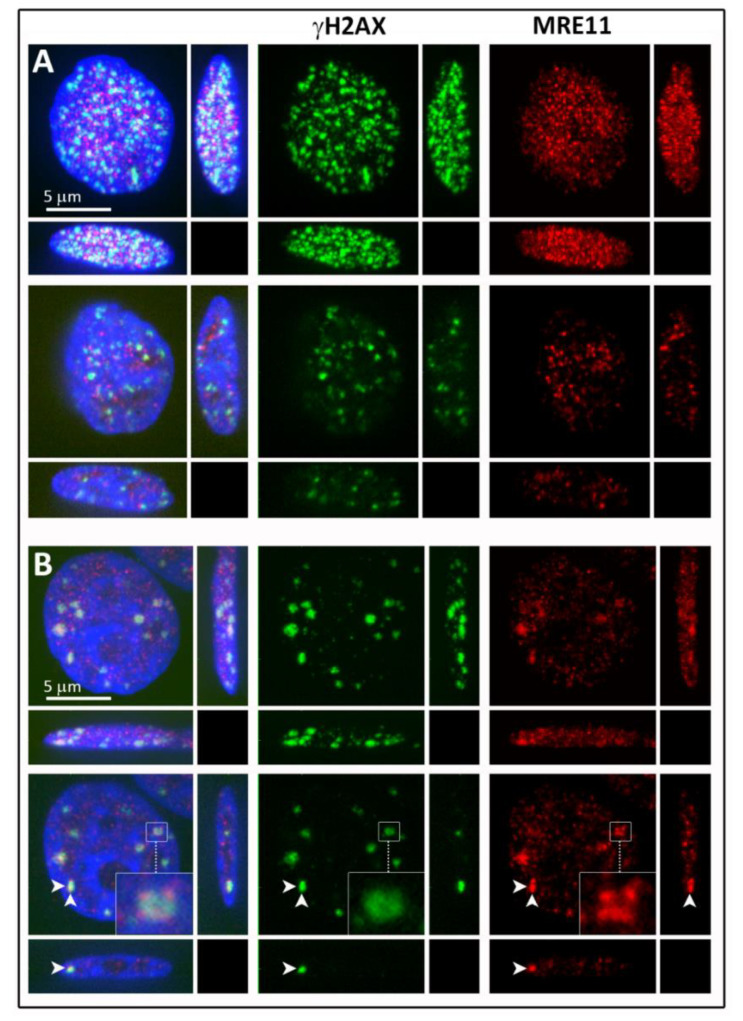
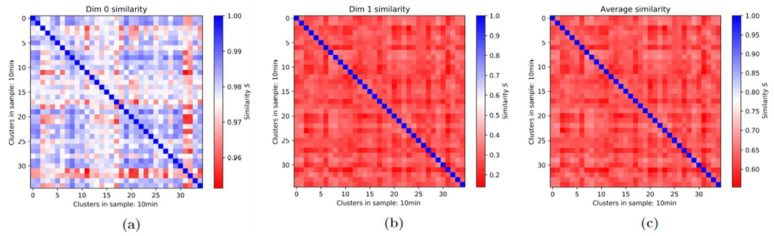
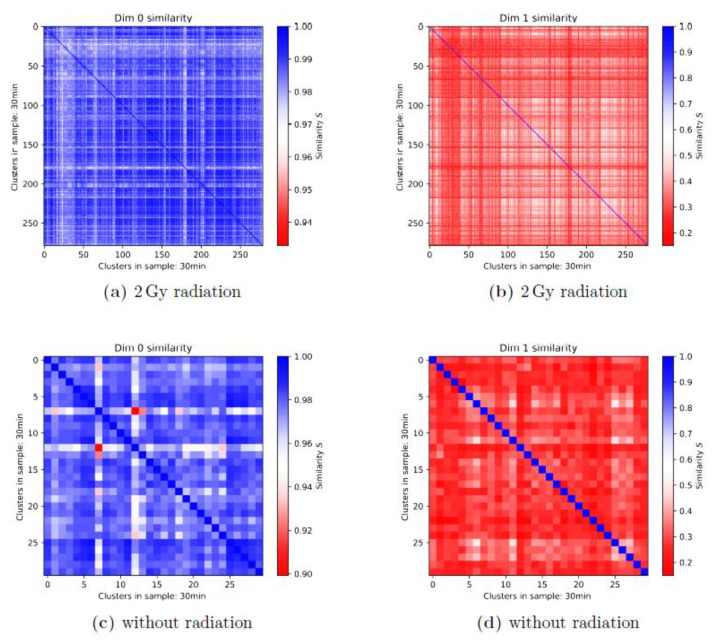
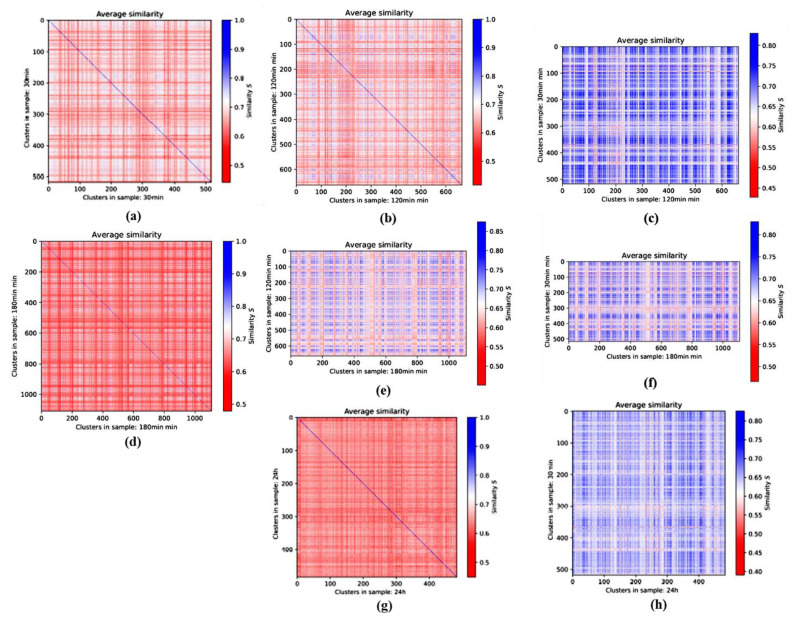
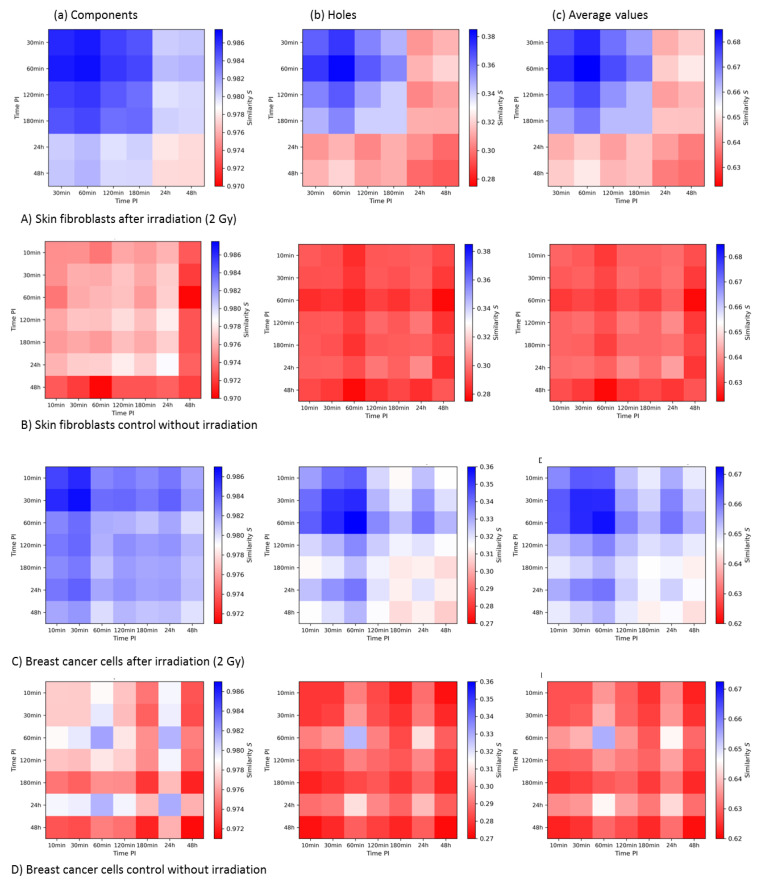
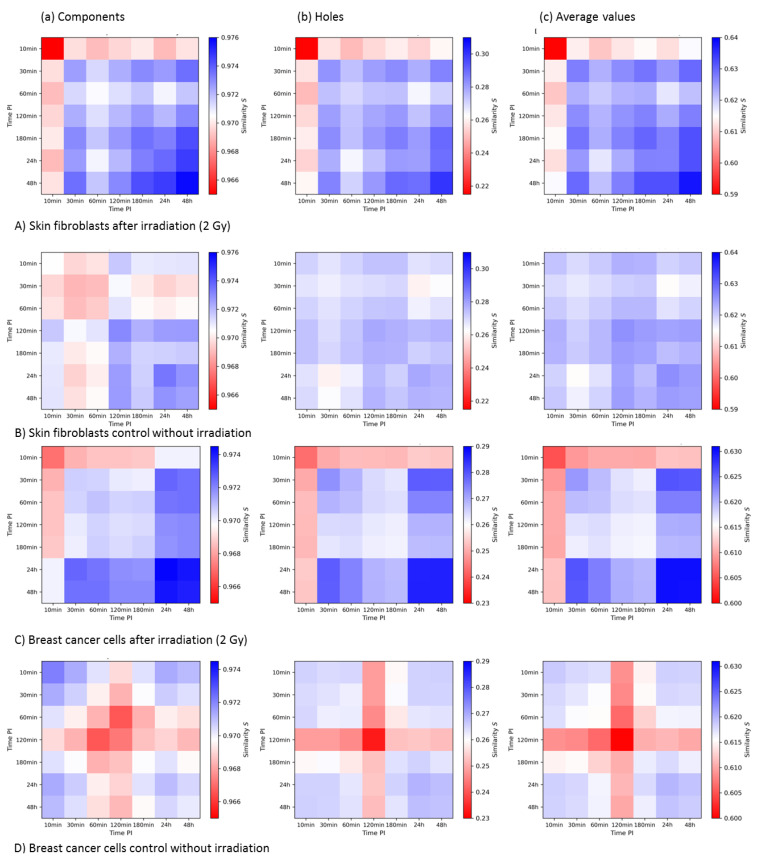
DNA double-strand breaks (DSBs), known as the most severe damage in chromatin, were induced in breast cancer cells and normal skin fibroblasts by 2 Gy ionizing photon radiation. In response to DSB induction, phosphorylation of the histone variant H2AX to γH2AX was observed in the form of foci visualized by specific antibodies. By means of super-resolution single-molecule localization microscopy (SMLM), it has been recently shown in a first article about these data that these foci can be separated into clusters of about the same size (diameter ~400 nm). The number of clusters increased with the dose applied and decreased with the repair time. It has also been shown that during the repair period, antibody-labeled MRE11 clusters of about half of the γH2AX cluster diameter were formed inside several γH2AX clusters. MRE11 is part of the MRE11-RAD50-NBS1 (MRN) complex, which is known as a DNA strand resection and broken-end bridging component in homologous recombination repair (HRR) and alternative non-homologous end joining (a-NHEJ). This article is a follow-up of the former ones applying novel procedures of mathematics (topology) and similarity measurements on the data set: to obtain a measure for cluster shape and shape similarities, topological quantifications employing persistent homology were calculated and compared. In addition, based on our findings that γH2AX clusters associated with heterochromatin show a high degree of similarity independently of dose and repair time, these earlier published topological analyses and similarity calculations comparing repair foci within individual cells were extended by topological data averaging (2nd-generation heatmaps) over all cells analyzed at a given repair time point; thereby, the two dimensions (0 and 1) expressed by components and holes were studied separately. Finally, these mean value heatmaps were averaged, in addition. For γH2AX clusters, in both normal fibroblast and MCF-7 cancer cell lines, an increased similarity was found at early time points (up to 60 min) after irradiation for both components and holes of clusters. In contrast, for MRE11, the peak in similarity was found at later time points (2 h up to 48 h) after irradiation. In general, the normal fibroblasts showed quicker phosphorylation of H2AX and recruitment of MRE11 to γH2AX clusters compared to breast cancer cells and a shorter time interval of increased similarity for γH2AX clusters. γH2AX foci and randomly distributed MRE11 molecules naturally occurring in non-irradiated control cells did not show any significant topological similarity.
Keywords: DNA double-strand breaks; ionizing photon irradiation; persistent homology; single-molecule localization microscopy; topology of MRE11 clusters; topology of γH2AX clusters.
Conflict of interest statement
The authors declare no conflict of interest.
Figures
Similar articles
-
Incorporation of Low Concentrations of Gold Nanoparticles: Complex Effects on Radiation Response and Fate of Cancer Cells.Pharmaceutics. 2022 Jan 11;14(1):166. doi: 10.3390/pharmaceutics14010166. Pharmaceutics. 2022. PMID: 35057061 Free PMC article.
-
Using Persistent Homology as a New Approach for Super-Resolution Localization Microscopy Data Analysis and Classification of γH2AX Foci/Clusters.Int J Mol Sci. 2018 Aug 2;19(8):2263. doi: 10.3390/ijms19082263. Int J Mol Sci. 2018. PMID: 30072594 Free PMC article.
-
Localization Microscopy Analyses of MRE11 Clusters in 3D-Conserved Cell Nuclei of Different Cell Lines.Cancers (Basel). 2018 Jan 22;10(1):25. doi: 10.3390/cancers10010025. Cancers (Basel). 2018. PMID: 29361783 Free PMC article.
-
Double strand break repair functions of histone H2AX.Mutat Res. 2013 Oct;750(1-2):5-14. doi: 10.1016/j.mrfmmm.2013.07.007. Epub 2013 Jul 31. Mutat Res. 2013. PMID: 23916969 Free PMC article. Review.
-
Ionizing-radiation induced DNA double-strand breaks: a direct and indirect lighting up.Radiother Oncol. 2013 Sep;108(3):362-9. doi: 10.1016/j.radonc.2013.06.013. Epub 2013 Jul 9. Radiother Oncol. 2013. PMID: 23849169 Review.
Cited by
-
Incorporation of Low Concentrations of Gold Nanoparticles: Complex Effects on Radiation Response and Fate of Cancer Cells.Pharmaceutics. 2022 Jan 11;14(1):166. doi: 10.3390/pharmaceutics14010166. Pharmaceutics. 2022. PMID: 35057061 Free PMC article.
-
Mapping the nuclear landscape with multiplexed super-resolution fluorescence microscopy.Nat Commun. 2025 Jul 1;16(1):6042. doi: 10.1038/s41467-025-61358-0. Nat Commun. 2025. PMID: 40593784 Free PMC article.
-
Deciphering repair pathways of clustered DNA damage in human TK6 cells: insights from atomic force microscopy direct visualization.Nucleic Acids Res. 2025 Jan 7;53(1):gkae1077. doi: 10.1093/nar/gkae1077. Nucleic Acids Res. 2025. PMID: 39797694 Free PMC article.
-
Condensed Matter Systems Exposed to Radiation: Multiscale Theory, Simulations, and Experiment.Chem Rev. 2024 Jul 10;124(13):8014-8129. doi: 10.1021/acs.chemrev.3c00902. Epub 2024 Jun 6. Chem Rev. 2024. PMID: 38842266 Free PMC article. Review.
-
Factors to Consider for the Correct Use of γH2AX in the Evaluation of DNA Double-Strand Breaks Damage Caused by Ionizing Radiation.Cancers (Basel). 2022 Dec 15;14(24):6204. doi: 10.3390/cancers14246204. Cancers (Basel). 2022. PMID: 36551689 Free PMC article. Review.
References
-
- Lee J.-H., Hausmann M. Super-resolution radiation biology: From bio-dosimetry towards nano-studies of DNA repair mechanisms. In: Behzadi P., editor. DNA-Repair. Intech-Open; Rijeka, Hrvatska: 2021. - DOI
-
- Jezkova L., Zadneprianetc M., Kulikova E., Smirnova E., Bulanova T., Depes D., Falkova I., Boreyko A., Krasavin E., Davidkova M., et al. Particles with similar LET values generate DNA breaks of different complexity and reparability: A high-resolution microscopy analysis of γH2AX/53BP1 foci. Nanoscale. 2018;10:1162–1179. doi: 10.1039/C7NR06829H. - DOI - PubMed
-
- Depes D., Lee J.-H., Bobkova E., Jezkova L., Falkova I., Bestvater F., Pagacova E., Kopecna O., Zadneprianetc M., Bacikova A., et al. Single-molecule localization microscopy as a promising tool for γH2AX/53BP1 foci exploration. Eur. Phys. J. 2018;72:158. doi: 10.1140/epjd/e2018-90148-1. - DOI
-
- Falk M., Hausmann M., Lukášová E., Biswas A., Hildenbrand G., Davídková M., Krasavin E., Kleibl Z., Falková I., Ježková L., et al. Determining OMICS spatiotemporal dimensions using exciting new nanoscopy techniques to asses complex cell responses to DNA damage—PART A (Radiomics) Crit. Rev. Eukaryot. Gene Express. 2014;24:205–223. doi: 10.1615/CritRevEukaryotGeneExpr.2014010313. - DOI - PubMed
Grants and funding
LinkOut - more resources
Full Text Sources
Research Materials
Miscellaneous
