. 2021 Nov 8;13(21):5588.
doi: 10.3390/cancers13215588.

ERAS, a Member of the Ras Superfamily, Acts as an Oncoprotein in the Mammary Gland

Affiliations

ERAS, a Member of the Ras Superfamily, Acts as an Oncoprotein in the Mammary Gland

Cristian Suarez-Cabrera et al. Cancers (Basel). .

Abstract

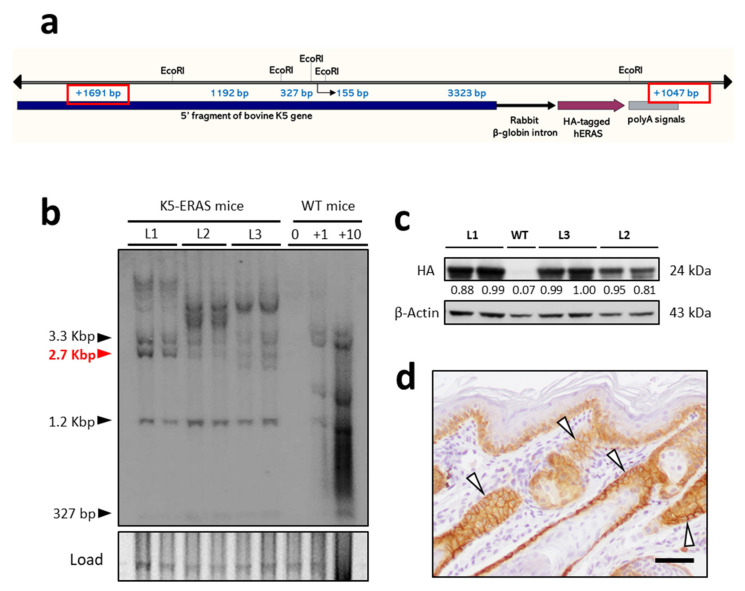
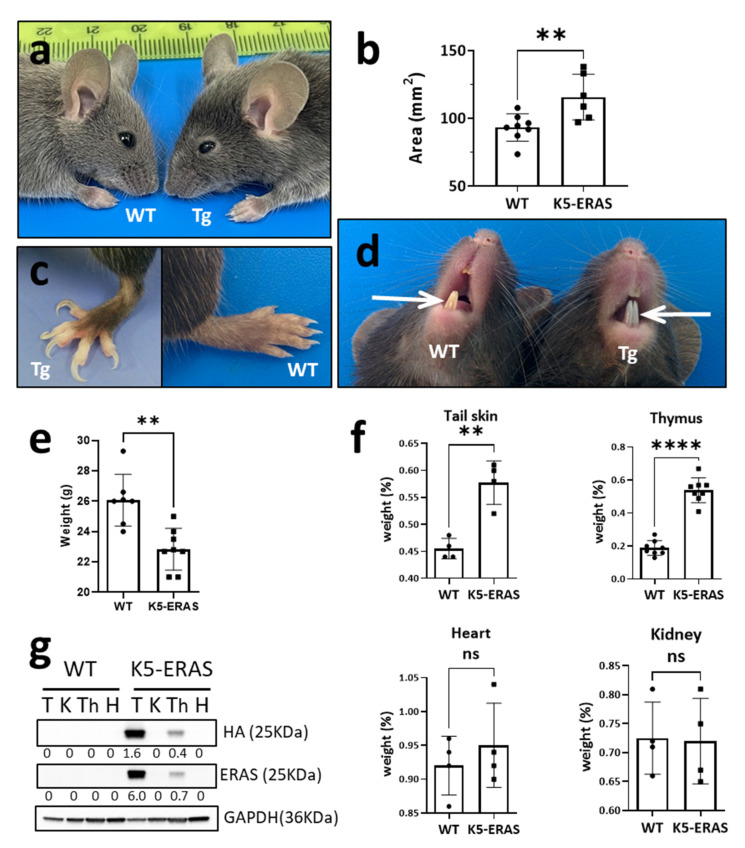
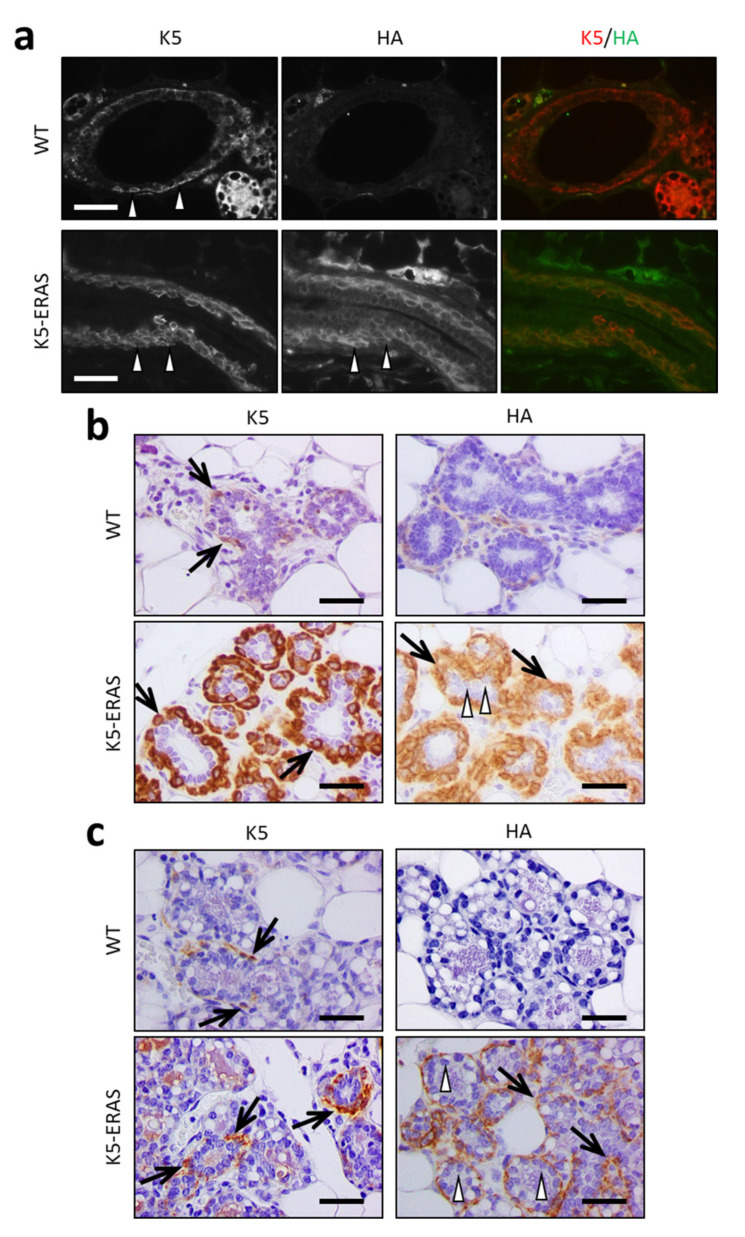
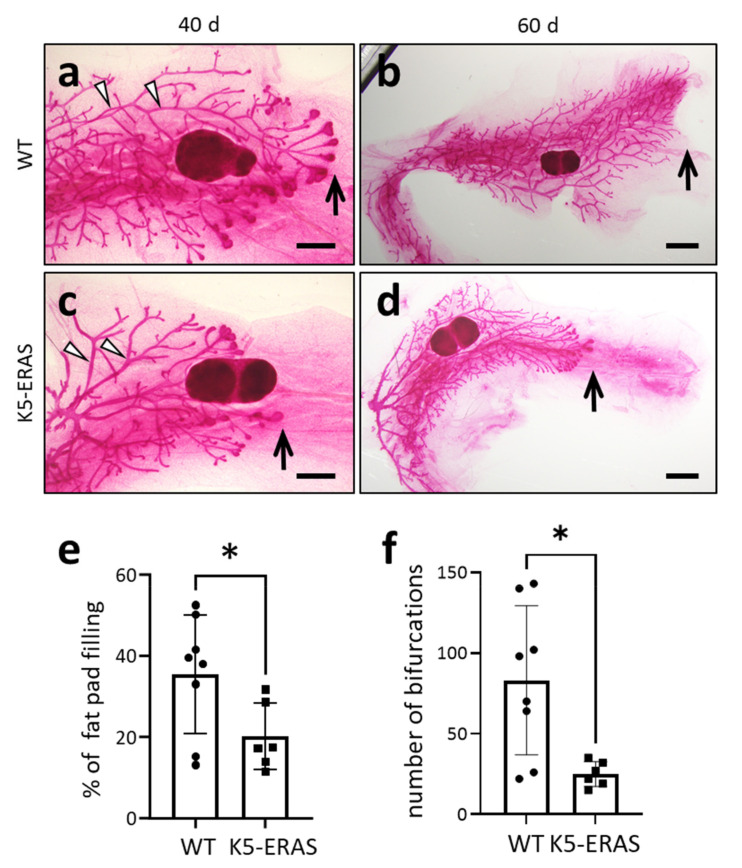
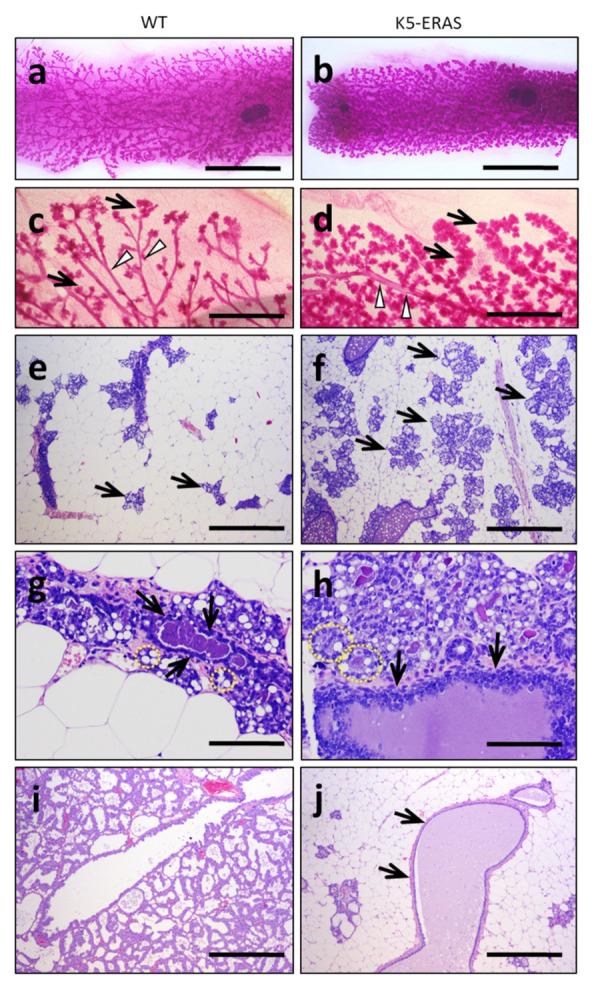
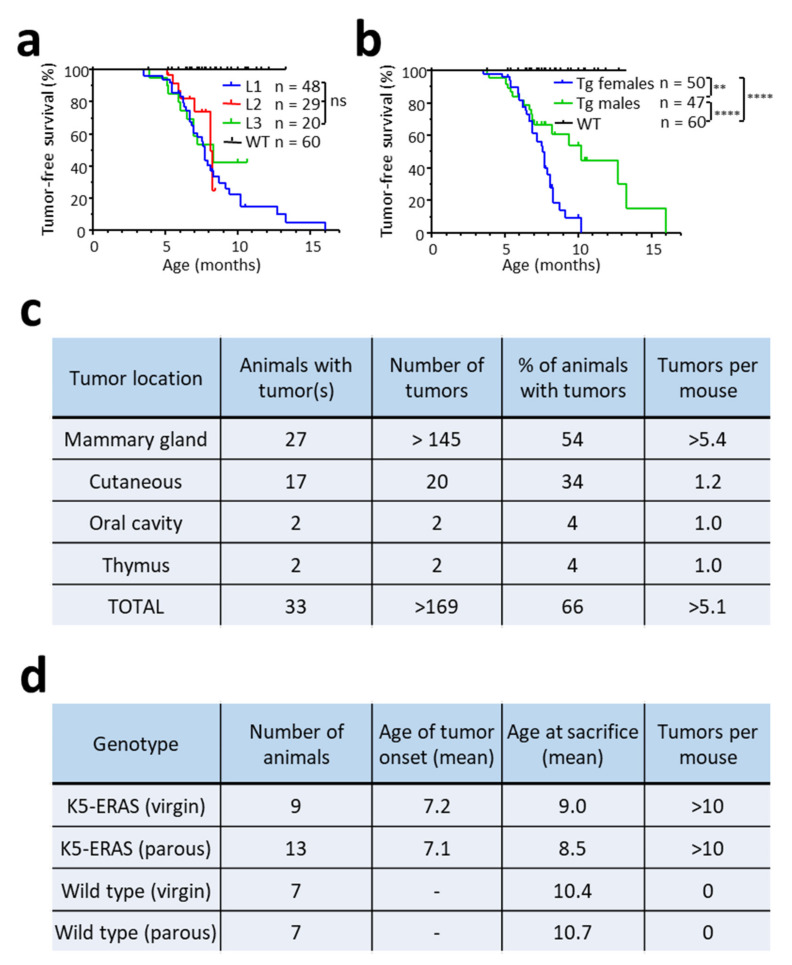
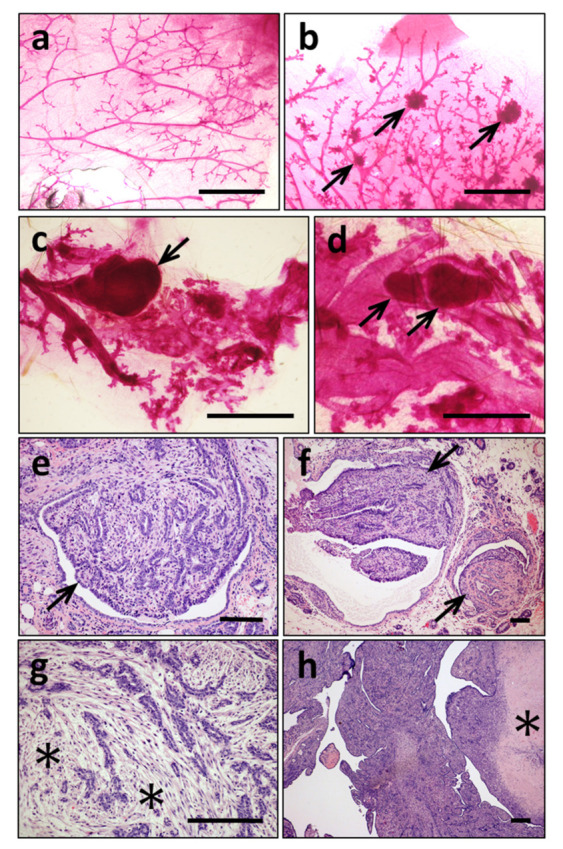
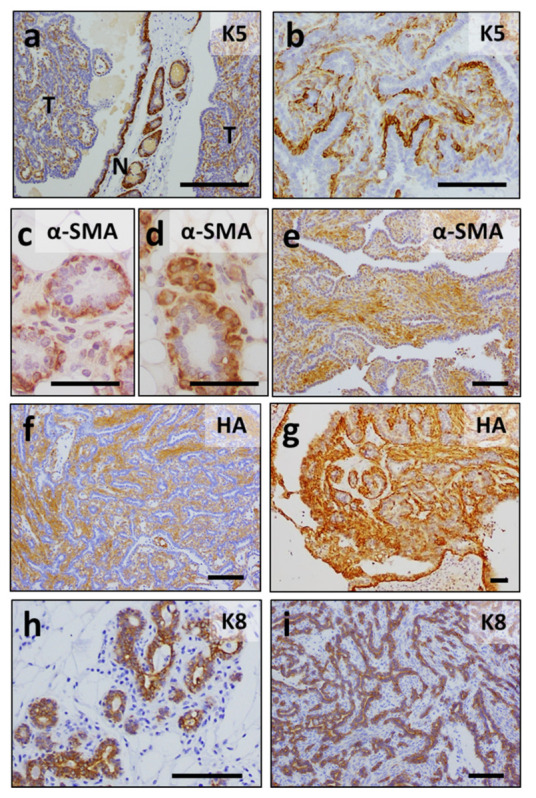
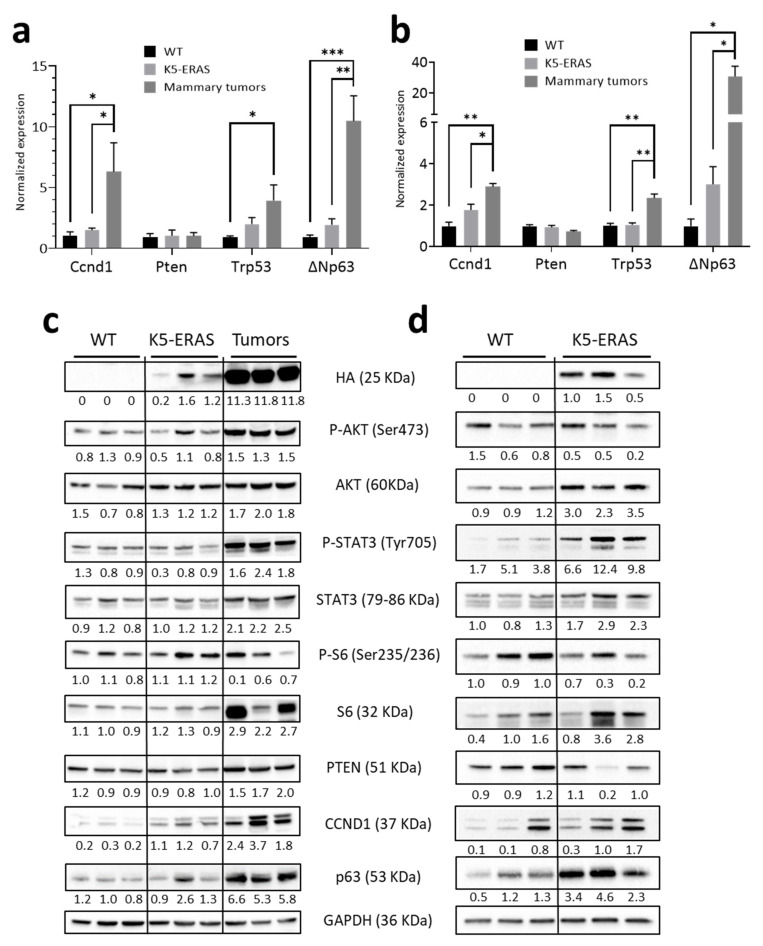
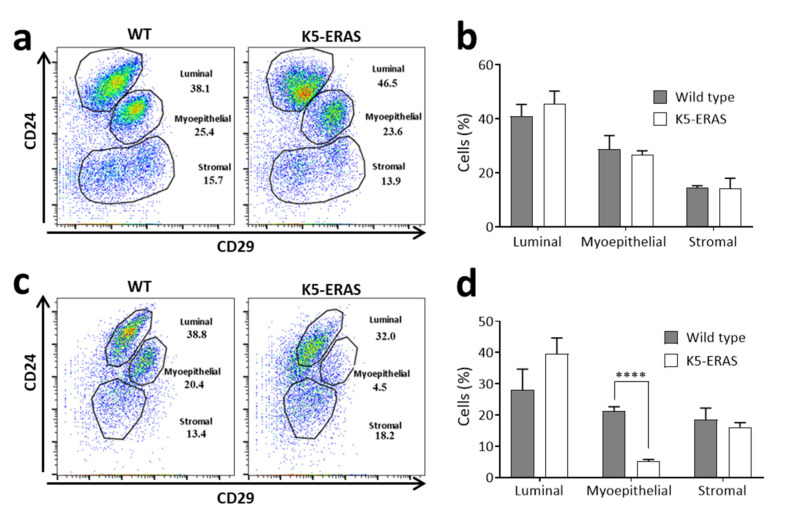
ERAS is a relatively uncharacterized gene of the Ras superfamily. It is expressed in ES cells and in the first stages of embryonic development; later on, it is silenced in the majority of cell types and tissues. Although there are several reports showing ERAS expression in tumoral cell lines and human tumor samples, it is unknown if ERAS deregulated expression is enough to drive tumor development. In this report, we have generated transgenic mice expressing ERAS in myoepithelial basal cells of the mammary gland and in basal cells of stratified epithelia. In spite of the low level of ERAS expression, these transgenic mice showed phenotypic alterations resembling overgrowth syndromes caused by the activation of the AKT-PI3K pathway. In addition, their mammary glands present developmental and functional disabilities accompanied by morphological and biochemical alterations in the myoepithelial cells. These mice suffer from tumoral transformation in the mammary glands with high incidence. These mammary tumors resemble, both histologically and by the expression of differentiation markers, malignant adenomyoepitheliomas. In sum, our results highlight the importance of ERAS silencing in adult tissues and define a truly oncogenic role for ERAS in mammary gland cells when inappropriately expressed.

Keywords: ERAS; Ras pathway; adenomyoepithelioma; breast cancer; transgenic mice.


Conflict of interest statement

The authors declare no conflict of interest. The funders had no role in the design of the study; in the collection, analyses, or interpretation of data; in the writing of the manuscript, or in the decision to publish the results.

Figures

Figure 1
Figure 1
Genetic characterization and transgene expression in K5-ERAS lines. (a) Schematic representation of the K5-ERAS transgene structure. The location of EcoRI sites and the expected fragments in a Southern blot analysis are shown. The junction of 5′- and 3′-terminal fragments (sizes framed in red) would result in a fragment of approximately 2.7 Kbp in the case of head-to-tail tandem insertion. (b) Southern blot analysis of EcoRI-digested tail DNA from two mice of each line—L1, L2 and L3—and from WT mice (lane marked 0) and WT mice with the addition of the K5-ERAS plasmid insert used to obtain the transgenic mice in amounts corresponding to 1 or 10 copies per diploid genome (lanes marked +1 and +10). The approximate mobility of each band is indicated on the left; the 2.7 Kbp band resulting from head-to-tail junctions between adjacent copies is indicated in red. As a loading control, the prominent 1.3 Kbp fragment observed in the ethidium bromide staining of the EcoRI-digested mouse DNA is shown. (c) Western blot analysis of ERAS expression in tail skin of transgenic mice. An antibody recognizing the HA epitope was used. β-Actin was used as a loading control. (d) Immunohistochemical staining of tail skin of a K5-ERAS transgenic mouse with an antibody recognizing the HA epitope. ERAS expression is detected in epidermal basal cells and in the outer root sheath of hair follicles, mimicking the expression pattern at the cellular level of keratin K5. Note that the staining is stronger in the cell membrane, which is suggestive of the functionality of transgenic ERAS. Bar: 50 μm.
Figure 2
Figure 2
Gross phenotypic characterization of K5-ERAS transgenic lines. (a) Photograph of a K5-ERAS mouse (right) and a non-transgenic littermate (left) at the age of 40 days; note the increased ear size in the transgenic mouse. (b) Ear auricle area in 40-day-old mice. ** p < 0.01. (c) Differences in the nails of 3-month-old transgenic (left) and WT mouse (right). (d) Gross alterations in the color of the incisors in K5-ERAS transgenic mice. Note the whiter appearance of the upper and lower incisors (arrows) in the Tg mouse (right) compared to the WT mouse (left). (e) Decreased body weight of transgenic mice. The mean and S.D. of the weight of eight 60-day-old WT and Tg male mice are shown. ** p < 0.01. (f) Transgenic mice showed an overgrowth of organs and structures expressing the transgene (as skin and thymus), but not of organs without K5 expression, as the heart or the kidney. Graphs represent the weight of each organ as a percentage of the weight of each mouse. ns: non-significant differences; ** p < 0.01; **** p < 0.0001. (g) Western blot analyses of the tissues studied in (f), demonstrating K5-ERAS transgene expression in tail skin and in thymus, but nor in heart and kidney. T: tail skin; K: kidney; Th: thymus; H: heart.
Figure 3
Figure 3
Mammary gland cell-type specific K5-ERAS transgene expression. (a) Immunofluorescence analysis of the expression of keratin K5 and the HA epitope (indicative of ERAS expression) in ducts from mammary glands of 10-week-old virgin animals. The genotype of the animals and the antibodies used are indicated. Note the lack of staining for the HA antibody in the mammary ducts of WT mice and the expression of both K5 and ERAS in most of the myoepithelial cells in the ducts of transgenic mice. The arrowheads point to representative K5-positive basal myoepithelial cells. (b,c) Immunohistochemical analyses of K5 and ERAS (HA epitope) expression in mammary acini of 7-month-old virgin animals (b) and of 17.5-day-pregnant females (c). The arrows point to myoepithelial cells, and the arrowheads to luminal cells. Note the co-localization of both K5 and ERAS expression in the myoepithelial cells around the acini (arrows), in contrast to the lack of expression in acinar cells (arrowheads). Myoepithelial cells in K5-ERAS females showed premalignant dysplastic changes characterized by nucleomegaly and a loss of polarity of these larger nuclei, which appeared round and perpendicular to the basal membrane of the acini in comparison to the tiny, flat nucleus disposed in parallel to the basal membrane in wild type females. Bar: 50 μm.
Figure 4
Figure 4
Delayed development of K5-ERAS mammary glands. (ad) Representative images of whole mount carmine alum staining of the 4th mammary glands of WT (a,b) and K5-ERAS (c,d) mice of 40- (a,c) and 60-day-old (b,d) female mice. Note that the terminal end buds overtook the lymph nodes (the darker, round, dense islet in the center of the images) in WT (arrow in (a)) and not in 40-day-old K5-ERAS females (arrow in (c)). Note that the mammary ducts were wider in K5-ERAS (arrowheads in (c)) than in WT females (arrowheads in (a)). In 60-day-old females, the maturation delay in K5-ERAS females persisted, since the ductal tree did not colonize the whole fat pad (arrow in (d)) as in WTs (arrow in (b)). These results were obtained studying groups of 6 WT and 5 K5-ERAS 40-day-old mice and 3 WT and 3 K5-ERAS 60-day-old mice. (e) Quantification of fat pad colonization by mammary epithelia in WT (n = 4 mice) and K5-ERAS (n = 3) 40-day-old female mice. (f) Quantification of the number of bifurcations found in the epithelial tree in 40-day-old mice * p < 0.05. Bar: 1 mm in (a,c), and 2 mm in (b,d). The arrowheads point to the mammary ducts.
Figure 5
Figure 5
Morphological alterations in K5-ERAS mammary glands in pregnancy and lactation. (ad) Whole mount carmine alum staining of mammary glands from WT (a,c) and K5-ERAS (b,d) female mice at a pregnancy age of 16.5 days. (eh) H&E staining of WT (e,g) and K5-ERAS (f,h) mammary glands of 16.5 day-pregnant female mice. (i,j) H&E staining of lactating mammary glands of a WT (i) and a K5-ERAS female mouse (j). Note the larger gross size of the acini (arrows) and ducts (arrowheads) in K5-ERAS pregnant females (d) in comparison to WT (c). Microscopically, the acini in K5-ERAS pregnant females occupied an extension of the fat pad that is double that of the WT (arrows in (e,f), respectively). See, in h, mid-transversal sections of two acini (dotted yellow circles), with a size that is double that of the equivalent sections in the WT (dotted yellow circles in (g)). Mammary ducts in K5-ERAS pregnant females showed a larger size and hyperplasia of the epithelium (arrows in h) in comparison to WT (g). In day 13 of lactation, the premature regression of the acini and the cystic dilatation of ducts by milk retention in K5-ERAS females (arrows in (j)) were evident in comparison to WT (i). Bar: 7 mm in (a,b); 2 mm in (c,d); 500 μm in (e,f,i,j); 100 μm in (g,h).
Figure 6
Figure 6
Spontaneous tumorigenesis in K5-ERAS transgenic mice. (a) Kaplan–Meier analysis of tumor-free survival in populations of wild type and transgenic mice from L1, L2 and L3 lines. This plot includes all the tumor types observed. The number of mice studied was 60 WT mice and 48, 29 and 20 transgenic mice form L1, L2 and L3 lines, respectively. The differences between transgenic lines are non-significant. (b) Tumor incidence in female and male K5-ERAS transgenic mice. ** p < 0.01; **** p < 0.0001. (c) Location of the tumors found in the group of female transgenic mice studied longitudinally. (d) Mammary tumorigenesis in multiparous and virgin K5-ERAS and WT females. Neither tumor onset nor multiplicity were affected by pregnancy.
Figure 7
Figure 7
Gross and histological analysis of mammary gland tumors in K5-ERAS female mice. (ad) Whole mount carmine alum staining of mammary glands of WT mice (a) and of K5-ERAS mice (bd); K5-ERAS samples show multiple tumors associated to epithelial ducts and acini (arrows in bd). In (c) and (d), larger tumoral structures are seen growing inside dilated mammary ducts. (eh) Representative histological features of mammary tumors in K5-ERAS female mice. (e,f) Intraductal carcinomas with overgrowth of myoepithelial cells (myoepitheliomas). (g,h) Larger myoepitheliomas showed extensive stromal hyalinization (asterisks in (g)) or necrotic regions (asterisk in (h)). Bar: 2 mm in (ac); 1 mm in (d) and 100 μm in (eh).
Figure 8
Figure 8
Immunohistochemical analyses of K5-ERAS mammary gland tumors. (ai) Immunohistochemical staining of non-tumoral mammary gland ((c,d,h), and region marked N in (a)), tumoral samples ((b,eg,i) and regions marked T in (a)) of K5-ERAS transgenic (a,b,dg,i) and non-tumoral sample of 7-month-old WT mice (c,h) using antibodies specific for the indicated epitopes. Note the expression of K5 (a,b) and α-SMA (e) in K5-ERAS tumors, confirming their myoepithelial origin, as well as the co-localized expression of ERAS (HA epitope) (f,g), while acinar cells expressed K8 (i). Bar: 100 μm except for (c,d) (50 μm).
Figure 9
Figure 9
Biochemical characterization of K5-ERAS mammary glands and tumors. (a,b) RT-qPCR analyses of the expression of genes implicated in proliferation and tumoral transformation in mammary glands of 17.5-day pregnant WT and K5-ERAS mice, as well as in K5-ERAS mammary tumors (a) and in virgin mammary glands (b). (c) Western blot analysis of three different samples of mammary glands from 17.5-day pregnant WT and K5-ERAS mice, and of K5-ERAS mammary tumors. (d) Similar study in mammary glands from virgin animals. In (c,d), phosphoproteins are normalized against the corresponding total proteins. We used between 3 and 5 samples of each genotype for the results included in (a) and three samples per genotype in (b). * p < 0.05; ** p < 0.01; *** p < 0.001.
Figure 10
Figure 10
Flow cytometry study of cell-surface markers in K5-ERAS mammary cells. (a,b) Analysis of CD24 and CD29 expression in the mammary cell population negative for hematopoietic, erythroid and endothelial linage markers in 10-week-old virgin female mice. (a) Example of the population distribution in one WT and one K5-ERAS female mouse; (b) mean and standard deviation of the data obtained from four mice of each genotype. The differences observed are statistically non-significant. (c,d) The same analyses were performed in 7-month-old virgin female mice. (c) Representative plot of one WT and one K5-ERAS female mouse; (d) mean and SD of four different mice of each genotype. **** p < 0.0001.

Similar articles

References

    1. Bos J.L., Rehmann H., Wittinghofer A. GEFs and GAPs: Critical Elements in the Control of Small G Proteins. Cell. 2007;129:865–877. doi: 10.1016/j.cell.2007.05.018. - DOI - PubMed
    1. Sanchez-Vega F., Mina M., Armenia J., Chatila W.K., Luna A., La K.C., Dimitriadoy S., Liu D.L., Kantheti H.S., Saghafinia S., et al. Oncogenic Signaling Pathways in The Cancer Genome Atlas. Cell. 2018;173:321–337. doi: 10.1016/j.cell.2018.03.035. - DOI - PMC - PubMed
    1. Prior I.A., Hood F.E., Hartley J.L. The Frequency of Ras Mutations in Cancer. Cancer Res. 2020;80:2969–2974. doi: 10.1158/0008-5472.CAN-19-3682. - DOI - PMC - PubMed
    1. Cox A.D., Der C.J. Ras history: The saga continues. Small GTPases. 2010;1:2–27. doi: 10.4161/sgtp.1.1.12178. - DOI - PMC - PubMed
    1. Takahashi K., Mitsui K., Yamanaka S. Role of ERas in promoting tumour-like properties in mouse embryonic stem cells. Nat. Cell Biol. 2003;423:541–545. doi: 10.1038/nature01646. - DOI - PubMed

LinkOut - more resources