. 2021 Oct 27;14(21):6434.
doi: 10.3390/ma14216434.

Highly Conducting Li(Fe1- xMnx)0.88V0.08PO4 Cathode Materials Nanocrystallized from the Glassy State (x = 0.25, 0.5, 0.75)

Affiliations

Highly Conducting Li(Fe1- xMnx)0.88V0.08PO4 Cathode Materials Nanocrystallized from the Glassy State (x = 0.25, 0.5, 0.75)

Justyna E Frąckiewicz et al. Materials (Basel). .

Abstract

This study showed that thermal nanocrystallization of glassy analogs of LiFe1-xMnxPO4 (with the addition of vanadium for improvement of glass forming properties) resulted in highly conducting materials that may be used as cathodes for Li-ion batteries. The glasses and nanomaterials were studied with differential thermal analysis, X-ray diffractometry, and impedance spectroscopy. The electrical conductivity of the nanocrystalline samples varied, depending on the composition. For x=0.5, it exceeded 10-3 S/cm at room temperature with an activation energy as low as 0.15 eV. The giant and irreversible increase in the conductivity was explained on the basis of Mott's theory of electron hopping and a core-shell concept. Electrochemical performance of the active material with x=0.5 was also reported.

Keywords: cathode materials; electron hopping; high conductivity; nanocrystallization; olivine.


Conflict of interest statement

The authors declare no conflict of interest.

Figures

Figure 1
Figure 1
DTA curves for Li(Fe1xMnx)0.88V0.08PO4 glasses measured in argon flow with a heating rate 10 °C/min. © The Electrochemical Society. Reproduced from Ref. [12] by permission of IOP Publishing. All rights reserved.
Figure 2
Figure 2
XRD patterns for synthesized Li(Fe1xMnx)0.88V0.08PO4 samples measured at room temperature. Diffraction lines ascribed to Li(Fe0.25Mn0.75)PO4 reference pattern (ICDD card no. 04-024-8018) are marked with hearts.
Figure 3
Figure 3
Temperature-dependent XRD patterns for Li(Fe1xMnx)0.88V0.08PO4 samples upon heating to 580 °C in nitrogen flow. Reference patterns for LiFePO4 (LFP), LiMnPO4 (LMP), and Li3V2(PO4)3 (LVP) are given below. Figure (b) reproduced from Ref. [12] by permission of IOP Publishing. © The Electrochemical Society. All rights reserved.
Figure 3
Figure 3
Temperature-dependent XRD patterns for Li(Fe1xMnx)0.88V0.08PO4 samples upon heating to 580 °C in nitrogen flow. Reference patterns for LiFePO4 (LFP), LiMnPO4 (LMP), and Li3V2(PO4)3 (LVP) are given below. Figure (b) reproduced from Ref. [12] by permission of IOP Publishing. © The Electrochemical Society. All rights reserved.
Figure 4
Figure 4
A comparison of the room temperature XRD patterns after heat-treatment at 580 °C for x=0.25, 0.5, and 0.75. Reference patterns of Li(Fe0.75Mn0.25)PO4 (x=0.25, at the bottom, ICDD card no. 00-066-0406) and Li(Fe0.25Mn0.75)PO4 (x=0.75, at the top, ICDD card no. 04-024-8018) are provided for comparison. Major reflexes assigned to impurity phases are marked as follows: circle–Li3V2(PO4)3 (CIF no. 4124523), asterisk–Fe2O3 (ICSD card no. 98-005-6372), diamond–V2O5 (ICDD card no. 04-006-5671).
Figure 5
Figure 5
Dependence of electrical conductivity of samples with x = 0.25, 0.5, and 0.75 upon heating to 480 °C (red ramps) and subsequent cooling down to room temperature (blue ramps). The red and blue values of the conductivity were measured at 25 °C and are given for the starting materials and the samples after nanocrystallization, respectively. Corresponding DTA curves (green lines, shown in arbitrary units) measured with heating rate 10 °C/min are given for comparison.
Figure 6
Figure 6
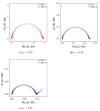
Examples of impedance (Nyquist) plots for selected samples acquired at isothermal conditions at ca. 250 °C upon the heating ramp.
Figure 7
Figure 7
(a) Charge/discharge curves of a lithium cell made of the nanocrystallized sample with x = 0.5 measured at different rates. (b) Cyclability of the cell. (c) Cyclic voltammogram of the cell for 5 cycles measured at the scanning rate of 0.05 mV/s.
Figure 8
Figure 8
HR-TEM image of a sample with x=0.5 nanocrystallized at 480 °C. The visible area is 50 nm × 50 nm.

References

    1. Reddy M.V., Mauger A., Julien C.M., Paolella A., Zaghib K. Brief History of Early Lithium-Battery Development. Materials. 2020;13:1884. doi: 10.3390/ma13081884. - DOI - PMC - PubMed
    1. Lewis G.N., Keyes F.G. The potential of the lithium electrode. J. Am. Chem. Soc. 1913;35:340–344. doi: 10.1021/ja02193a004. - DOI
    1. Padhi A.K., Nanjundaswamy K.S., Goodenough J.B. Phospho-olivines as Positive-Electrode Materials for Rechargeable Lithium Batteries. J. Electrochem. Soc. 1997;144:1188. doi: 10.1149/1.1837571. - DOI
    1. Ling J., Karuppiah C., Krishnan S.G., Reddy M.V., Misnon I.I., Rahim M.H.A., Yang C., Jose R. Phosphate Polyanion Materials as High-Voltage Lithium-Ion Battery Cathode: A Review. Energy Fuels. 2021;35:10428–10450. doi: 10.1021/acs.energyfuels.1c01102. - DOI
    1. Herrera J.O., Camacho-Montes H., Fuentes L.E., Lvarez-Contreras L. LiMnPO4: Review on Synthesis and Electrochemical Properties. J. Mater. Sci. Chem. Eng. 2015;3:54.

LinkOut - more resources