. 2021 Nov 12;19(1):85.
doi: 10.1186/s12959-021-00329-z.

Prognostic value of characteristics of plaque combined with residual syntax score among patients with STEMI undergoing primary PCI: an intravascular optical coherence tomography study

Affiliations

Prognostic value of characteristics of plaque combined with residual syntax score among patients with STEMI undergoing primary PCI: an intravascular optical coherence tomography study

Xiaoxiao Zhao et al. Thromb J. .

Abstract

Aim: The present study aimed to explore these characteristics, particularly thin-cap fibroatheroma (TCFA), in relation to residual syntax score (rSS) in patients who presented with acute MI.

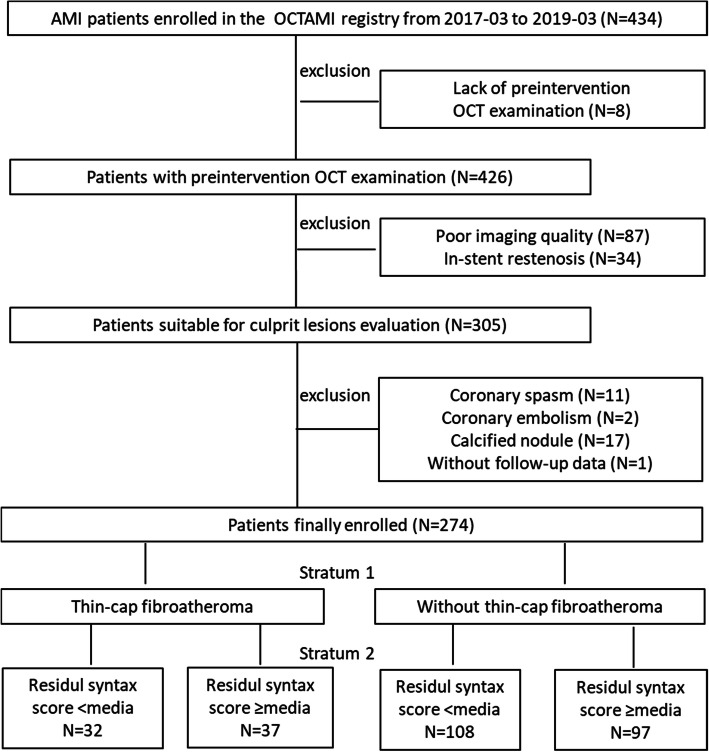
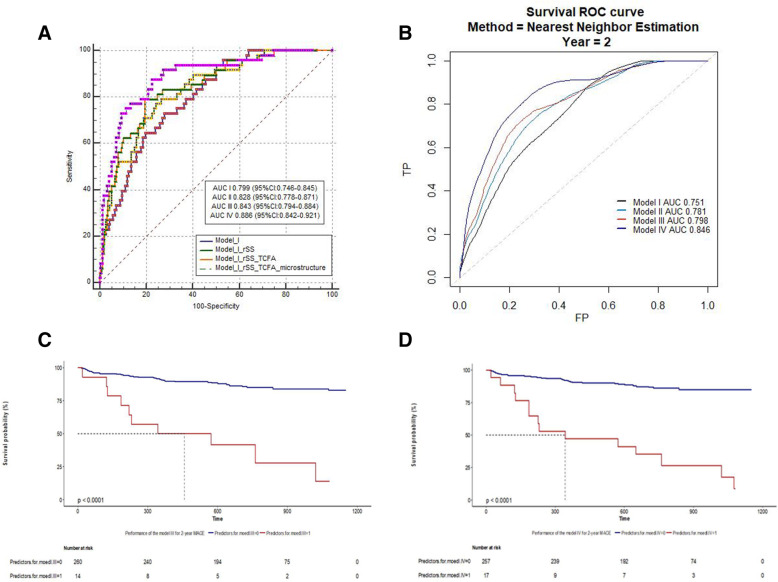
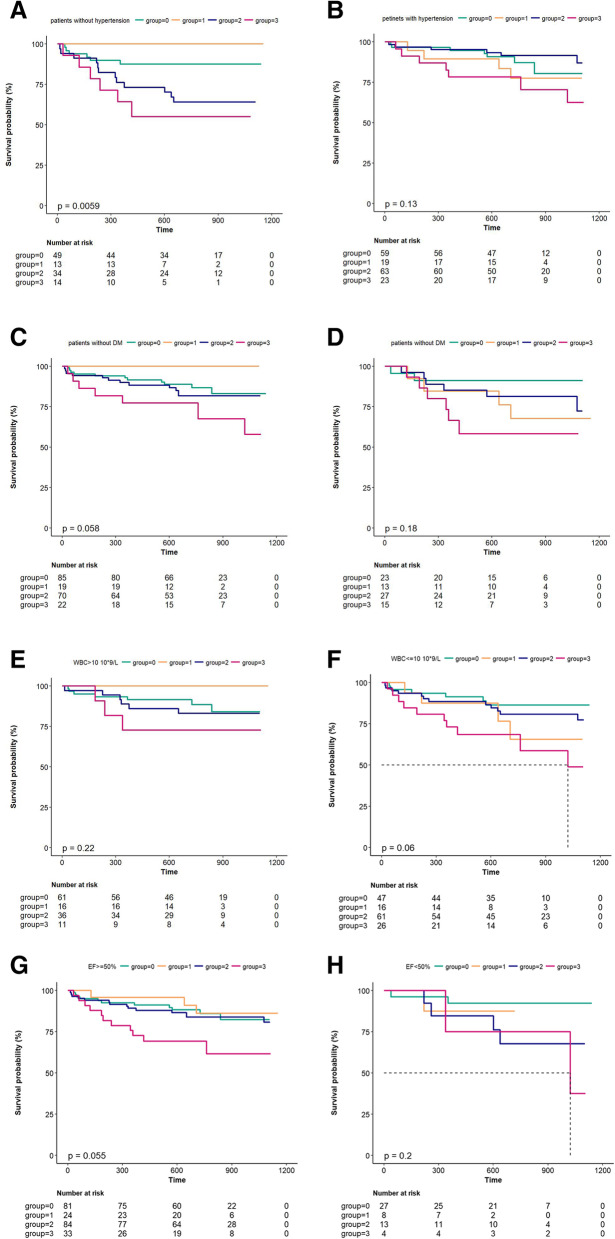
Methods and outcomes: A total of 434 consecutive patients with MI aged ≥18 years who had STEMI underwent primary PCI. Notably, compared with other subgroups, the presence of TCFA in culprit lesions and a higher level of rSS, were significantly associated with MACE. When rSS was divided into three groups, high rSS levels were associated with a higher incidence of MACE, in the subgroups of without TCFA (P = 0.005), plaque erosion (P = 0.045), macrophage infiltration (P = 0.026), and calcification (P = 0.002). AUC of ROC curve was 0.794 and 0.816, whereas the AUC of the survival ROC was 0.798 and 0.846.

Conclusion: The results of this study could be used in clinical practice to support risk stratification.

Trial registration: This study was registered at ClinicalTrials.gov as NCT03593928 .

Keywords: Optical coherence tomography; Prognosis value; Residual syntax score; Thin-cap fibroatheroma.


Conflict of interest statement

  1. Non-financial competing interests.

  2. Non-financial competing interests include family associations, political, religious, academic or any other.

Figures

Fig. 1
Fig. 1
Representative cross-sectional optical coherence tomography images. A Thin-cap fibroatheroma was defined as a lipid-rich plaque (lipid identified as signal poor and attenuating) of more than two quadrants of vessel lumen with a fibrous cap (identified as signal rich, or brightly reflecting, with low attenuation) thickness measuring 65 um or less. (arrow). B Lipid plaque (arrow) most often appears as diffusely bordered, signal-poor regions with overlying signal-rich bands. C Calcification identified by the presence of a well-delineated, low-backscattering heterogeneous region (asterisk). D Plaque rupture identified by disruption of the fibrous cap and cavity formation (asterisk). E Plaque erosion identified by the presence of attached thrombus (asterisk) overlying an intact plaque. F Microvessels defined as tubule luminal structures that do not generate a signal, with no connection to the vessel lumen (arrow). G Red thrombus consists mainly of red blood cells; relevant OCT images are characterized as high-backscattering protrusions with signal free shadowing (asterisk). H. Cholesterol crystal (arrow) identified by linear, highly backscattering structures without remarkable backward shadowing
Fig. 2
Fig. 2
Flow chart 2 Study flow chart. OCTAMI, Optical Coherence Tomography Examination in Acute Myocardial Infarction; OCT optical coherence tomography, AMI acute myocardial infarction
Fig. 3
Fig. 3
ROC curve, survival ROC curve for rSS with traditional risk factors, TCFA and microstructure of culprit lesion by OCT in predicting 2-year MACE and K-M curve of performance of the model III and IV. A, Model I, predictor of traditional risk factors including sex, age, ejection fraction, hypertension, hyperlipidemia, diabetes mellitus, history of myocardial infarction, history of PCI, history of CABG, Killip classification, cTnI of baseline, peak level of cTnI, brain natriuretic peptide (BNP) of baseline, peak level of BNP, white blood cell, hemoglobin, platelet, creatine kinase, glucose, glycosylated hemoglobin, C-reactive protein, total cholesterol, triglyceride, low density lipoprotein, high density lipoprotein, triglyceride/ low density lipoprotein, lipse activator, aspirin, Ticagrelor, clopidogrel. Model II, Model I plus rSS. Model III, Model II plus TCFA. Model IV, Model III plus microstructure of culprit lesion by OCT including macrophage, thrombus, plaque rupture or erosion, mixed plaque, lipid plaque, fibrous plaque, calcification, max lipid-arc, fibrous cap thickness, minimal lumen area, micro-vessels. AUC, areas under the ROC curve; CI, 95% confidence interval. B Survival ROC curve, the confounding factors of model I, II, III, IV are as same as the (A). C Model III cutoff value=0.5970; 0, predictors of model III< cutoff value; 1, predictors of model III≥ cutoff value; D Model IV cutoff value=0.6493. 0, predictors of model III< cutoff value; 1, predictors of model III≥ cutoff value
Fig. 4
Fig. 4
Kaplan-Meier curves showing cumulative MACE rates for up to median 1.98 years stratified by the level of rSS and TCFA characteristic among subgroups. Group=0 represent the patients with low level of rSS (rSS≤4) and without characteristic of TCFA in the culprit lesion. Group=1 represent the patients with low level of rSS (rSS≤4) and characteristic of TCFA in the culprit lesion. Group=2 represent the patients with low level of rSS (rSS>4) and without characteristic of TCFA in the culprit lesion. Group=3 represent the patients with low level of rSS (rSS>4) and characteristic of TCFA in the culprit lesion. DM, diabetes mellitus; WBC, white blood cell; EF, ejective fraction. A Kaplan-Meier curves showing cumulative MACE rates stratified by the level of rSS and TCFA among subgroups without hypertension. B Kaplan-Meier curves showing cumulative MACE rates stratified by the level of rSS and TCFA among subgroups with hypertension. C Kaplan-Meier curves showing cumulative MACE rates stratified by the level of rSS and TCFA among subgroups without DM. D Kaplan-Meier curves showing cumulative MACE rates stratified by the level of rSS and TCFA among subgroups with DM. E Kaplan-Meier curves showing cumulative MACE rates stratified by the level of rSS and TCFA among subgroups WBC>10 10*9/L. F Kaplan-Meier curves showing cumulative MACE rates stratified by the level of rSS and TCFA among subgroups WBC≤10 10*9/L. G Kaplan-Meier curves showing cumulative MACE rates stratified by the level of rSS and TCFA among subgroups of EF≥50%. H Kaplan-Meier curves showing cumulative MACE rates stratified by the level of rSS and TCFA among subgroups of EF<50%

References

    1. Genereux P, Palmerini T, Caixeta A, et al. Quantification and impact of untreated coronary artery disease after percutaneous coronary intervention: the residual SYNTAX (synergy between PCI with Taxus and cardiac surgery) score. J Am Coll Cardiol. 2012;59:2165–2174. doi: 10.1016/j.jacc.2012.03.010. - DOI - PMC - PubMed
    1. Farooq V, Serruys PW, Bourantas CV, et al. Quantification of incomplete revascularization and its association with five-year mortality in the synergy between percutaneous coronary intervention with taxus and cardiac surgery (SYNTAX) trial validation of the residual SYNTAX score. Circulation. 2013;128:141–151. doi: 10.1161/CIRCULATIONAHA.113.001803. - DOI - PubMed
    1. Serruys PW, Morice MC, Kappetein AP, et al. Percutaneous coronary intervention versus coronary-artery bypass grafting for severe coronary artery disease. N Engl J Med. 2009;360:961–972. doi: 10.1056/NEJMoa0804626. - DOI - PubMed
    1. Malkin CJ, George V, Ghobrial MS, et al. Residual SYNTAX score after PCI for triple vessel coronary artery disease: quantifying the adverse effect of incomplete revascularisation. EuroIntervention. 2013;8:1286–1295. doi: 10.4244/EIJV8I11A197. - DOI - PubMed
    1. Park KW, Kang J, Kang SH, et al. The impact of residual coronary lesions on clinical outcomes after percutaneous coronary intervention: residual SYNTAX score after percutaneous coronary intervention in patients from the efficacy of Xience/ Promus versus cypher in rEducing late loss after stENTing (EXCELLENT) registry. Am Heart J. 2014;167:384–92.e5. doi: 10.1016/j.ahj.2013.09.015. - DOI - PubMed

Associated data