. 2021 Nov 12;14(1):191.
doi: 10.1186/s13045-021-01193-0.

Polymorphonuclear myeloid-derived suppressor cells impair the anti-tumor efficacy of GD2.CAR T-cells in patients with neuroblastoma

Affiliations

Polymorphonuclear myeloid-derived suppressor cells impair the anti-tumor efficacy of GD2.CAR T-cells in patients with neuroblastoma

Nicola Tumino et al. J Hematol Oncol. .

Abstract

The outcome of patients affected by high-risk or metastatic neuroblastoma (NB) remains grim, with ≥ 50% of the children experiencing relapse or progression of the disease despite multimodal, intensive treatment. In order to identify new strategies to improve the overall survival and the quality of life of these children, we recently developed and optimized a third-generation GD2-specific chimeric antigen receptor (CAR) construct, which is currently under evaluation in our Institution in a phase I/II clinical trial (NCT03373097) enrolling patients with relapsed/refractory NB. We observed that our CAR T-cells are able to induce marked tumor reduction and even achieve complete remission with a higher efficiency than that of other CAR T-cells reported in previous studies. However, often responses are not sustained and relapses occur. Here, we demonstrate for the first time a mechanism of resistance to GD2.CAR T-cell treatment, showing how polymorphonuclear myeloid-derived suppressor cells (PMN-MDSC) increase in the peripheral blood (PB) of NB patients after GD2.CAR T-cell treatment in case of relapse and loss of response. In vitro, isolated PMN-MDSC demonstrate to inhibit the anti-tumor cytotoxicity of different generations of GD2.CAR T-cells. Gene-expression profiling of GD2.CAR T-cells "conditioned" with PMN-MDSC shows downregulation of genes involved in cell activation, signal transduction, inflammation and cytokine/chemokine secretion. Analysis of NB gene-expression dataset confirms a correlation between expression of these genes and patient outcome. Moreover, in patients treated with GD2.CAR T-cells, the frequency of circulating PMN-MDSC inversely correlates with the levels of GD2.CAR T-cells, resulting more elevated in patients who did not respond or lost response to the treatment. The presence and the frequency of PMN-MDSC in PB of high-risk and metastatic NB represents a useful prognostic marker to predict the response to GD2.CAR T-cells and other adoptive immunotherapy. This study underlines the importance of further optimization of both CAR T-cells and clinical trial in order to target elements of the tumor microenvironment.

Keywords: Clinical response; GD2.CAR T-cells; Long-term response; Neuroblastoma; Polymorphonuclear myeloid-derived suppressor cells; T-cell functionality.


Conflict of interest statement

The authors declare that they have no competing interests.

Figures
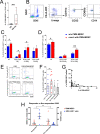
Fig. 1
Fig. 1
Presence of PMN-MDSC in PB of NB patients and their effect on GD2.CAR T-cells. A, B Mononuclear cells isolated from the PB of NB patients were analyzed by flow-cytometry for the expression of specific markers allowing the identification of PMN-MDSC subsets. A Percentages of PMN-MDSC on CD45+cells (CD66b+CD14cells) in healthy donors (HD, n = 10) and in NB patients (NB pts, n = 9). B A representative gating strategy for PMN-MDSC identification by flow-cytometry is shown. C, D Second- and third-generation GD2.CAR T-cells were cultured either in the absence (w/o, blue bars) or in the presence (cond, red bars) of PMN-MDSC collected from stem cell donors given G-CSF and undergoing to leukapheresis. After 48h, GD2.CAR T-cells and non-transduced (NT) cells (used as control) were collected, purified and co-cultured at the effector:target ratio 1:1 with the SH-SY5Y-eGFP+ NB cell line. Percentages of SH-SY5Y-eGFP+ NB residual live cells at day 5 of co-culture with (C) second- (n = 10) and D third- (n = 10) generation GD2.CAR T-cells are reported. Patient derived GD2.CAR T-cells expressing CD28.4-1BBζ (the same used in our clinical trial) were cultured in the presence of PB-derived (n = 8) or BM-derived (n = 3) PMN-MDSC or PB-derived neutrophils (n = 3) collected from NB patients. After 48h, GD2.CAR T-cells were collected, purified from PMN-MDSC/neutrophils as described in supplementary data (Additional file 6), and co-cultured at an Effector:Target (E/T) ratio 1:1 with SH-SY5Y-eGFP+ NB cell line for 3 days. Percentages of SH-SY5Y-eGFP+ NB residual live cells were analyzed. E One representative co-culture experiment of GD2.CAR T-cells and PMN-MDSC is shown. F Percentages of residual live NB tumor cells in different culture conditions is reported. G Correlation between PMN-MDSC and GD2.CAR T-cells in CD45+ cells in NB patients (n = 55, different time point after GD2.CAR T-cell infusion), r2 = 0.07 and p value is indicated. Mononuclear cells present in the PB of NB patients were analyzed by flow-cytometry. Graphs represent percentages of PMN-MDSC and the corresponding absolute number/µl of GD2.CAR T-cells in NB patients. H Graphs represent GD2.CAR T-cells/µl (blue squares) and the percentages of PMN-MDSC (red dots) in CD45+ cells in responder (n = 5) and non-responder (n = 6) patients (multiple comparison with mixed-effect analysis). *p < 0.05, **p < 0.01, ***p < 0.005. Where not indicated, data were not statistically significant. A Mann–Whitney and C, D, F Wilcoxon Student’s t test. Data are shown as mean ± standard error of the mean (SEM)
Fig. 2
Fig. 2
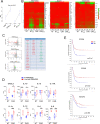
PMN-MDSC induce modulation of the gene-expression profile and inhibit cytokine secretion of GD2.CAR T-cells. AC NT and GD2.CAR T-cells were cultured for 48h either in the absence or in the presence (cond.) of PMN-MDSC (NT n = 3; GD2.CAR T-cells n = 3). A Gene expression level (Rq) represented as mean plot with the 95% of confidence interval for the total gene analyzed in NT and GD2.CAR T-cells conditioned or not with PMN-MDSC. B Heat-maps representing the unsupervised hierarchical clustering of samples analyzed for inflammation, kinome and signal transduction gene-expression profile. Columns represent samples (NT and GD2.CAR T-cells), rows represent genes. C Volcano plots show inflammation, kinome and signal transduction gene expression data. The red or green dots indicate genes-of-interest that display highly positive or negative fold-change (x axis) and high statistical significance (− log10 of p value, y axis). The gene name related to a red and green dot is reported in the table (right panel). D Levels (pg/ml) of the indicated cytokines/chemokines in the supernatant of NT (n = 6) and GD2.CAR T-cells (n = 12) conditioned (red) or not (blue) with PMN-MDSC are shown. E Kaplan–Meier curves estimate of overall survival of HR-NB patients according to the level of S100A8 or S100A9 or TNFAIP6 gene expression. Red (low) and blue (high) lines indicate the level of gene expression using median cut-off modus. Dataset used for the analysis is indicated. One-way ANOVA was used for statistical analysis. *p < 0.05, **p < 0.01, ***p < 0.005

References

    1. Park JH, Riviere I, Gonen M, Wang X, Senechal B, Curran KJ, et al. Long-term follow-up of CD19 CAR therapy in acute lymphoblastic leukemia. N Engl J Med. 2018;378(5):449–459. doi: 10.1056/NEJMoa1709919. - DOI - PMC - PubMed
    1. Louis CU, Savoldo B, Dotti G, Pule M, Yvon E, Myers GD, et al. Antitumor activity and long-term fate of chimeric antigen receptor-positive T cells in patients with neuroblastoma. Blood. 2011;118(23):6050–6056. doi: 10.1182/blood-2011-05-354449. - DOI - PMC - PubMed
    1. Thistlethwaite FC, Gilham DE, Guest RD, Rothwell DG, Pillai M, Burt DJ, et al. The clinical efficacy of first-generation carcinoembryonic antigen (CEACAM5)-specific CAR T cells is limited by poor persistence and transient pre-conditioning-dependent respiratory toxicity. Cancer Immunol Immunother. 2017;66(11):1425–1436. doi: 10.1007/s00262-017-2034-7. - DOI - PMC - PubMed
    1. Heczey A, Louis CU, Savoldo B, Dakhova O, Durett A, Grilley B, et al. CAR T cells administered in combination with lymphodepletion and PD-1 inhibition to patients with neuroblastoma. Mol Ther. 2017;25(9):2214–2224. doi: 10.1016/j.ymthe.2017.05.012. - DOI - PMC - PubMed
    1. Long AH, Highfill SL, Cui Y, Smith JP, Walker AJ, Ramakrishna S, et al. Reduction of MDSCs with all-trans retinoic acid improves CAR therapy efficacy for sarcomas. Cancer Immunol Res. 2016;4(10):869–880. doi: 10.1158/2326-6066.CIR-15-0230. - DOI - PMC - PubMed

Publication types

MeSH terms

Associated data