. 2021 Dec 15;207(12):3122-3130.
doi: 10.4049/jimmunol.2001152. Epub 2021 Nov 12.

Leptin Augments Antitumor Immunity in Obesity by Repolarizing Tumor-Associated Macrophages

Affiliations

Leptin Augments Antitumor Immunity in Obesity by Repolarizing Tumor-Associated Macrophages

Stephanie O Dudzinski et al. J Immunol. .

Abstract

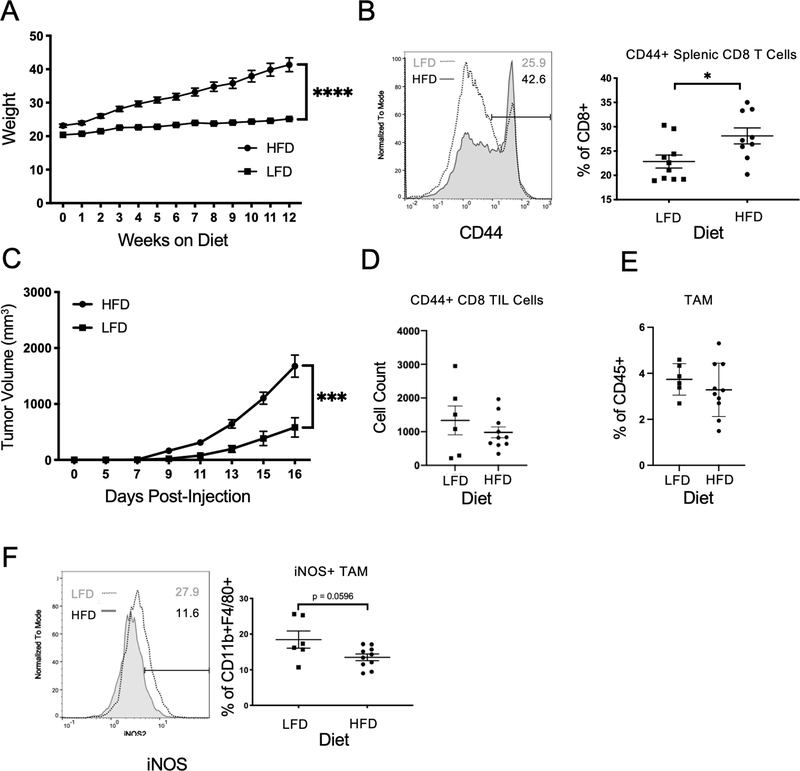
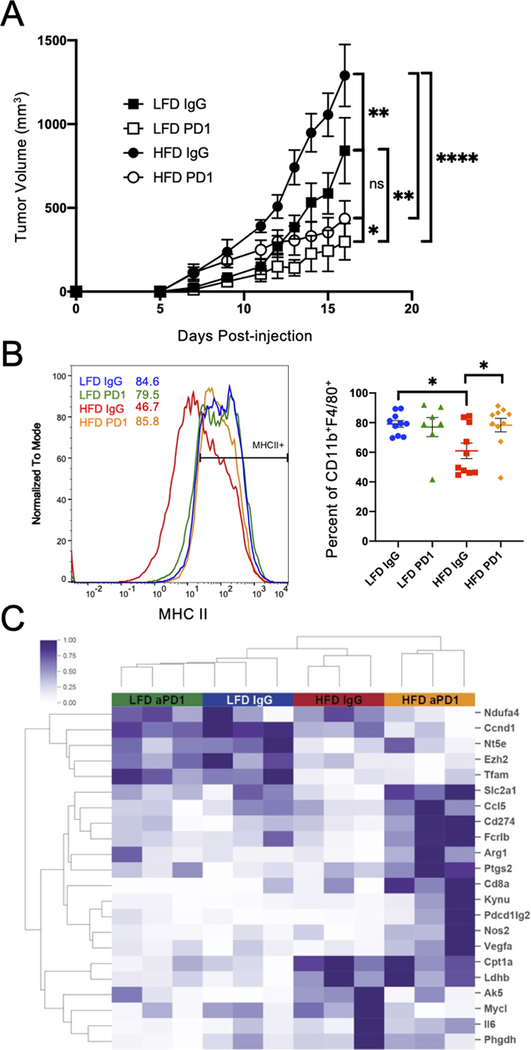
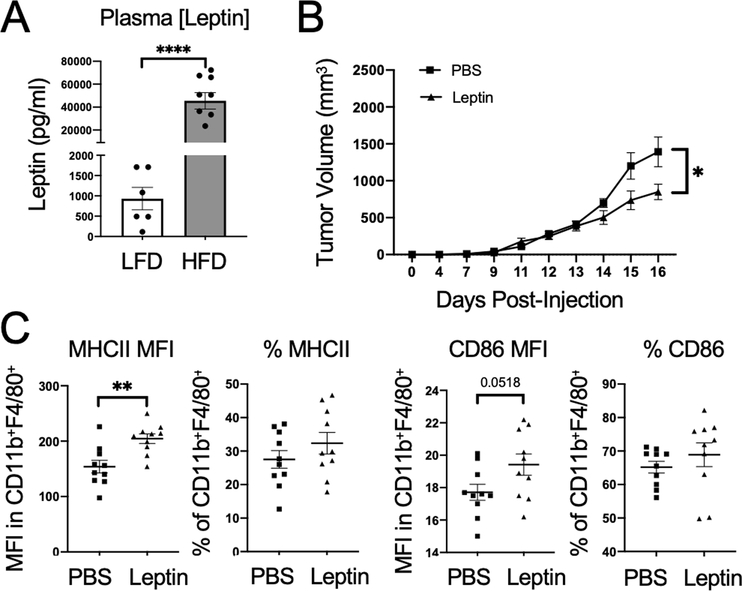
Although obesity can promote cancer, it may also increase immunotherapy efficacy in what has been termed the obesity-immunotherapy paradox. Mechanisms of this effect are unclear, although obesity alters key inflammatory cytokines and can promote an inflammatory state that may modify tumor-infiltrating lymphocytes and tumor-associated macrophage populations. To identify mechanisms by which obesity affects antitumor immunity, we examined changes in cell populations and the role of the proinflammatory adipokine leptin in immunotherapy. Single-cell RNAseq demonstrated that obesity decreased tumor-infiltrating lymphocyte frequencies, and flow cytometry confirmed altered macrophage phenotypes with lower expression of inducible NO synthase and MHC class II in tumors of obese animals. When treated with anti-programmed cell death protein 1 (PD-1) Abs, however, obese mice had a greater absolute decrease in tumor burden than lean mice and a repolarization of the macrophages to inflammatory M1-like phenotypes. Mechanistically, leptin is a proinflammatory adipokine that is induced in obesity and may mediate enhanced antitumor immunity in obesity. To directly test the effect of leptin on tumor growth and antitumor immunity, we treated lean mice with leptin and observed tumors over time. Treatment with leptin, acute or chronic, was sufficient to enhance antitumor efficacy similar to anti-PD-1 checkpoint therapy. Further, leptin and anti-PD-1 cotreatment may enhance antitumor effects consistent with an increase in M1-like tumor-associated macrophage frequency compared with non-leptin-treated mice. These data demonstrate that obesity has dual effects in cancer through promotion of tumor growth while simultaneously enhancing antitumor immunity through leptin-mediated macrophage reprogramming.


Figures

Figure 1.
Figure 1.. Obesity increases tumor growth and decreases anti-tumor inflammation
A. Five-week old C57BL/6 male mice were maintained on a control standard chow diet (n=8) or 60% kcal from fat high-fat diet (n=8) for 12 weeks and body weight was measured weekly. Two-way ANOVA with Tukey post-hoc test p values used. B. Spleens from mice on their respective diet for 12 weeks were processed into single cell suspensions and were analyzed by flow cytometry for cytotoxic T cells. Representative histogram of mean fluorescence intensity (MFI), and frequency of CD44+ splenic CD8+ T cells following diet treatment. C. C57BL/6 male mice on a control standard chow diet (n=10) or 60 kcal high-fat diet (n=10) for 12 weeks were injected subcutaneously with 105 MC38-CEA1 cells in the right flank. Tumor growth over time measured by digital calipers for 16 days. Tumor volume calculated as (length x width2)/2. Tumors from mice with MC38-CEA1 tumors were collected 16 days post-injection and were processed into single cell suspensions before flow cytometric analysis. D. Absolute cell count of CD44+ cytotoxic CD8+ tumor-infiltrating lymphocytes (TILs) from LFD tumors (n=8) and HFD tumors (n=8). E. Frequency of CD11b+F4/80+Tumor-Associated Macrophages following diet treatment. F. Representative histogram of mean fluorescence intensity and frequency of iNOS+ TAMs following diet treatment. Two-tailed Mann Whitney test p values shown. *p < 0.05; ***p < 0.001; ****p < 0.0001; ns, not significant.
Figure 2.
Figure 2.. Obesity alters tumor immune cell landscape
A. UMAP plot with SingleR desgnations from single-cell RNA sequencing of CD45+ sorted intratumoral cells from lean and obese mice with subcutaneous MC38 tumors (3 tumors from each diet were pooled together in equal number of live cells). B. Density Gradient UMAP plots for LFD and HFD intratumoral cells. C. Frequency of singleR designated immune cell subtypes within respective diet. D. Violin Plots of Single cell gene expression of CD8+ T Cells and macrophages from CD45+ intratumoral cells in LFD and HFD treatments. Lack of statistical significance is indicated by “ns” while the other plots were at least p<0.05 significant following corrections.
Figure 3.
Figure 3.. Tumor-associated macrophages repolarize in diet-induced obese anti-PD-1 treated mice
A. Tumor volume calculations over time following subcutaneous injeciton of 2.5 × 10⁵ MC38-CEA1 cells in the right flank in C57BL/6 male mice fed a control standard chow diet (n=10) or 60 kcal high-fat diet (n=10) for 12 weeks. On day 5 post tumor cell-injection, mice were injected with either 200 μg IgG control antibody or anti-PD-1 antibody. The injections continued every two days until tumors were collected on day 16 post-injection. Tumor volume calculated as (length x width2)/2. Two-way ANOVA with Tukey post-hoc test p values were used. B. MC38-CEA1 tumors from LFD IgG (n=10), LFD PD1 (n=10), HFD IgG (n=10), and HFD PD1 (n=10) mice collected 16 days post-injection were processed into single cell suspensions. Representative histogram of MFI and frequency of MHCII+ on CD11b+F4/80+ TAMs measured by flow cytometry from LFD IgG (n=10), LFD PD1 (n=7), HFD IgG (n=10), and HFD PD1 (n=10). C. Unsupervised cluster analysis of differentially expressed metabolic mRNA transcripts from Nanostring analysis of sorted live CD45+ CD11b+ F4/80hi Ly6G Ly6Clo CD3 CD19 NKp46 macrophages from MC38 tumor suspensions (n=3). Data are shown as mean± S.E.M., with all individual points shown. Ordinary one-way ANOVA test p values shown. *p < 0.05; **p < 0.01; ****p < 0.0001; ns, not significant.
Figure 4.
Figure 4.. Leptin decreases tumor growth and promotes TAM repolarization
A. Plasma collected from MC38-CEA1 tumor-bearing C57BL/6 male mice on a control standard chow diet (n=6) or 60 kcal high-fat diet (n=8) was measured for leptin by ELISA. Two-tailed Mann Whitney test p values shown. B. Five-week old C57BL/6 male mice on a control standard chow diet were injected with either 200 μL of leptin (1 μg/g body weight) or PBS control twice a day for two weeks before subcutaneous injections with 105 MC38-CEA1 cells were given in the right flank. Leptin injections continued twice daily throughout the tumor growth period. MC38-CEA1 tumor volume over time of PBS or leptin-treated mice measured using digital caliper. Two-way ANOVA with Tukey post-hoc test p values used. C. MFI and corresponding frequency of MHCII and CD86 expression on CD11b+ and F480+ TAMs. Data are shown as mean± S.E.M., with all individual points shown. Two-tailed Mann Whitney test p values shown. *p < 0.05; **p < 0.01; ***p < 0.001.
Figure 5.
Figure 5.. Acute leptin treatments cooperate with PD1 blockade immunotherapy and repolarize TAMs to M1-like phenotypes
Five-week old C57BL/6 male mice were given subcutaneous injections with 2.5 × 10⁵ MC38-CEA1 cells in the right flank. On day 5 post tumor-injection, mice were injected with either 200 μg IgG control antibody or αPD-1 antibody, and the injections continued every two days. Additionally, on day 5 post-tumor injection, mice received either leptin (1 μg/g body weight) or PBS control twice a day. A. Tumor volume over time for the PBS IgG antibody (n=10), Leptin IgG antibody (n=10), PBS + anti-PD-1 antibody (n=10), and Leptin + anti-PD-1 antibody continued until 16 days post-injection. Two-way ANOVA with Tukey post-hoc test p values used. B. Frequency of CD11b+ and F4/80+ TAMs. C. Frequency of MHCII+ TAMs. D. Representative histogram and corresponding MFI expression of iNOS2 in TAMs. Two-tailed Mann Whitney test p values shown. *p < 0.05; **p < 0.01; ***p < 0.001, ****p < 0.0001.

References

    1. Venegas O, and Mehrzad R. 2020. Prevalence and trends in obesity in the United States and affluent countries. In Obesity Elsevier. 19–41.
    1. Secretan BL, Scoccianti C, Loomis D, and for R IA. on C. H. W. Group. 2016. Body Fatness and Cancer — Viewpoint of the IARC Working Group. N Engl J Med 375: 794–798. - PMC - PubMed
    1. Calle EE, Rodriguez C, Walker-Thurmond K, and Thun MJ. 2003. Overweight, Obesity, and Mortality from Cancer in a Prospectively Studied Cohort of U.S. Adults. N Engl J Med 348: 1625–1638. - PubMed
    1. Carmichael a R., and Bates T. 2004. Obesity and breast cancer: a review of the literature. Breast 13: 85–92. - PubMed
    1. Wang Z, Aguilar EG, Luna JI, Dunai C, Khuat LT, Le CT, Mirsoian A, Minnar CM, Stoffel KM, Sturgill IR, Grossenbacher SK, Withers SS, Rebhun RB, Hartigan-O’Connor DJ, Méndez-Lagares G, Tarantal AF, Isseroff RR, Griffith TS, Schalper KA, Merleev A, Saha A, Maverakis E, Kelly K, Aljumaily R, Ibrahimi S, Mukherjee S, Machiorlatti M, Vesely SK, Longo DL, Blazar BR, Canter RJ, Murphy WJ, and Monjazeb AM. 2019. Paradoxical effects of obesity on T cell function during tumor progression and PD-1 checkpoint blockade. Nat. Med 25: 141–151. - PMC - PubMed

Publication types

Substances