. 2021 Dec;31(12):2225-2235.
doi: 10.1101/gr.275323.121. Epub 2021 Nov 12.

Mutagenesis of human genomes by endogenous mobile elements on a population scale

Affiliations

Mutagenesis of human genomes by endogenous mobile elements on a population scale

Nelson T Chuang et al. Genome Res. 2021 Dec.

Abstract

Several large-scale Illumina whole-genome sequencing (WGS) and whole-exome sequencing (WES) projects have emerged recently that have provided exceptional opportunities to discover mobile element insertions (MEIs) and study the impact of these MEIs on human genomes. However, these projects also have presented major challenges with respect to the scalability and computational costs associated with performing MEI discovery on tens or even hundreds of thousands of samples. To meet these challenges, we have developed a more efficient and scalable version of our mobile element locator tool (MELT) called CloudMELT. We then used MELT and CloudMELT to perform MEI discovery in 57,919 human genomes and exomes, leading to the discovery of 104,350 nonredundant MEIs. We leveraged this collection (1) to examine potentially active L1 source elements that drive the mobilization of new Alu, L1, and SVA MEIs in humans; (2) to examine the population distributions and subfamilies of these MEIs; and (3) to examine the mutagenesis of GENCODE genes, ENCODE-annotated features, and disease genes by these MEIs. Our study provides new insights on the L1 source elements that drive MEI mutagenesis and brings forth a better understanding of how this mutagenesis impacts human genomes.


Figures

Figure 1.
Figure 1.
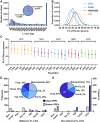
MEIs discovered in this study. (A) MEIs that we discovered are broken down by population and MEI type. At the top (labeled “Merged”), 104,350 nonredundant MEIs were discovered. (B) A comparison of our study with three other published MEI discovery projects (1KGP LC, GTEx, and gnomAD-SV) (Sudmant et al. 2015; Cao et al. 2020; Collins et al. 2020, respectively). The four-way Venn diagram comparing these studies with our data set indicates that 65,192 (or 62.3%) of our MEIs are novel. All these MEI discovery studies were performed with MELT.
Figure 2.
Figure 2.
FL-L1Hs elements discovered in this study. (A) We identified 3728 FL-L1Hs elements that are 6 kb or longer within the collection of 16,525 L1 MEIs that were discovered in this study. Because MELT could estimate the lengths of 14,066/16,525 (85.1%) L1s, we calculated the percentages in A using the denominator of 14,066. (B) Comparisons of FL-L1Hs elements per genome in the four WGS studies of our study. The GTEx and Amish populations have fewer FL-L1Hs copy numbers compared to the 1KG population and the Jackson Heart Study. (C) Population distribution of FL-L1Hs elements arranged by superpopulation of the 1KGP 2504 high-coverage genomes. (D,E) REF and non-REF FL-L1Hs elements with their subfamily distributions. Corresponding bar plots indicate the number of FL-L1Hs elements with two intact ORFs (solid bars). (E) The majority of FL-L1Hs elements in the non-REF group belong to the Ta1d subfamily and have two intact ORFs (bottom right). Note also the expansion of Ta1d elements in non-REF populations compared to REF (from 15% to 67%; compare purple sections in D and E). The white 61 numeral in E indicates the number of elements in this group with documented activity in the literature (Supplemental Table S3A).
Figure 3.
Figure 3.
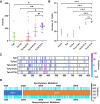
Three novel Ta1d subfamilies of FL-L1Hs elements. (A) Table of canonical positions defining L1 subfamilies building upon those published previously (Boissinot et al. 2000; Brouha et al. 2003). Positions in red are new canonical positions discovered in our sequenced FL-L1Hs elements. Note that positions 1026, 3337, and 3440 define three new subfamilies according to the sequences at those positions. (B) A phylogenetic tree was constructed using subfamily consensus sequences to evaluate the relationship of known subfamilies versus new ones (Supplemental Table S3C). The tree was calculated using the neighbor-joining method and distances were corrected using the Kimura 2-parameter model. The numbers at each node represent the percentage of replicate trees that clustered together in 1000 bootstrap tests. (C,D) Reference and non-reference proportions of Ta1d subfamilies that show expansion of the Ta1d-TCA subfamily in non-reference populations (D). Note the expansion from 9% to 32% (dark purple) when comparing the Ta1d-TCA subfamily in reference (C) versus non-reference (D). The white numerals in D indicate the number of FL-L1Hs elements that were found to be active in the literature for each subfamily (Supplemental Table S3A).
Figure 4.
Figure 4.
Analysis of new subfamilies, CpGs, and other interior sequence changes in our FL-L1Hs elements. (A) We identified elements from various L1 subfamilies (including our three novel subfamilies) that previously had been sequenced and tested in cell culture retrotransposition assays (Beck et al. 2010). Note that the new Ta1d-TCA subfamily has the highest levels of activity followed by the new Ta1d-CCA subfamily. The Ta1d-CAT and Ta0 subfamilies have similar activities. Significance was calculated by one-way ANOVA corrected for multiple comparisons by the Tukey method. Error bars represent 95% confidence intervals. (B) We also plotted the number of CpGs by subfamily in our sequenced FL-L1Hs elements and found that our three new subfamilies (Ta1d-CAT, Ta1d-CCA, and Ta1d-TCA) have 1–2 additional CpGs in their promoter regions compared to older subfamilies. (C) Mutations in the promoter region causing a gain or loss of CpGs for each L1 subfamily. The color shows the frequency of gain or loss as denoted by the diverging color map. (D) Mutations within the two ORFs. Note the synonymous and nonsynonymous mutations above and below the ORF map, respectively. The frequency of the mutations also is shown with the diverging color map.
Figure 5.
Figure 5.
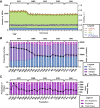
MEI counts per individual and population sharing across the 26 diverse 1KGP populations. (A) The numbers of MEIs per individual are depicted for the 26 diverse 1KGP populations: (light blue) LINE1; (light green) Alu; (light brown) SVA; (red) HERV-K. Dark lines of the same colors represent the boundaries between element classes. The dark purple line indicates the number of non-REF FL-L1Hs elements per individual. Note that the AFR populations have the highest MEI counts, consistent with previous studies (Sudmant et al. 2015). (B) Sharing of MEIs across the 26 diverse populations of the 1KGP. (C) MEIs that are unique to one of the 26 1KGP populations are broken down into singleton and non-singleton categories. We also performed similar analysis comparing the Amish, Jackson Heart Study, and the UKBB populations (Supplemental Fig. S6).
Figure 6.
Figure 6.
MEI mutagenesis patterns in GENCODE, ENCODE, and various databases. (A) Comparisons of the combined collection of 158,783 MEIs depicted in Figure 1B revealed intersections with GENCODE v35 gene annotations. The total number of GENCODE transcripts intersected by MEIs is 97,103. All features impacted by MEIs (exons, etc.) are found within these transcripts. The UTRs and CDSs also are included in the exon group, because they also are exons. In cases in which multiple transcript models are intersected by MEIs, all transcripts and features are listed in Supplemental Table S6A and are delimited by commas in the same order for each column. We identified insertions that disrupt various subregions of genes including 781 MEIs that disrupt CDS exon sequences. (B) MEIs disrupt ENCODE-annotated cis-candidate regulatory elements (cCREs). (C) MEIs disrupt genes that have been linked to various diseases in the Online Mendelian in Man (OMIM) database. Although all these MEIs disrupt genes and their annotated features, these insertions may or may not have functional consequences. MEIs that disrupt coding exons or ENCODE transcriptional regulators likely produce functional consequences. MEIs that occur within introns, UTRs, and other functionally important sites also can impact gene function (e.g., Watanabe et al. 2005; Lanikova et al. 2013). However, the precise functional consequences of gene-disrupting MEI insertions can be difficult to predict and must be validated experimentally.

References

    1. Baillie JK, Barnett MW, Upton KR, Gerhardt DJ, Richmond TA, De Sapio F, Brennan PM, Rizzu P, Smith S, Fell M, et al. 2011. Somatic retrotransposition alters the genetic landscape of the human brain. Nature 479: 534–537. 10.1038/nature10531 - DOI - PMC - PubMed
    1. Beck CR, Collier P, Macfarlane C, Malig M, Kidd JM, Eichler EE, Badge RM, Moran JV. 2010. LINE-1 retrotransposition activity in human genomes. Cell 141: 1159–1170. 10.1016/j.cell.2010.05.021 - DOI - PMC - PubMed
    1. Boissinot S, Chevret P, Furano AV. 2000. L1 (LINE-1) retrotransposon evolution and amplification in recent human history. Mol Biol Evol 17: 915–928. 10.1093/oxfordjournals.molbev.a026372 - DOI - PubMed
    1. Brouha B, Schustak J, Badge RM, Lutz-Prigge S, Farley AH, Moran JV, Kazazian HH Jr. 2003. Hot L1s account for the bulk of retrotransposition in the human population. Proc Natl Acad Sci 100: 5280–5285. 10.1073/pnas.0831042100 - DOI - PMC - PubMed
    1. Cao X, Zhang Y, Payer LM, Lords H, Steranka JP, Burns KH, Xing J. 2020. Polymorphic mobile element insertions contribute to gene expression and alternative splicing in human tissues. Genome Biol 21: 185. 10.1186/s13059-020-02101-4 - DOI - PMC - PubMed

LinkOut - more resources